UNIT 1
Introduction To Engineering Drawing
Use of various drawing instruments
Why they are needed?
To record information on paper (or another surface), instruments and equipment are required. Even for drawings made freehand, pencils, erasers, and sometimes coordinate paper or other special items are used. The lines made on drawings are straight or curved (including circles and arcs). They are made with drawing instruments, which are the necessary tools for laying down lines on a drawing in an accurate and efficient manner. To position the lines, a measuring device, a scale, is needed.
The various instruments will be described in detail later, but the opening of this chapter will serve as an introduction. To draw straight lines, the T square, with its straight blade and perpendicular head, or a triangle is used to support the stroke of the pencil. To draw circles, a compass is needed. In addition to the compass, the draftsman needs dividers for spacing distances and a small bow compass for drawing small circles. To draw curved lines other than circles, a French curve is required. A scale is used for making measurements.
Drawing Paper
Drawing paper is made up of variety of qualities and manufactured in sheets or rolls. White drawing papers that will not turn yellow with age or exposure are used for finished drawings, maps, charts, and drawings for photographic reproduction. For pencil layouts and working drawingsbuff detail papers are preferred as they are easier on the eyes compared to white papers.
Tracing paper
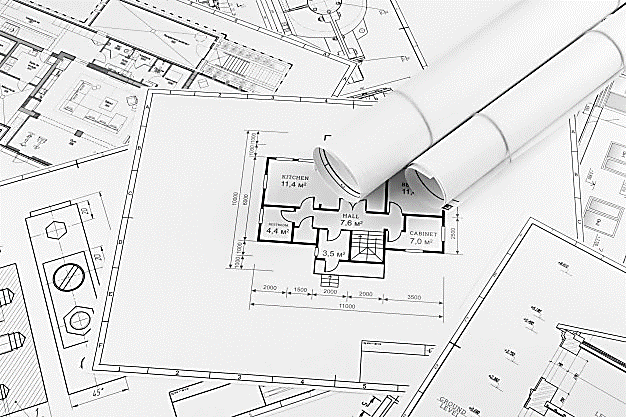
Tracing papers are thin papers, natural or transparent, on which drawings are traced, in pencil or ink, and from which blueprints or similar contact prints can be made. In most drafting rooms original drawings are penciled on tracing papers, and blueprints are made directly from these drawings, a practice increasingly successful because of improvements both in papers and in printing.
Thumbtacks
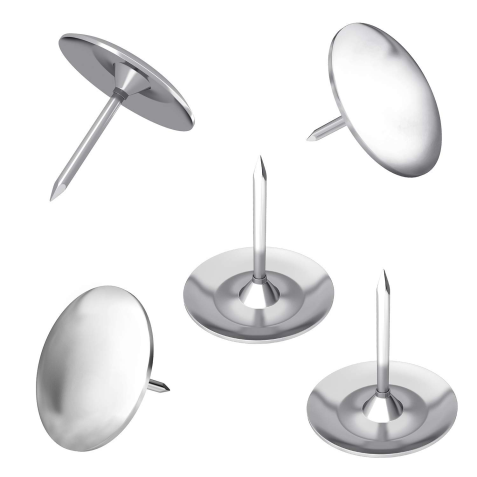
The best thumbtacks are made with thin heads and steel points screwed into them. Cheaper ones are made by stamping. Use tacks with tapering pins of small diameter and avoid flat-headed (often colored) map pins, as the heads are too thick and the pins rather large.
Pencils
The basic instrument is the graphite lead pencil, made in various hardness’s. Each manufacturer has special methods of processing design to make the lead strong and yet give a smooth clear line.
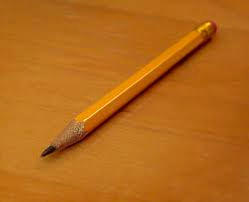
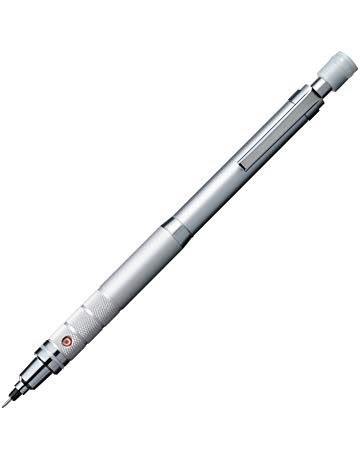
In the left there is an ordinary pencil, with the lead set in wood and the other is a semi-automatic pencil with thinner leads. Both are fine but have the disadvantage that in use, the wood must be cut away to expose the lead (a time-consuming job), and the pencil becomes shorter and shorter until the last portion of it is to be discarded.Whereas semiautomaticpencils, with a chuck to clamp andhold the lead, are moreconvenient, has a plastic handle and changeable tip (for indicating the grade of lead).
Drawing pencils are graded by numbers and letters from 6B which is very soft and black, to 5B, 4B, 3B, 2B, B, and HB to F, the medium grade; then H, 2H, 3H, 4H, 5H, 6H, 7H, and 8H to 9H, the hardest. The soft (B) grades are used primarily for sketching and rendered drawings and the hard (H) grades for instrument drawings.
Pencil Pointer
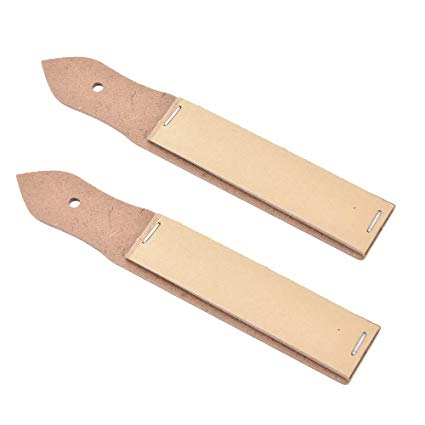
After the wood of the ordinary pencil is cut away with a pocketknife or mechanical sharpener, the lead must be formed to a long, conic point.
A pencil pointer is a tool for sharpening a pencil’s writing point by shaving away its worn surface.
Erasers
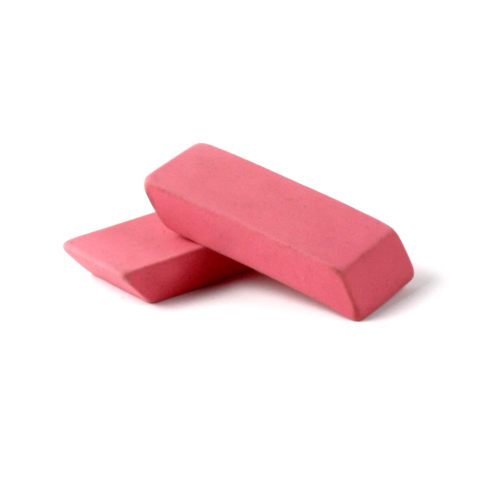
The Ruby pencil eraser, large size with beveled ends, is the standard. This eraser not only removes pencil lines effectively but is better for ink, as it removes ink without seriously damaging the surface of paper or cloth.
Artgum or a soft-rubber eraser, is useful for cleaning paper and cloth of finger marks and smears that spoil the appearance of the completed drawing.
Penholders and Pens.
The penholder should have a grip of medium size, small enough to enter the mouth of a drawing-inkbottle easily yet not so small as to cramp the fingers while in use. A size slightly larger than the diameterof a pencil is good.
Triangles
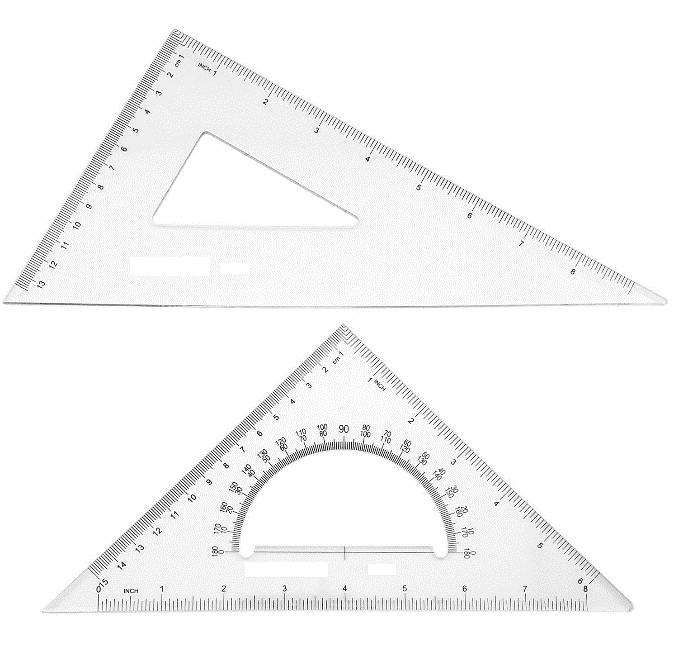
Triangles, are made of transparent hard or other plastic material. Through internal strains they sometimes lose their accuracy. Triangles should be kept flat to prevent warping. For ordinary work, a 6- or 8-in. 45° and a 10-in. 30-60° are good sizes.
The T squares
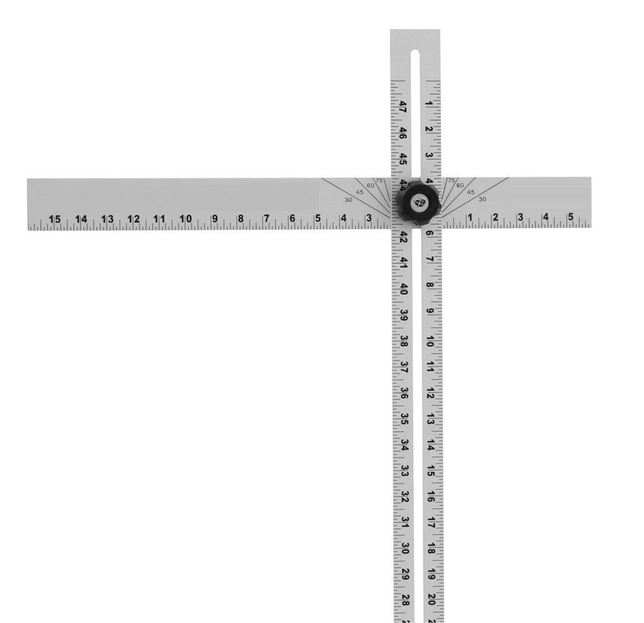
The fixed-head T square, is used for all ordinary work. It should be of hardwood, and the blade should be perfectly straight. The transparent-edged blade is much the best. A draftsman will have severalfixed-head squares of different lengths and will findan adjustable-head square of occasional use.
Scales
Scales, are made in various number of graduations to meet the requirements of many kinds of work. For convenience, scales are classified according to their most-common uses.
Mechanical Engineers Scale:
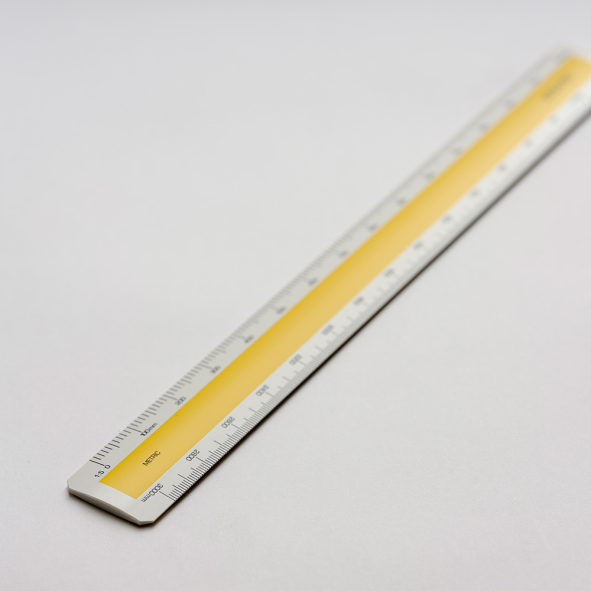
These are divided and numbered in such a way that fractions of inches represent inches. The most common ranges are 1/8, 1/4, 1/2, and 1 in. To the inch. These scales are known as the size scales because the reduced size also represents the ratio of size, as for example one-eighth size.
Mechanical engineer's scales are almost always "full divided"; that is, the smallest divisions run throughout the entire length.
They are generally graduated with the marked divisions numbered from right to left, as well as from left to right, as shown in Figure Mechanical engineer's scales are used mostly for drawings of machine parts and small structures where the drawing size is more than one-eighth the size of the actual object.
Civil Engineers Scale:
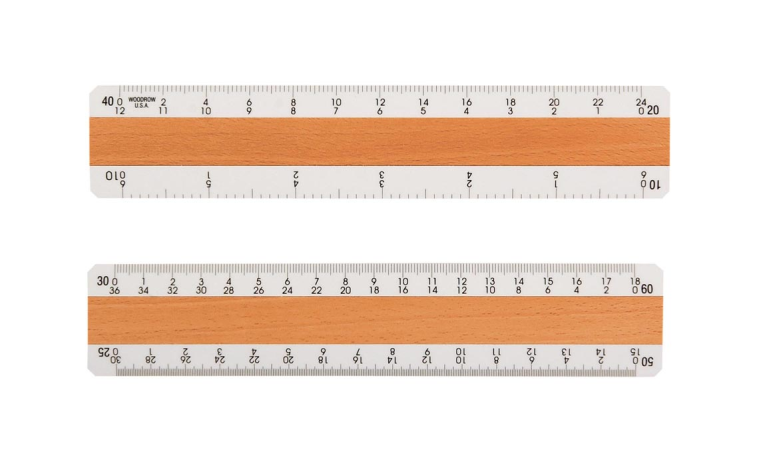
These are divided into decimals with divisions ranging from 10, 20, 30, 40, 50, 60, and 80 to the inch. Such a scale is usually full divided and is sometimes numbered both from left to right and right to left. Civil engineer's scales are most used for plotting and drawing maps, although they are convenient for any work where divisions of the inch in tenths is required.
Metric Scales:
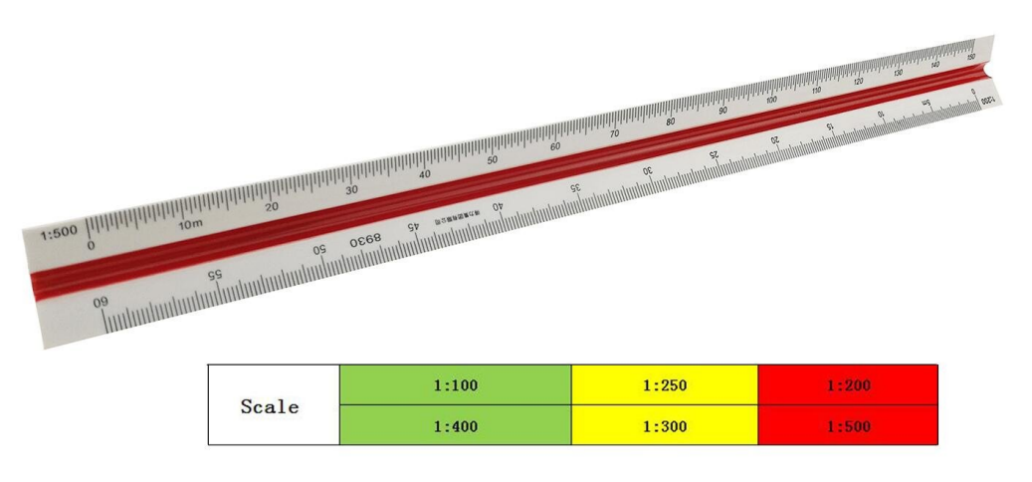
Metric scales are supplied in all the styles and sizes and materials of other scales. They are usually full-divided and are numbered in meters, centimeters, or millimeters depending upon the reduction in size. Typical size reductions are: 1:1, 1:2, 1:5, 1:10, 1:20, 1:25, 1:33.3, 1:50, 1:75, 1:80, 1: 100, 1: 150. Also available are metric equivalent scales for direct conversion of English scales.
Curves:
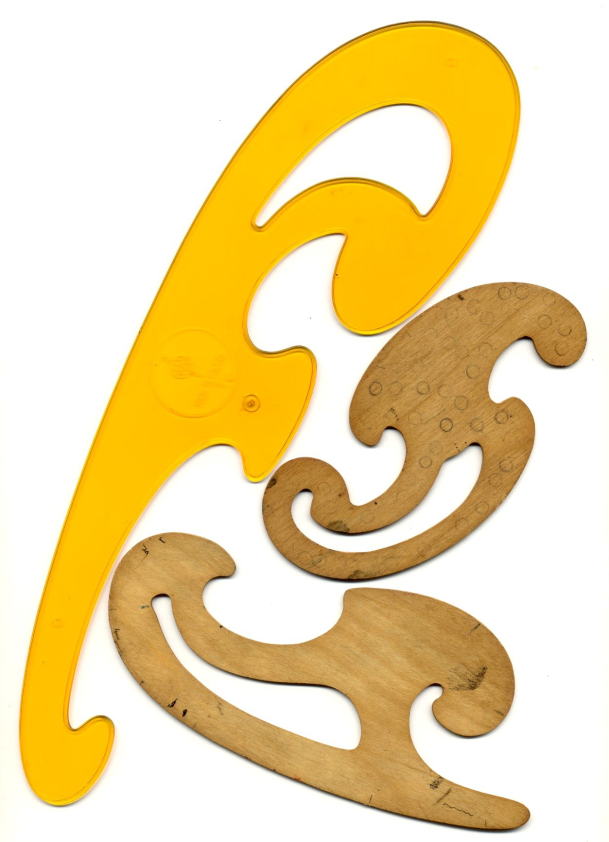
Curve rulers, called "irregular curves" or "French curves," are used to draw curved lines other than circular arcs. The patterns for these curves are laid out in parts of ellipse and spirals or other mathematical curves in various combinations. For the student, one ellipse curve of the general shape or one spiral, either a logarithmic spiral is a useful small curve.
The Case Instruments:
We have so far, except for curves considered only the instruments needed for drawing straight lines. A major portion of any drawing is likely to be circles and circle arcs, and the so called “case” instruments are used for these.
Divider:
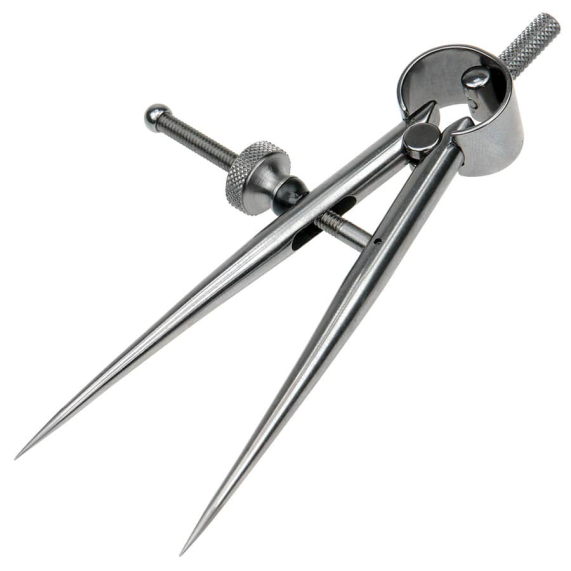
It is used for laying off or transferring measurements.
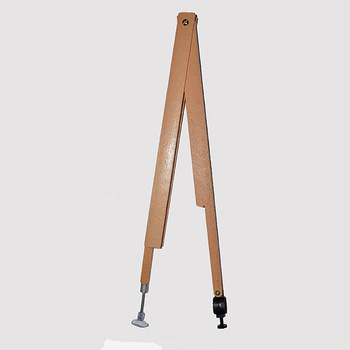
Next is the large compass with lengthening bar and pen attachment. The three “bow” instruments are for smaller work. They are almost always made without the conversion feature.
The ruling pen is used for inking straight lines.
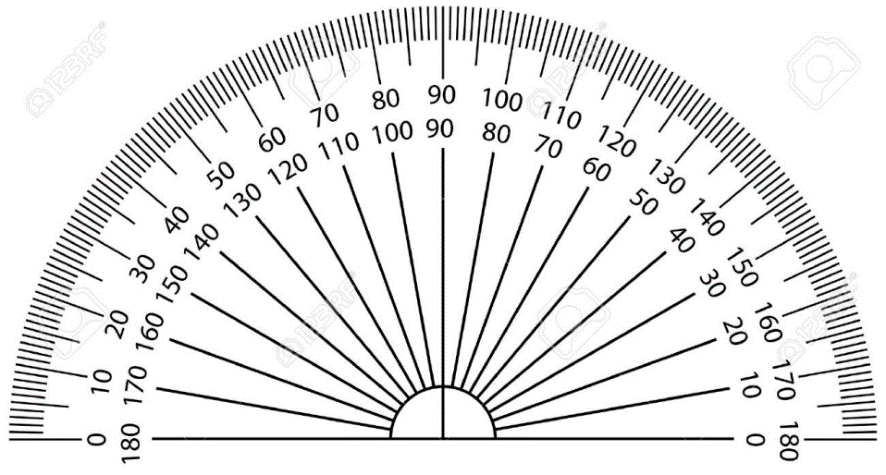
Protractor is used to measure angles upto 180°.
Cautions in the use of Instruments:
1. Scales are not to be used as a ruler for drawing lines.
2. Horizontal lines with the lower edge should not be drawn with a T square.
3. The lower edge of T square should not be used as a base for drawing triangles.
4. T square is not to be used as hammer.
5. Never put either end of a pencil into the mouth.
6. Never sharpen a pencil over a drawing board.
7. Never oil the joints of compasses.
8. Never begin work without wiping off the table and instruments.
9. Never work on a table cluttered with unneeded instruments or equipment’s.
10. Never fold a drawing or a tracing.
Conventions in Drawing, Lettering, BIS conventions
Lettering:
Graphic representation of the shape of a part, machine, or structure gives one aspect of the information needed for its construction. To this must be added, to complete the description, figured dimensions, notes on material and finish, and a descriptive title—all lettered, freehand, in a style that is perfectly legible, uniform, and capable of rapid execution. As far as the appearance of a drawing is concerned, the lettering is the most important part. But the usefulness of a drawing, too, can be ruined by lettering done ignorantly or carelessly, because illegible figures are apt to cause mistakes in the work.
Single stroke lettering:
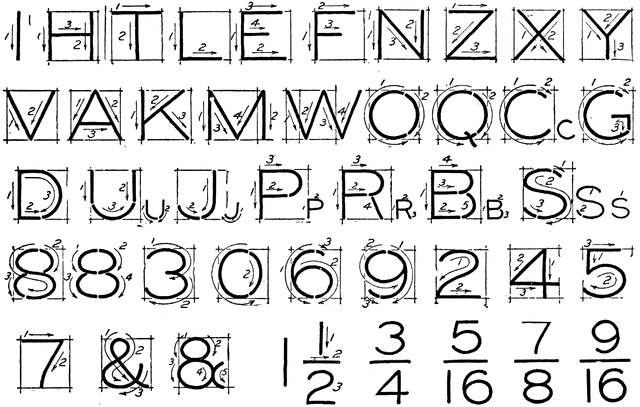
By far the greatest amount of lettering on drawings is done in a rapid single-stroke letter, either vertical or inclined, and every engineer must have absolute command of these styles.
The term "single-stroke," or "one-stroke," does not mean that the entire letter is made without lifting the pencil or pen but that the width of the stroke of the pencil or pen is the width of the stem of the letter.
Guide lines:
Always draw light guide lines for both tops and bottoms of letters, using a sharp pencil. Figure 1 shows a method of laying off several equally spaced lines. Draw the first base line; then set the bow spacers to the distance wanted between base lines and step off the required number of base lines. Above the last line mark the desired height of the letters.
Lettering in Pencil:
Good technique is as essential in lettering as in drawing. The quality of the lettering is important whether it appears on finished work to be reproduced by one of the printing processes or as part of a pencil drawing to be inked. In the first case, the penciling must be clean, firm, and opaque; in the second, it may be lighter.
Single - stroke Vertical Capitals:
The vertical, single-stroke, commercial Gothic letter is a standard for titles, reference letters, etc. As for the proportion of width to height, the general rule is that the smaller the letters are, the more extended they should be in width.
A low extended letter is more legible than a high compressed one and at the same time makes a better appearance.
Vertical lower-case letters:
The single-stroke, vertical lower-case letter is not commonly used on machine drawings but is used extensively in map drawing. It is the standard letter for hypsography in government topographic drawing. The bodies are made two-thirds the height of the capitals with the ascenders extending to the capital line and the descenders dropping the same distance below.
Single strokes Inclined capitals:
Many draftsmen use the inclined, or slant, letter in preference to the upright. The order and direction of strokes are the same as in the vertical form.
Single stroke, Inclined lower-case letters:
The inclined lower-case letters have bodies two-thirds the height of the capitals with the ascenders extending to the capital line and the descenders dropping the same distance below the base line. The lower-case letter is suitable for notes and statements on drawings because it is much more easily read than all capitals.
The loop letters are made with an ellipse whose long axis is inclined about 45° in combination with a straight line.
Titles:
The most important problem in lettering composition is the design of titles. Every drawing has a descriptive title that is either all hand-lettered or filled in on a printed form. It gives necessary information concerning the drawing, and the information that is needed will vary with the different kinds of drawings. The usual form of lettered title is the symmetrical title, which is balanced or "justified" on a vertical center line and designed with an elliptical or oval outline.
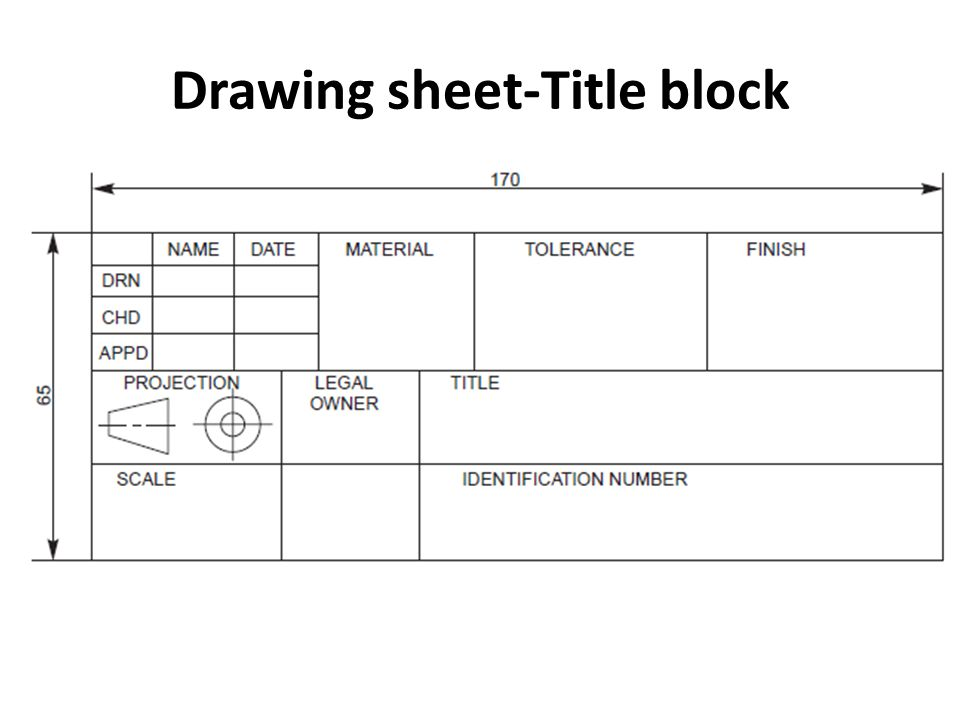
Layout of drawing sheet, sizes of drawing sheets
Sheet layout:
The paper is usually cut somewhat in larger dimension than the desired size of the drawing and trimmed to size after the work is finished. Suppose the finished size is to be 11 by 17 in. With a 1/2 in. Border inside. Lay the scale down on the paper close to the lower edge and measure 17 in., marking the distance with the pencil; at the same time mark 1/2 in. Inside at each end for the border line. Use a short dash forming a continuation of the division line on the scale in laying off a dimension. Do not bore a hole with the pencil. Near the left edge mark 11- and 1/2 -in. Borderline points. Through these four marks on the left edge, draw horizontal lines with the T square; and through the points on the lower edge, draw vertical lines, using the triangle against the T square
Different types of lines used in drawing practice, Dimensioning
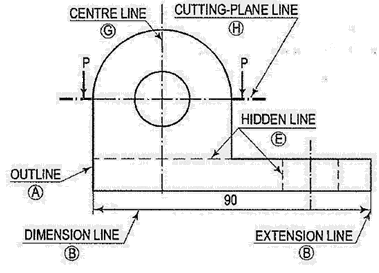
1. Outlines (A): Lines drawn to represent visible edges and surface boundaries of objects are called outlines or principal lines. They are continuous thick or wide lines.
2. Long-break lines (D): These lines are thin ruled lines with short zigzags within them. They are drawn to show long breaks.
3. Margin lines (A): They are continuous thick or wide lines along which the prints are trimmed.
4. Dimension lines (B): These lines are continuous thin lines. They are terminated at the outer ends by pointed arrowheads touching the outlines, extension lines or center lines.
5. Extension or Projection lines (B): These lines are also continuous thin lines. They extend by about 3mm beyond the dimension lines.
6. Construction lines (B): These lines are drawn for constructing figures. They are shown in geometrical drawings only. They are continuous thin lines only.
7. Hidden or dotted lines (E or F): Interior or hidden edges and surfaces are shown by hidden lines. They are also called dotted lines. They are of medium thickness and made up of short dashes of approximately equal lengths of about 2 mm spaced at equal distances of about 1 mm.
8. Centre lines (G): Centre lines are drawn to indicate the axes of cylindrical, conical or spherical objects or details, and to show the centers of circles and arcs. They are thin, long, chain lines composed of alternately long and dot spaced approximately 1 mm apart. The long dashes are about 9 to 12 mm.
9. Border lines (B): Perfectly rectangular working space is determined by drawing the border lines. They are continuous thin lines.
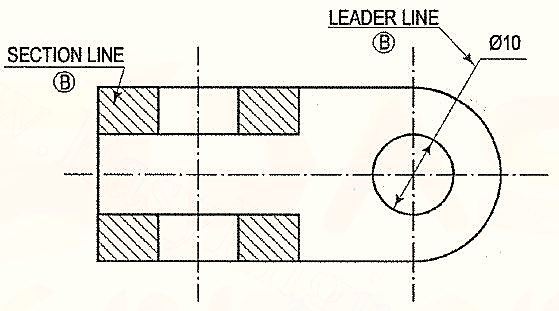
10. Hatching or section lines (B): These lines are drawn to make section evident. They are continuous thin lines and are drawn and are drawn at an angle of 45° to the main outline of the section. They are uniformly spaced about 1mm to 2mm apart.
Line | Description | General application |
| Continuous thick or continuous wide | Visible outlines, visible edges, main representation in diagrams, maps; system lines |
| Continuous thin (narrow) (straight or curved) | Imaginary lines of intersection; grid, dimension. Extension, projection, reference lines and hatching. |
| Continuous thin (narrow) freehand. | Limits of partial or interrupted views and sections, if the limit is not a chain thin line. |
| Continuous thin (narrow) with zigzags (straight) | Long break line |
 | Dashed thick (wide) | Line showing permissible of surface treatment. |
 | Dashed thin (narrow) | Hidden outline; hidden edges |
 | Chain thin Long-dashed dotted (narrow) | Centre line; lines of symmetry; trajectories; pitch circle of gears, pitch circle of holes. |
 | Chain thick or long - dashed (dotted) wide | Indication of lines or surfaces to which a special requirement applies. |
Dimensioning:
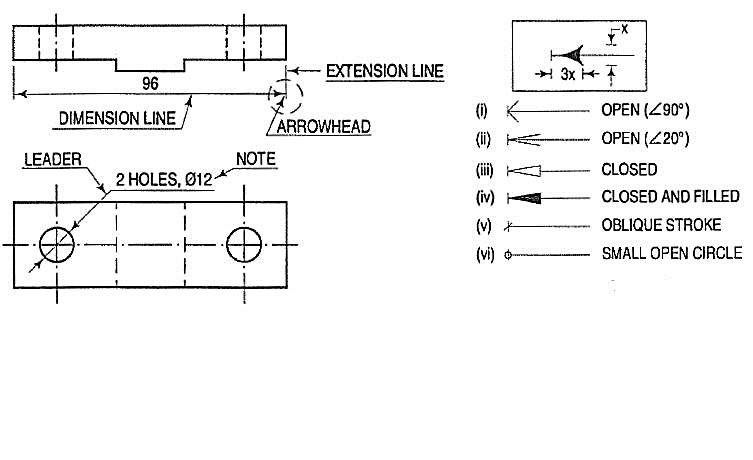
1. Dimension line: Dimension line is a thin continuous line. It is terminated by arrowheads touching the outlines, extension lines or center lines.
2. Extension line: An extension line is also a thin continuous line drawn in extension of an outline. It extends by about 3mm beyond the dimension line.
3. Arrowhead: An arrowhead is placed at each end of a dimension line. Its pointed end touches an outline, an extension line or a center line. The size of an arrowhead should be proportional to the thickness of the outlines. The length of the arrowhead should be about the three times its maximum width.
4. Leader: A leader or a pointer is a thin continuous line connecting a note or a dimension figure with the feature to which it applies. One end of the leader terminates either in an arrow head or a dot. The arrowhead touches the outline, while the dot is placed within the outline of the object.
Introduction to computer aided drafting package
Manufacturing of a product is the main activity in engineering profession. The design of a product may start with trial designs in the form of sketches on paper. As the design improves and undergoes changes, the final form of design must be the scaled manufacturing drawings with finer details included. These drawings are two-dimensional representations of three dimensional objects designed.
During the process of design, the designer may have to carry out a large amount of computations so that an optimum design is obtained. A computer with good graphic capabilities helps the designer to,
(i) realize his ideas.
(ii) carry out complex computations.
(iii) present the results of computations in a useful form for decision making and possible improvement.
(iv) present the improved model for evaluation. Interactive Computer Graphics (ICG) is the tool of the designer.
1. Computer aided drafting
A part to be manufactured is defined first in terms of its geometry which also includes dimensions, tolerances, surface finish, and in some cases the type of fit between two mating parts. The two-dimensional representation of a part, called an engineering drawing or a blueprint, shows three orthogonal views of the part. Sometimes, when three views are not enough to define the part, additional sectional views, auxiliary views may have to be added for conveying the right information.
Any design is finally represented in the form of orthographic views and auxiliary views so that production can be carried out. Hence, the computer aided drafting is an important tool for Computer Aided Design. The Computer Aided Drafting (CAD) system is the computerization of technical, production, electronics and architectural drawings.
CAD is the product of computer era. Its development originated from early computer graphics systems. CAD can find its roots to the development of Interactive Computer Graphics (ICG). A system called Sketchpad was developed at Massachusetts Institute of Technology, U.S.A., in 1963 by Ivan Sutherland.
In the beginning, CAD systems were no more than graphics editors with some built-in design symbols. The geometry available to the user was limited to lines, circular arcs, and a combination of the two. The development of free-form curves and surfaces such as Coon's patch, Ferguson's patch, Bezier's curve, and 8-splines enabled a CAD system to be used for more sophisticated work. A 30 CAD system allows a user to do very sophisticated design and analysis work.
Computer aided drawing and drafting system uses the computer to assist in generation of blueprint data. CAD systems are essential in design and many computers based systems are commercially available. 20 drawing systems correspond directly to traditional engineering drawings, and they are developed to substitute manual drafting.
The advantages offered by computerized drafting systems can be summarized as:
(a) It increases the accuracy and productivity of designer.
(b) It allows design alterations to be made easily.
(c) It offers better drawing visualization through colours.
(d) It improves the quality of drawings produced.
(e) Drawings are easier to store and retrieve.
(f) Storage space required is less.
(g) Transfer of drawings is faster and cheaper.
(h) It permits the use of library of standard symbols for more productive CAD work.
Although the capital investment required in setting up a computer aided drafting system is high, the greater capabilities offered by computers and software are making the systems more affordable.
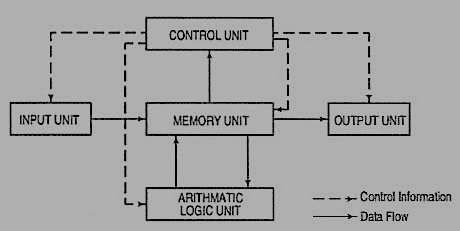
Computer (fig.1):
A computer system consists of
(a) Central Processing Unit (CPU), also known as processor
(b) Main memory
(c) Input devices
(d) Output devices
(e) Secondary storage devices.
The CPU controls and supervises the entire computer system. The actual arithmetic and logical operations are performed by CPU with the help of main memory. The main memory stores program instructions and processing data. Secondary storage devices provide slow but high capacity memory for storing program and large amount of data that is not currently being processed. Typical secondary storage devices are hard disk, floppy diskettes, magnetic tape, C.D. (compact disk), D.V.D., pen drive, etc.
During operation, data flows between the CPU, the main memory, and the various input/output devices. Moreover, the control information flows between these units to tell what to do with the data. Control information is used to manage the overall operation of the system.
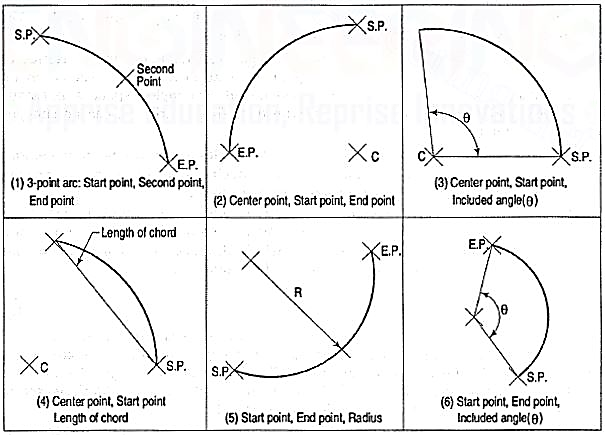
Figure 1 Organisation of a computer
It must be remembered that the main memory is directly connected to the CPU. The main memory stores the program instructions and all the data being used for processing until the data are released as output under the instructions from the CPU. A control unit inside the CPU directs and coordinates all the operations of the system that are called for by the program. It involves control of the input and output devices, the storage and retrieval of information from memory, and the transfer of data between memory and ALU.
A CAD system consists of Hardware and Software. The system usually has the following major hardware elements:
Processor (CPU)
Every CAD system must have a CPU to process and store a very large amount of graphics data. The speed and processing power of a computer is mainly decided by the CPU speed and the amount of main memory (RAM) installed.
Display
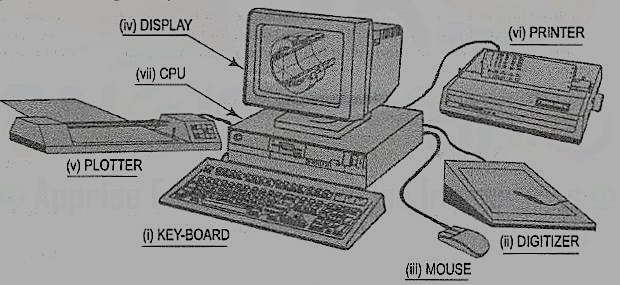
The most common type of display device for CAD systems is a Cathode Ray Tube (CRT). The display device must be capable of displaying both graphical and alphanumeric data. Although the display looks like television monitors, they have special electronics for creating graphics images on the screen from computer processed data as per the instructions. But, they lack the television program receiving capability. Since both graphics and text are to be displayed simultaneously on the screen, the graphics monitor is usually divided into graphics area and a small text display area (see fig. 2).
The capabilities of display devices are evaluated in terms of resolution, colours and picture refresh rate. Picture refresh rate is important to get a steady and flicker free display. For a general-purpose graphics system, a display with 1024 (horizontal) by 768 (vertical) pixel resolution, 0.28 mm dot pitch and 256 shades of colours is the desirable configuration. The small dot pitch gives a high resolution and therefore good quality picture.
Input Devices
(1) [fig. 2(i)]: This is the most common input device. It is preferred for entering commands, text or value such as coordinates of a point or radius of a circle. The 101-key keyboards have special function keys to support special graphic functions. Whenever a key is pressed, the key character is identified by the computer and a character is displayed on the screen. If function keys are pressed or a combination of keys is pressed, the software takes the appropriate action.
(2) Mouse [fig. 2(iii)]: The mouse is a pointing device which is moved across a flat surface (usually on a mouse pad) by hand to indicate X-Y movement. The rotation of rubber ball underneath the device is translated and the corresponding cursor movement on the screen provides a visual feedback. The mouse is used as a pointing and pick-up device.
Either two-button or three-button mice are available in the market. The mouse has become very popular with microcomputers in recent years, and it is an indispensable pointing device. It is inexpensive, small, and convenient to use. However, fine and very precise sketching is very difficult to obtain with the mouse.
(3) Tablet or Digitizer [fig. 2 (ii)]: This is also a very common and popular input device for CAD. It has a flat surface on which a stylus is placed and moved. The movement of stylus on the surface in terms of X and Y coordinates of surface is detected by sensors embedded in the tablet. The stylus incorporates many buttons for input. The parameters of a digitizer are resolution, accuracy and repeatability.
The digitizers are available in very large sizes to be used with full size engineering drawings. They have a very high resolution. The resolution is measured in terms of lines per inch (LPI). Digitizers with 2000 LPI resolution are commercially available.
The most common method of using digitizer is for tracing a drawing or a portion of the drawing. The drawing to be copied is placed on the digitizer and the stylus is used to trace the portions required. Thus, old drawings, maps, etc., can be entered into a CAD system.
2. Graphic output devices:
A hard copy i.e. copy on paper of what is displayed on a graphics terminal can be obtained by a variety of graphics printers and plotters. The computer graphic output device may be thought of as paper and a pen or a pencil.
(1) Dot Matrix Printers (DMP) and laser Printers: Dot Matrix Printer is the most commonly used printer for text printing. The characters are formed by printing dots in a specific manner. The dot matrix printer [fig. 2(vi)] can also be used for printing of drawings, but the quality of output is poor.
(2) Pen Plotters [fig. 2(v)]: Pen plotters are the simplest output devices for CAD. A pen plotter consists of a device to hold the paper. Usually two orthogonal motorized carriages hold a pen and move it under computer control. There are three inputs to the pen plotter: (i) an X coordinate, (ii) a Y coordinate and (iii) a pen variable. The pen variable can specify the pen colour by pen number, the pen to be up (non-drawing position) or down (in contact with paper in drawing position).
The two varieties of plotters are flat-bed and drum plotters. The flat-bed plotter is limited by the paper size it can handle. The drum plotter utilizes a continuous roll of paper which rolls over the top of the drum. The capacity and capabilities of a plotter are evaluated by the size of paper it can handle, resolution, speed of plotting, number of pens it can handle, etc.
(3) Ink-Jet printers/plotters: These are dot matrix printers. The drawing which is made up of lines, arcs, characters and symbols is converted into dot form. Then the rows of dots are printed across the width of the paper by impelling a tiny jet of ink on the surface of paper. The jets are switched on and off at high frequency to create multicolor plots.
Typically, the resolution is 600 to 900 dots per inch, and each dot is arranged to overlap the adjacent ones. This provides a high-quality photo-realistic picture. These plotters are quiet during operation. These plotters are used for colour plots of drawings, shaded images, contour plots and artistic work.
(4) laser printers: A laser printer rapidly produces high quality text and graphics on plain paper. The fastest colour laser printers can print over 100 pages per minute. It can write with much greater speed than an ink jet and can draw more precisely, without spilling any excess ink. The toner powder of laser printer is cheap and lasts a long time compared to expensive ink cartridges.
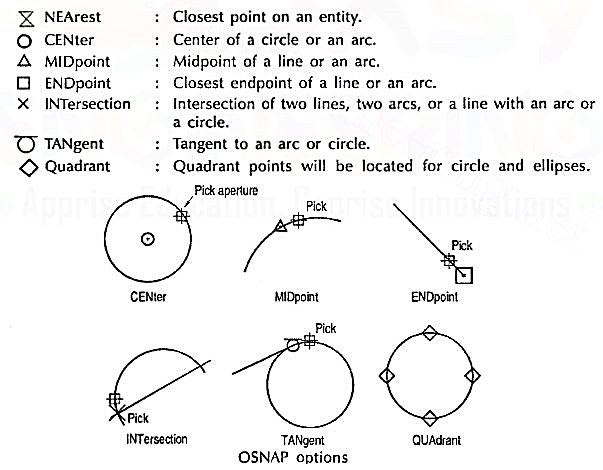
Figure 2 CAD system hardware
3. CAD software
The CAD system creates an environment to prepare drawings interactively. Most CAD systems available commercially are menu driven. Commands can either be typed directly with the help of a keyboard or can be picked-up from the screen menu or from toolbar with the help of a mouse or can be selected from the digitizer menu. Some screen menus offer pull-down menus (also referred to as pop-up menus) and dialogue boxes.
For example, a variety of hatching patterns are displayed on the screen for better visualization and selection if a hatching command is chosen. The appropriate hatching pattern can be selected with the help of input device. The effect of every command immediately displayed on the screen so that selection and corrections can be done interactively and immediately.
The major functions to be performed by a computer aided drafting system are:
(a) Basic set-up of a drawing
(b) Drawing the objects
(c) Changing the object properties
(d) Translating the objects
(e) Scaling the objects
(f) Clipping the objects to fit the image to the screen
(g) Creating symbol libraries for frequently used objects
(h) Text insertion
(i) Dimensioning
(j) Creates various layers (Transparent sheets)
(k) Allows zoom-in and zoom-out of any components drawing
(I) Creates different numbers of print/plot layouts.
AutoCad
AutoCAD (a product and registered trademark of Autodesk Inc., USA) is a low cost yet very effective computer aided design and drafting software. AutoCAD is accepted as the industry standard and it is preferred by a large community of CAD users in the world. Although AutoCAD is available for a variety of computer systems, majority of AutoCAD implementations are available on IBM or compatible personal computers with various operating systems. AutoCAD comes with a very large number of user-selectable options to support a great variety of commercially available display devices, digitizers, mouse, printers and plotters. AutoCAD supports 2D drafting and 3D modelling.
The basic drawing entities are lines, polylines [refer to art. 26-5-4 of any width, circles, arcs, ellipses and solids. There are many ways of defining a drawing entity, and the software always prompts the user for all options. Each drawing entity has an associated line-type, colour, layer [refer to art. 26-5-5(2)] and thickness. The thickness is a property associated with 3D entities.
Before any drawing is started, the AutoCAD environment must be prepared for proper units of measurement, line-type, drawing size, layer, etc. In AutoCAD the drawings are always prepared at full scale, and the drawing size can be changed at any instant of time by using LIMITS command.
Classic screen layout of AutoCad:
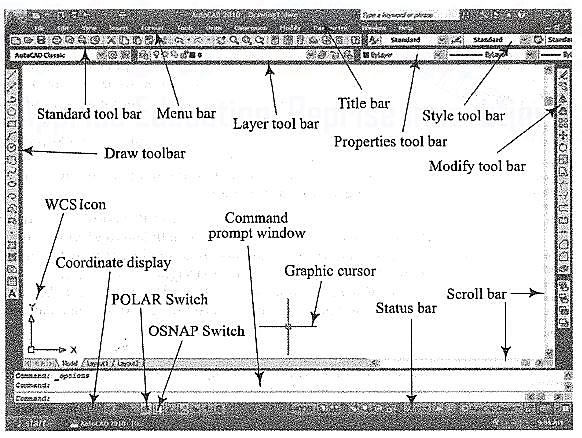
The default AutoCAD 2010 drawing screen can be divided into four areas such as drawing area, command area, menu bar area and tool bar area. The various component of Graphical User Interface (GUI) of AutoCAD 2010 is shown in fig. 26-3.
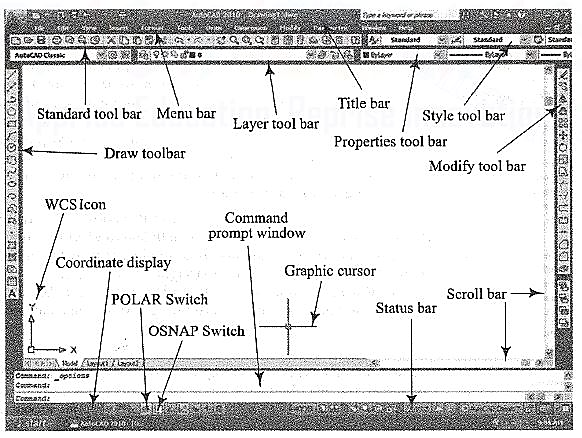
Figure 3 Classic AutoCad layout
Function Keys:
F1 Online Help
F2 Toggles between Drawing screen to text screen
F3 Toggles between OSNAP - On and Off
F4 Toggles between Tablet - On and Off
F5 Switches among lso planes Top, Right and Left
F6 Toggles between Coordinates - On and Off
F7 Toggles between Grid - On and Off
F8 Toggles between Ortho Mode - On and Off
F9 Toggles between Snap Mode - On and Off
F10 Toggles between Polar Tracking - On and Off
F11 Toggles between Objects Snap Tracking - On and Off
Drawing entities (Draw commands)
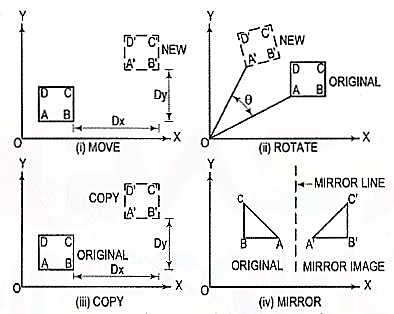
Figure 4
(1) Line: A line is specified by giving its two endpoints. The LINE command can be used to draw a single line or a series of lines with the end-point of one being the start point of the next. When a series of such lines is created, each line is treated as a separate entity. To create a closed polygon, the user has to type in C (close option) for the To point: prompt. This causes the last and the first points to be joined by a line and thus creating a closed boundary.
(2) Pline: Polylines are interesting drawing entities. Polylines can include both lines and arcs connected at end-points. Thus, a polyline is a single entity with multiple segments. The polylines can be straight or curved, can be wide (like a TRACE) or tapered. Fillets and chamfers can be added where needed on a polyline. Curve fitting and hatching can easily be performed on a polyline.
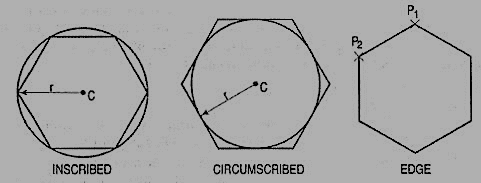
(3) Polygon (fig. 5): A polygon also a polyline with equal length of sides. The regular polygon can either be inscribed in a circle or circumscribed about the circle. The polygon may also be constructed by specifying the length of one side and the number of sides of polygon (called edges). In this method a polygon is constructed in anti-clockwise direction from the two-edge end-points that have been specified.
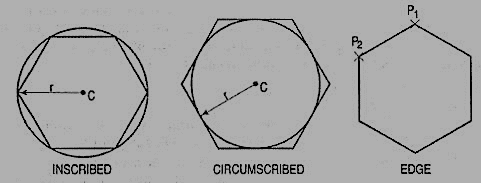
Figure 5 Polygon
(5) Arc (fig. 6): This command is used to draw an arc accurately. Usually there are three parameters required for drawing an arc.
Different ways of drawing circular arcs are:
(i) 3-point arc: The arc is drawn by specifying three points on the chord of arc. The first and third points define the start and end-points of an arc respectively.
(ii) Start, Center: This option needs start points and center point of an arc. The third parameter may either be an end-point, included angle, or length of chord.
(iii) Start, End: This option asks the user to enter the start and end-points of an arc. The arc is completed by either specifying radius or included angle or center point.
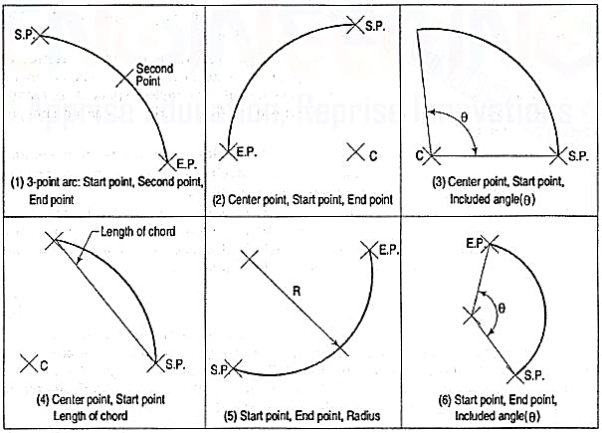
Figure 6 Arcs
4. Drafting Aids:
(1) limits: In AutoCAD, drawings are drawn in full scale therefore limits are needed to size up a drawing area. The limits are set by specifying X and Y co-ordinates of Lower Left Corner (L.L.C.) and Upper Right Corner (U.R.C.) of drawing area. By default, L.L.C. Is set to (0, 0) and U.R.C. Is set to (12, 9) for imperial file and (420, 210) for metric file.
Note: By changing limits, the drawing display area does not change. It is required to use all option of the zoom command to display the limits inside the drawing area.
(2) layer: A layer can be thought of as a transparent sheet on which drawings can be prepared. Drawings can be logically divided into different layers, and layers can be selectively displayed either individually or in any combination. Each layer is identified by a name. If the drawing becomes too dense or complicated, some layers can be turned off so that they do not interfere with the work. The drawing can be edited on any one layer at a time, called current layer. The colour, line type and line weight are the properties associated with a layer. This controls an entity's colour, line type and line weight drawn on that layer.
(3) Dimensioning: The manufacturing drawing must be dimensioned for size and tolerances so that the right information can be conveyed. The appearance and size of dimension arrows, size and style of dimension text with or without tolerances, and the layer on which dimensions are placed can be controlled by setting dimension variables.
(4) Object snap (fig.7): A very useful drawing aid, the OSNAP identifies the points on drawing entities that are visible on the screen. For example, the start point of an arc can be the endpoint of an existing line. This option allows the user to pick-up the points very accurately with respect to drawing displayed. Some of the OSNAP modes are:
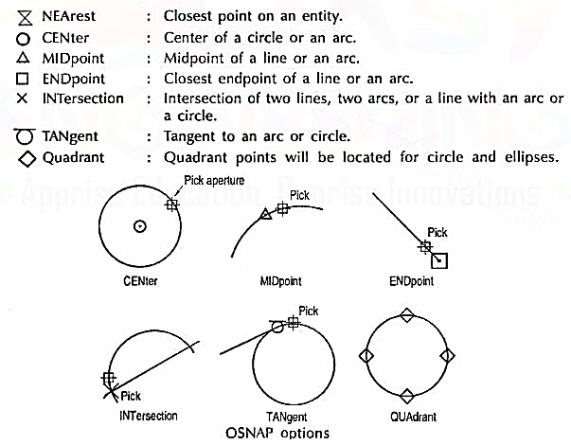
Figure 7
(5) Zoom: This is the most common method of magnifying a portion of current drawing on the screen. The portion of drawing to be zoomed is usually selected by a window. A window is identified by picking up the diagonal corners of a rectangle around the area of interest.
5. Editing of a drawing:

Figure 8
The fundamental commands to edit a drawing are:
(1) Move [fig. 9 (i)]: Moves selected objects to another location about a base point.
(2) Rotate [fig. 9 (ii)]: Rotates selected objects through a specified angle about a base point.
(3) Copy [fig. 9 (iii)]: Creates one or more copies of selected objects at another location. The function of COPY command is like the MOVE command except that it preserves a copy of the objects selected at the original location.
(4) Mirror [fig. 9 (iv)]: Creates a mirror image of the selected objects about a specified line.
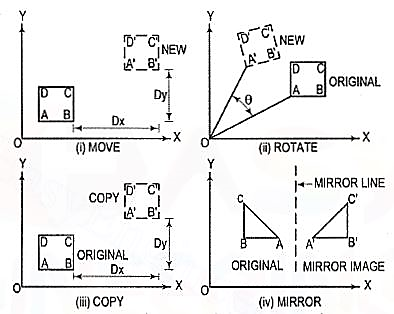
Figure 9
(5) Array: This command creates multiple copies of selected objects in rectangular or polar form. This is a form of COPY command.
(6) Erase: This command deletes the selected entities. A record of entities erased is always maintained. The most recent entity can be unerased by OOPS command.
(7) Oops: This command retrieves all objects erased by the last Erase and after executing Block or Wblock command.
(8) Break: This command erases a portion of line, arc, circle or a 20 polyline between two selected points.
(9) fillet (Refermodule26-5, 26-13): This command is used to create around corner between two lines. The lines are shortened or extended to fit a tangent arc of specified radius. FILLET works on any combination of two lines, arcs, circles, non-parallel lines, or a single polyline.
(10) Chamfer (Refer module 26-8): This command works on two lines or a single polyline to create a bevelled edge.
(11) Extend: This command extends the lines, polylines and arcs to a boundary edge which can be a line, polyline, arc or circle. A closed polygon cannot be extended. When you invoke this command, you will be prompted to select the boundary edges. These edges can be lines, polylines, circles, arcs, ellipse, rays, splines etc. After the boundary edges are selected, you must select each object to be extended. An object can be both a boundary edge and an object to be extended.
(12) Offset: This command creates a parallel single copy of line, arc, circle, rectangle, polygon, or 20 polylines at a given offset distance. Each offset creates a new entity with the same linetype, color and layer settings.
(13) Stretch: The STRETCH command can either lengthen entities or shorten them, and thus alter their shapes. The centre points of arcs or polyline arcs are adjusted accordingly.
(14) Trim: This command trims the objects that extend beyond a required point of intersection. When you invoke this command, you will be prompted to select the cutting edges. These edges can be lines, polylines, circles, arcs, ellipse, rays, splines, text, blocks or even viewports. After the cutting edges are selected, you must select each object to be trimmed. An object can be both a cutting edge and an object to be trimmed.
(15) Scale: The SCALE command allows to shrink or enlarge the already existing drawing objects about a base point by specifying a scale factor.
(16) Pedit: A polyline is a single entity which is made up of a continuous series of line and arc segments. The PEDIT command is exclusively used for editing of polyline properties. The selected line, arc and polyline can be added to an existing polyline by a JOIN option. A smooth curve passing through all vertices of a polyline can be created by using FIT option. Similarly, a spline can also be constructed by using SPLINE option.
(17) Explode: This command breaks a polyline into its individual segments. These segments can then individually be edited, and rejoined again to form an edited polyline.
The advanced features of AutoCAD are:
(1) Built-in programming language AutoLISP provides programming environment so that AutoCAD commands can be called along with programs written for computations. This is very useful for parametric design and drawing.
(2) Drawing Exchange Files (DXF) and script files can be used to interface AutoCAD with programs written in any other higher-level language such as C. DXF and IGES file formats allow the exchange of drawing files among various drafting software’s.
(3) AutoCAD provides techniques to define and extract attributes of entities. This feature is used in extracting information from a drawing for processing by other programs or to transfer it to a database.
6. Symbol library (Block, Wblock and Insert)
A complete drawing or a part of a drawing can be given a specific name and then stored as a block. A collection of such blocks form a library which is very useful for drawing purpose. The blocks, also referred to as symbols, can be scaled, rotated or mirrored if necessary and inserted into the drawing at the appropriate location e.g. Bolt heads to be used at different locations in a drawing. Many suppliers of CAD add-on products offer symbol libraries of standard mechanical components, electronic components, architectural symbols, piping symbols, etc. The block and wblock command groups many selected entities together and treats them as a single object i.e. single block. Block commands saves the group of selected entities with block name and is inserted in the file in which it is created, but wblock command saves the group of selected entities as a drawing file and can be inserted in any drawing file. The blocks and wblocks can be scaled, rotated, stretched or mirrored. The explode command separates the entities of block and wblock.
INSERT: INSERT command is used to insert blocks and wblocks in current drawing. Blocks will be inserted only in the drawing file in which they created and wblocks will be inserted in any drawing files.
Conic sections- Ellipse (excluding focus directrix method), Parabola, Hyperbola & involute
The section obtained by intersection of a right circular cone by a plane in different positions relative to the axis of the cone are called conics.
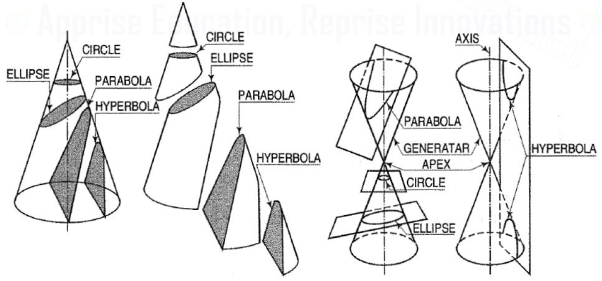
Conic sections are always "smooth". More precisely, they never contain any inflection points. This is important for many applications, such as aerodynamics, civil engineering, mechanical engineering, etc.
The conic may be defined as the locus of a point in a plane, wherein the ratio of its distance from a fixed point and a fixed straight line is always constant. The fixed point is called the focus and the fixed line, the directrix.
The ratio  is called eccentricity and is denoted by ‘e’. It is always less the 1 for ellipse, equal to 1 for parabola and greater than 1 for hyperbola.
Ellipse:
Use of elliptical curves is made in arches, bridges, dams, monuments, man holes, etc. Mathematically an ellipse can be described by equation  .
.
Here ‘a’ and ‘b’ are half the length of major and minor axes of ellipse and x and y are co-ordinates.
Parabola:
Use of parabolic curves is made in arches, bridges, sound reflectors, light reflectors, etc. Mathematically it can be described by an equation 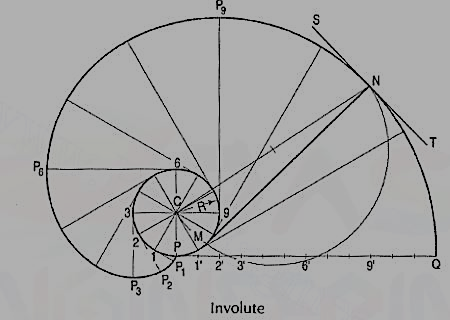 or
or 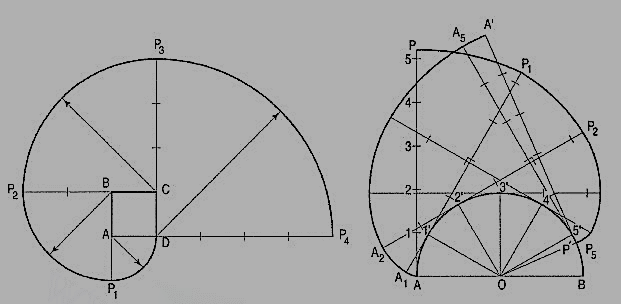 .
.
Involute:
The involute is a curve traced out by an end of a piece of thread unwound froma circle or a polygon, the thread being kept tight. It may also be defined as acurve traced out by a point in astraight line which rolls without slipping along acircle or a polygon.
It is used as teeth profile of gear wheel.
Mathematically it can be described as by  ,
,  , where “r” is the radius of the circle.
Spiral:
If a line rotates in a plane about one of its ends and if at the same time, a point moves along the line continuously in one direction, the curve traced out by the moving point is called a spiral. The point about which the line rotates is called a pole.
The line joining any point on the curve with the pole is called the radius vector andthe angle between this line and the line in its initial position is called the vectorial angle.
Archemedian spiral:
It is a curve traced out by a point moving in such a way that its movement towards and away from the pole is uniform with the increase of the vectorial angle from the starting line.
The use of this curve is made in teeth profiles of helical gears, profile of cams, etc.
Cycloid curves- only Cycloid.
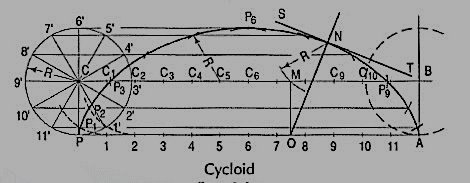
Cycloid is a curve generated by a point on the circumference of a circle which rolls along a straight line. It can be described by an equation,
y = a (1 - cosθ) or x = a (θ - sinθ)
To construct a cycloid, given the diameter of the generating circle.
(i) With centre C and given radius R, draw a circle. Let P be the generatingpoint.
(ii) Draw a line PA tangential to and equal to the circumference of the circle.
(iii) Divide the circle and the line PA into the same number of equal parts, say 12,and mark the division-points as shown.
(iv) Through C, draw a line CB parallel and equal to PA.
(v) Draw perpendiculars at points 1, 2 etc. cutting CB at points C1, C2 etc.
Assume that the circle starts rolling to the right. When point 1' coincides with 1, centre C will move to C1. In this position of the circle, the generating point P will have moved to position P1 on the circle, at a distance equal to P'1 from point 1. It is evident that P1 lies on the horizontal line through 1' and at a distance R from C1. Similarly, P2 will lie on the horizontal line through 2' and at the distance R from C2.
Construction:
(vi) Through the points 1 ', 2' etc. draw lines parallel to PA.
(vii) With centres C1, C2 etc. and radius equal to R, radius of generating circle, draw arcs cutting the lines through 1 ', 2' etc. at points P1, P2 etc. respectively. Draw a smooth curve through points P, P1, P2 …. A. This curve is the required cycloid.
Normal and tangent to a cycloid curve: The rule for drawing a normal to all cycloidal curves:
The normal at any point on a cycloidal curve will pass through the corresponding point of contact between the generating circle and the directing line or circle. The tangent at any point is perpendicular to the normal at that point.
Involute:
The involute is a curve traced out by an end of a piece of thread unwound froma circle or a polygon, the thread being kept tight. It may also be defined as acurve traced out by a point in a straight line which rolls without slipping along acircle or a polygon. Involute of a circle is used as teeth profile of gear wheel.Mathematically it can be described by x = rcosθ + rθsinθ, y = rsinθ - rθcosθ,where "r" is the radius of a circle.
Problem: To draw an involute of a given circle.
With centre C, draw the given circle. Let P be the starting point, i.e. the end ofthe thread.
Suppose the thread to be partly unwound, say upto a point 1. P will move to aposition P1 such that 1P1 is tangent to the circle and is equal to the arc 1 P. P1 will bea point on the involute.
Construction:
(i) Draw a line PQ, tangent to the circle and equal to the circumference of the circle.
(ii) Divide PQ and the circle into 12 equal parts.
(iii) Draw tangents at points 1, 2, 3 etc. and mark on them points P1, P2, P3 etc.such that 1P1 = P1', 2P2 = P2', 3P3 = P3' etc.
Draw the involute through the points P, P1, P2 .... Etc.
Normal and tangent to an involute:
The normal to an involute of a circle is tangent to that circle.
Problem:
To draw a normal and a tangent to the involute of a circleat a point N on it.
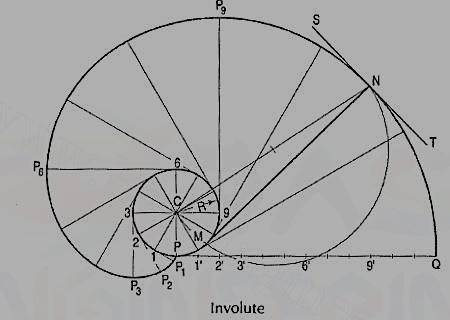
Figure 20
(i) Draw a line joining C with N.
(ii) With CN as diameter describe a semi-circle cutting the circle at M.
(iii) Draw a line through N and M. This line is the normal. Draw a line ST, perpendicular to NM and passing through N. ST is the tangent to the involute.
Problem: Trace the paths of the ends of a straight-line AP, 100 mm long, when it rolls, without slipping, on a semi-circle having its diameter AB, 75 mm long. (Assume the line AP to be tangent to the semi-circle in the starting position.)
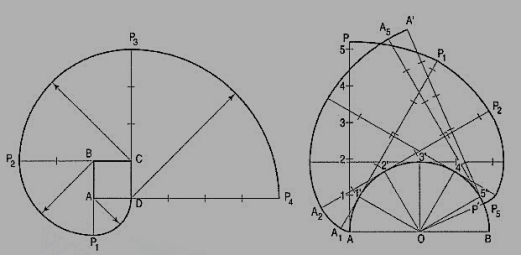
Figure 21
(i) Draw the semi-circle and divide it into six equal parts.
(ii) Draw the line AP and mark points 1, 2 etc. such that A1 = arc A1 ', A2 = arc A2' etc. The last division SP will be of a shorter length. On the semi-circle, mark a point P' such that S'P' = SP.
(iii) At points 1 ', 2' etc. drawtangents and on them,mark points P1, P2 etc. suchthat 1' P1 = 1P, 2' P2 =2P .... And 5' P5 = 5' P6 =SP. Similarly, mark pointsA1, A2 etc. such that A11'= A1, A22' = A2 .... And A'p'= AP. Draw the requiredcurves through points P,P1 .... And P', and throughpoints A, A1 .... And A'.
If AP is an inelastic string with the end A attached to the semicircle, the end P will trace out the same curve PP' when the string is wound round the semi-circle.
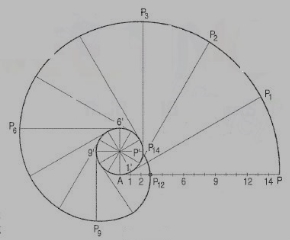
Figure 22
Involute:
The involute is a curve traced out by an end of a piece of thread unwound from a circle or a polygon, the thread being kept tight. It may also be defined as a curve traced out by a point in a straight line which rolls without slipping along a circle or a polygon.
It is used as teeth profile of gear wheel.
Mathematically it can be described as by  ,
,  , where “r” is the radius of the circle.
An involute is a curve traced by a point on a perfectly flexible string, while unwinding from around a circle or polygon the string being kept taut (tight). It is also a curve traced by a point on a straight line while the line is rolling around a circle or polygon without slipping.
To draw an involute of a given square.
1. Draw the given square ABCD of side a.
2. Taking A as the starting point, with centre B and radius BA=a, draw an arc to intersect the
Line CB produced at Pl.
3. With Centre C and radius CP1 =2 a, draw on arc to intersect the line DC produced at P 2.
4. Similarly, locate the points P3 and P4.
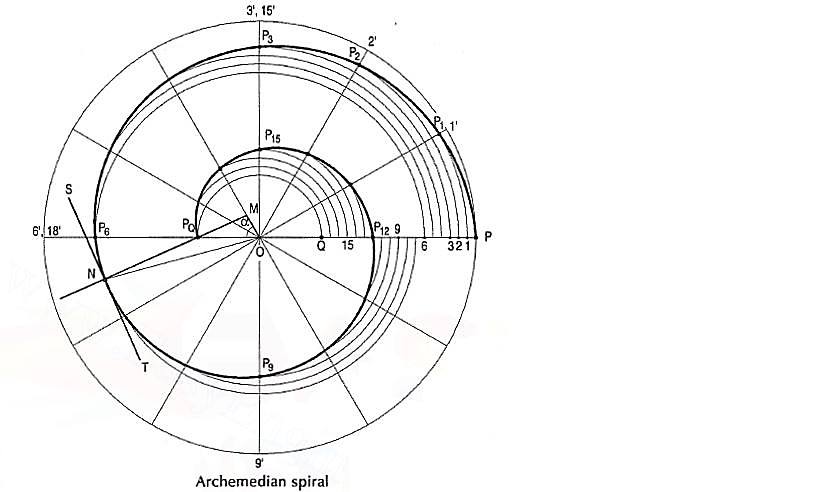
Figure 23
The curve through A, P1, P2, P3 and P4 is the required involute.
A P4 is equal to the perimeter of the square.
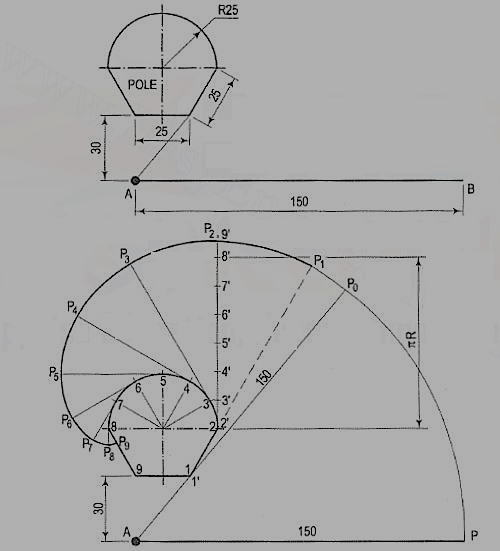
AP is a rope 1.50-metre-long, tied to peg at A as shown in fig. 24. Keeping it always tight, the rope is wound round the pole. Draw the curve traced out by the end P. Use scale 1 :20.
Draw given figure to the scale.
(ii) From A, draw a line passing through 1. A as centre and AP as radius, draw the arc intersecting extended line A1' at P0. Extend the side 1-2, 1 as centre and 1 'Po as radius, draw the arc to intersect extended line 1-2 at P1.
(iii) Divide the circumference of the semicircle into six equal parts and label it as 2, 3, 4, 5, 6, 7 and 8.
(iv) Draw a tangent to semicircle from 2 such that 2'-P1 = 2'-P2 . Mark 8' on this tangent such that 2'-8' = nR. Divide 2'-8' into six equal parts.
(v) Similarly draw tangents at 3, 4, 5, 6, 7 and 8 in anti-clockwise direction such that 3-P3 = 3'-9', 4-P4 = 4'-9', 5-P5 = 5'-9', 6-P6 = 6'-9', 7-P7 = 7'-9', 8-P8 = 8'-9' and 8-P9 = 8'-9' respectively.
(vi) Join P1, P2, ....• , P9 with smooth curve.
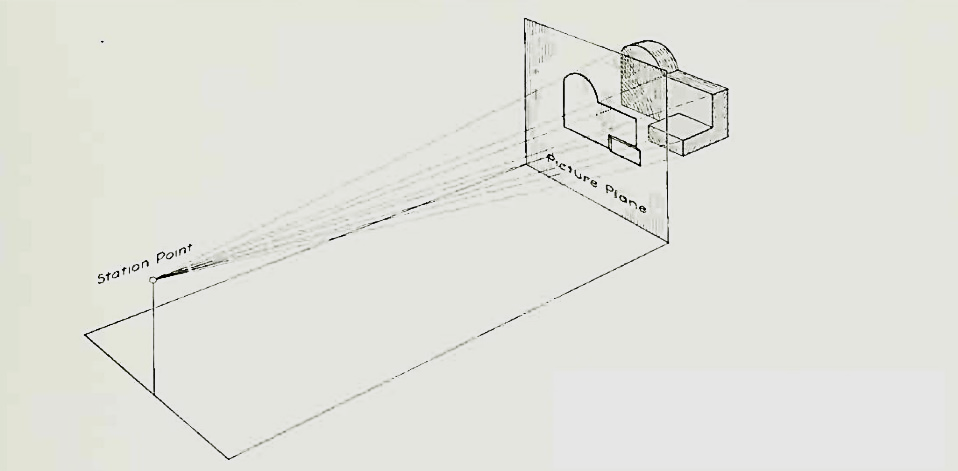
Figure 24
Spiral:
If a line rotates in a plane about one of its ends and if at the same time, a point moves along the line continuously in one direction, the curve traced out by the moving point is called a spiral. The point about which the line rotates is called a pole.
The line joining any point on the curve with the pole is called the radius vector and the angle between this line and the line in its initial position is called the vectorial angle.
Archemedian spiral:
It is a curve traced out by a point moving in such a way that its movement towards and away from the pole is uniform with the increase of the vectorial angle from the starting line.
The use of this curve is made in teeth profiles of helical gears, profile of cams, etc.
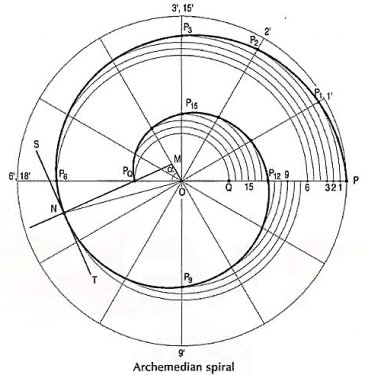
To construct an Archemedian spiral of 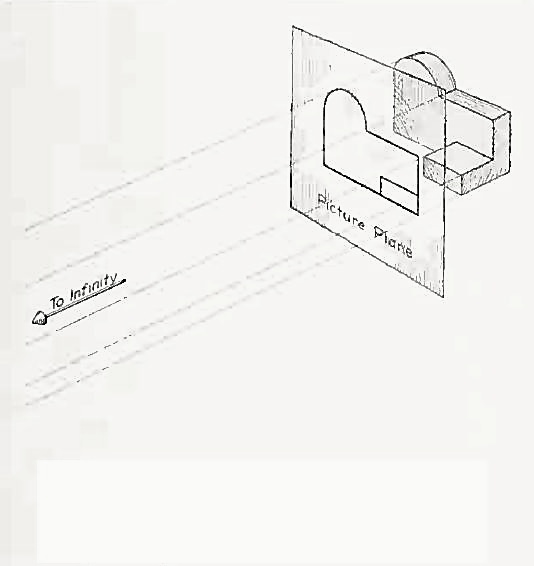 convolutions given the greatest and the shortest radii.
Let O be the pole, OP the greatest radius and OQ the shortest radius.
(i) With centre O and radius equal to OP, draw a circle. OP revolves around0 for  revolutions. During this period, P moves towards 0, the distance equal to (OP - OQ) i.e. QP.
(ii) Divide the angular movements of OP, viz 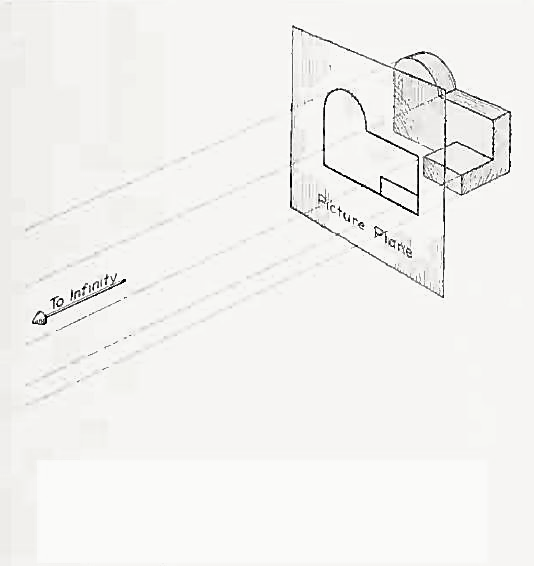 revolutions i.e. 540°and the line QP into the same number of equal parts, say 18 (one revolution divided into 12 equal parts).
When the line OP moves through one division, i.e. 30°, the point P will move towards O by a distance equal to one division of QP to a point P1.
(iii) To obtain points systematically draw arcs with centre O and radii O1’, O2’, O3’ etc. intersecting lines O1’, O2’, O3’ etc. at points P1, P2, P3 etc. respectively. In one revolution, P will reach the 12th division along QP and in the next half revolution it will be at the point PQ on the line 18'-0.
(iv) Draw a curve through points P, P1, P2, PQ. This curve is the required Archemedian spiral.
The constant of the curve is equal to the difference between the lengths of any two radii divided by the circular measure of the angle between them.
OP and OP3 (fig. 6-63) are two radii making go0 angle between them. In circular measure in radian,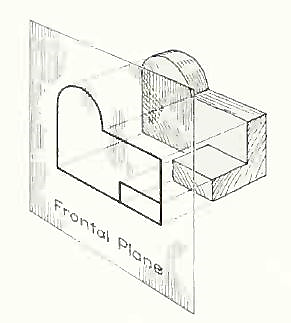 . Therefore, the constant of the curve
Principle of projection
If straight lines are drawn from various points on the contour of an object to meet a plane, the object is said to be projected on that plane. The figure formed by joining, in correct sequence, the points at which these lines meet the plane, is called the projection of the object. The lines from the object to the plane are called projectors.
Methods of Projection:
Following four methods of projection are commonly used,
1) Orthographic projection.
2) Isometric projection.
3) Oblique projection.
4) Perspective projection.
In the above methods 2, 3 and 4 represent the object by a pictorial view as eyes see it. In these methods of projection, a three-dimensional object is represented on a projection plane by one view only, while in the orthographic projection an object is represented by two or three views on the mutual perpendicular projection planes. Each projection view represents two dimensions of an object. For the complete description of the three-dimensional object at least two or three views are required.
Orthographic projection
Theory of orthographic projection:
Let us suppose that a transparent plane has been set up between an object and the station point of an observer's eye (Fig. 1). The intersection of this plane with the rays formed by lines of sight from the eye to all points of the object would give a picture that is practically the same as the image formed in the eye of the observer. This is perspective projection.
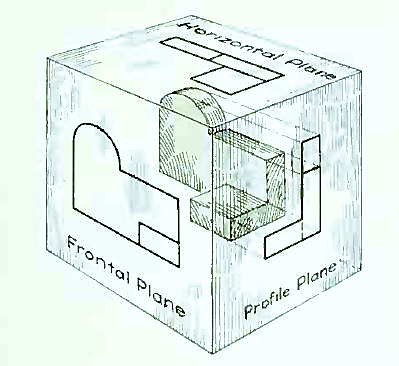
Figure 1 Perspective projection. The rays of the projection converge at the station point from which the object is observed.
If the observer would then walk backward from the station point until he reached a theoretically infinite distance, the rays formed by lines of sight from his eye to the object would grow longer and finally become infinite in length, parallel to each other, and perpendicular to the picture plane. The image so formed on the picture plane is what is known as "orthographic projection." See Fig.
2.
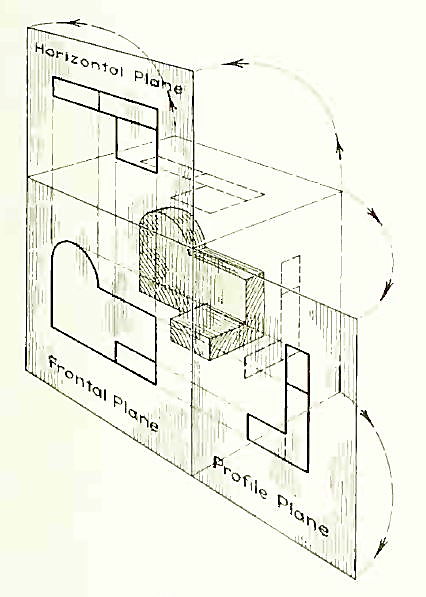
Figure 2 Orthographic projection.
Basically, orthographic projections could be defined as any single projection made by dropping perpendiculars to a plane. However, it has been accepted through long usage to mean the combination of two or more such views, hence the following definition has been put forward: Orthographic projection is the method of representing the exact shape of an object by dropping perpendiculars from two or more sides of the object to planes, generally at right angles to each other; collectively, the views on these planes describe the object completely. (The term "orthogonal" is sometimes used for this system of drawing.)
Orthographic views:
The rays from the picture plane to infinity may be discarded and the picture, or "view," thought of as being found by extending perpendiculars to the plane from all points of the object, as in Fig. 3. This picture, or projection on a frontal plane, shows the shape of the object when viewed from the front, but it does not tell the shape or distance from front to rear. Accordingly, more than one projection are required to describe the object.
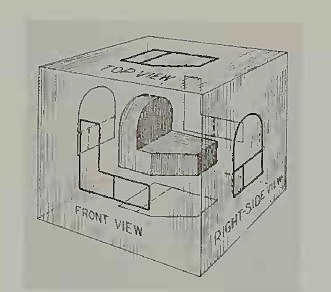
Figure 3 The frontal plane of projection. This produces the front view of the object.
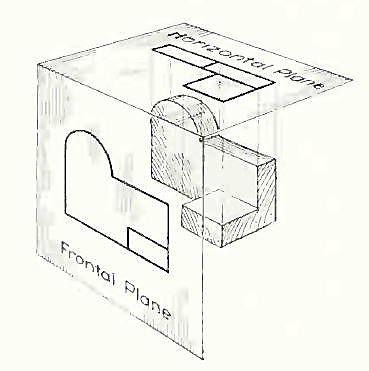
In addition to the frontal plane, imagine another transparent plane placed horizontally above the object, as in Fig. 4. The projection on this plane, found by extending perpendiculars to it from the object, will give the appearance of the object as if viewed from directly above and will show the distance from front to rear.
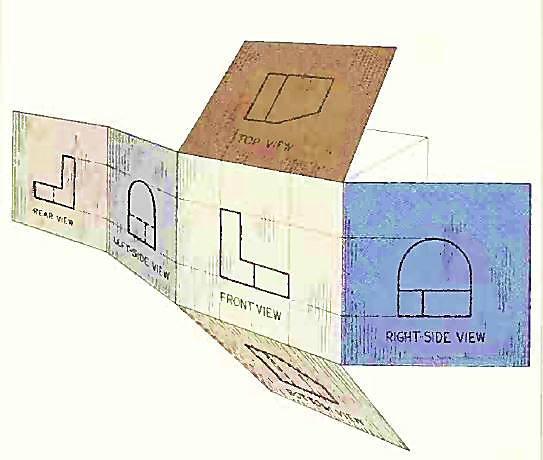
Figure 4 The frontal and horizontal planes of projections. Projection on the horizontal plane produces the top view of the object.
If this horizontal plane is now rotated into coincidence with the frontal plane, as in Fig. 5, the two views of the object will be in the same plane, as if on a sheet of paper.
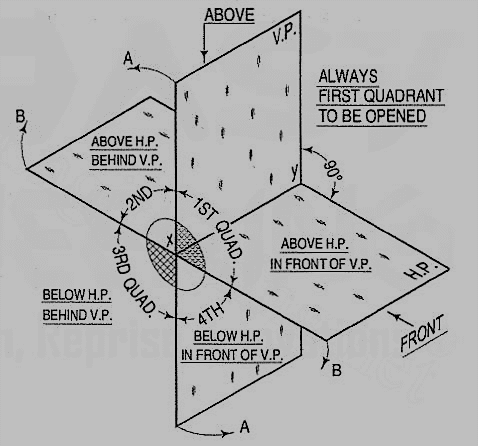
Figure 5 The horizontal plane rotated into the same plane as the frontal plane.
Now imagine a third plane, perpendicular to the first two (Fig. 6). This plane is called a "profile plane," and a third view can be projected on it. This view shows the shape of the object when viewed from the side and the distance from bottom to top and front to rear.
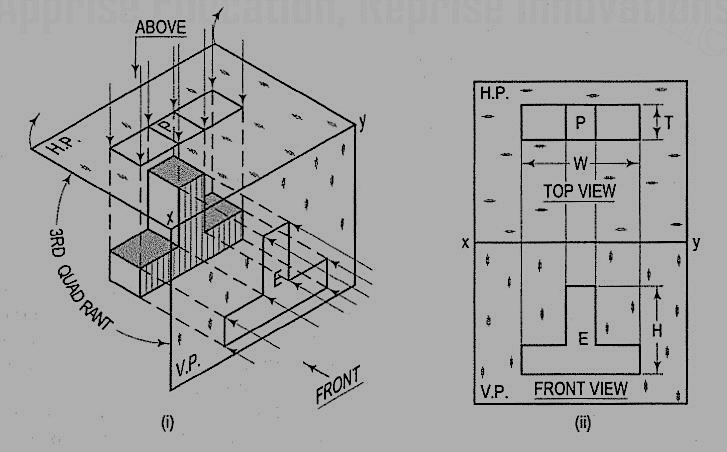
Figure 6 The three planes of projection: frontal, horizontal and profile. Each is perpendicular to other two.
The horizontal and profile planes are shown rotated into the same plane as the frontal plane (again thought of as the plane of the drawing paper) in Fig. 7. Thus, related in the same plane, they give correctly the three-dimensional shape of the object.
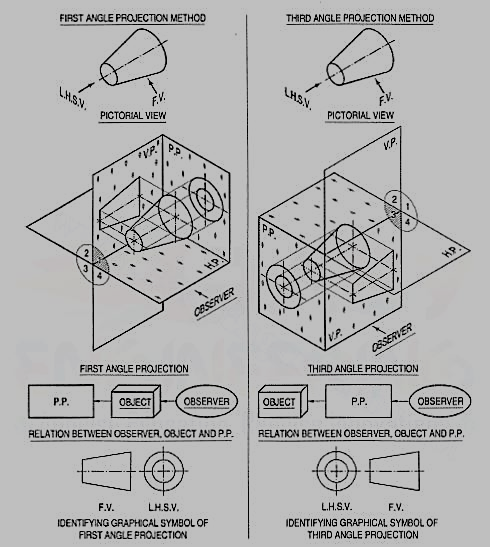
Figure 7 The horizontal and profile planes rotated into the same plane as the frontal plane. This makes it possible to draw three views of the object.
In orthographic projection the picture planes are called "planes of projection"; and the perpendiculars, "projecting lines" or "projectors."
Concepts of four quadrants
The object can be surrounded by a set of six planes, each at right angles to the four adjacent to it, as in Fig. 8. On these planes, views can be obtained of the object as it is seen from the top, front, right side, left side, bottom, and rear.
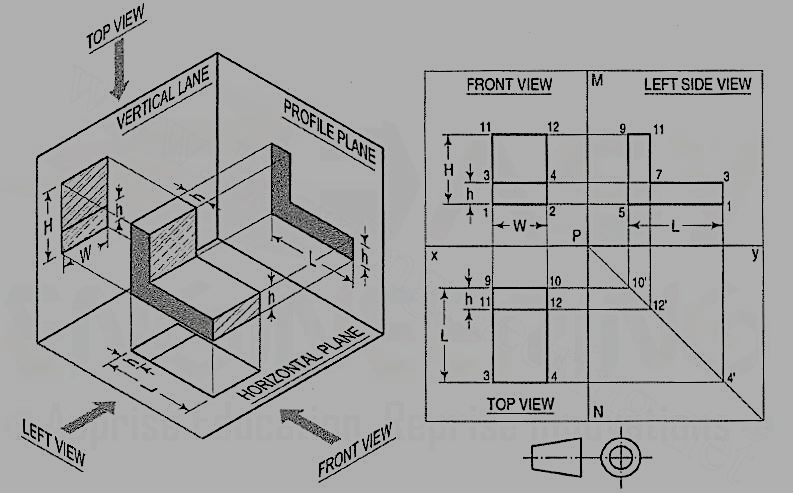
Figure 8 "The transparent box." This encloses the object with another frontal plane below, and another profile plane to the left of the object.
Think now of the six sides, or planes, of the box as being opened, as in Fig. 9, into one plane, the plane of the paper. The front is already in the plane of the paper, and the other sides are, as it were, hinged and rotated into position as shown.
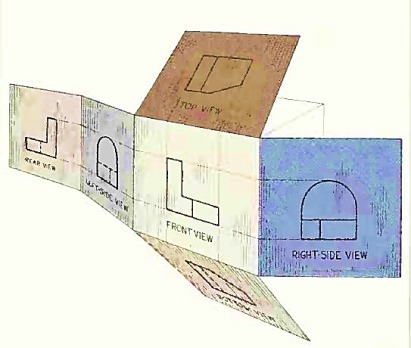
Figure 9
Four quadrants:
When the planes of projection are extended beyond the line of intersection, they form four quadrants or dihedral angles which may be numbered as in fig. The object may be situated in any one of the quadrants, its position relative to the planes being described as "above or below the H.P." and "in front of or behind the V.P."
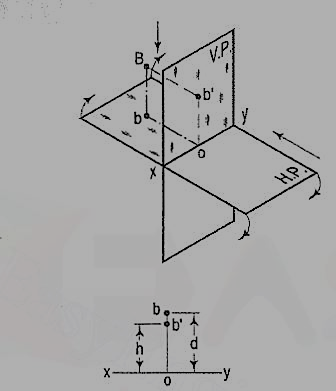
Figure 10
Methods of orthographic projections
(iv) Draw vertical projectors from 1 and 2 and extend them beyond the line xy. Draw a line 9-10 below and parallel to the reference line xy. Draw the lines 9-3 and 10-4 equal to the length L of the object. Join line 3-4. The rectangle 9-10-3-4 is the top view of the object.
(v) Draw a line 11-12 parallel to and below 9-10 of thickness h. The rectangle 9-11-12-10 is the view of the vertical stem of the object.
Drawing the side orthogonal view:
(vi) Draw a reference vertical line MN at right angles to xy cutting it at P. From P draw a construction line at 45° in the fourth quadrant.
(vii) Project lines from the points 10, 12 and 4 of the top view to meet this inclined line at 1 O', 12' and 4'.
(viii) Project lines from points 2, 4 and 12 from the front view parallel to line xy. From points 1 O', 12' and 4' project lines vertically upwards to meet these horizontal projections.
(ix) Join points 5-1-3-7-11-9. This will be the side view of the object.
(x) Finally draw the symbol of first angle projection at the right bottom corner of the drawing.
Difference between first and third angle projection
First angle projections
We have assumed the object to be situated in front of the V.P. And above the H.P. i.e. in the first quadrant and then projected it on these planes. This method of projection is known as first-angle projection method. The object lies between the observer and the plane of projection. In this method, when the views are drawn in their relative positions, the top view comes below the front view. In other words, the view seen from above is placed on the other side of (i.e. below) the front view. Each projection shows the view of that surface (of the object) which is remote from the plane on which it is projected, and which is nearest to the observer.
Third angle projection:
In this method of projection, the object is assumed to be situated in the third quadrant [fig. 11(a)]. The planes of projection are assumed to be transparent. They lie between the object and the observer. When the observer views the object from the front, the rays of sight intersect the V.P. The figure formed by joining the points of intersection in correct sequence is the front view of the object. The top view is obtained in a similar manner by looking from above. When the two planes are brought in line with each other, the views will be shown in fig.11 (b). The top view in this case comes above the front view.
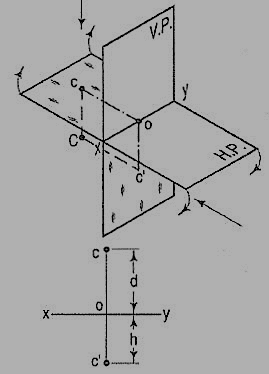
Figure 11
Symbols for methods of projection:
For every drawing it is essential to indicate the method of projection adopted. This is done by means of a symbolic figure drawn within the title block on the drawing sheet. These symbolic figures are the projections of a frustum of cone of convenient dimensions according to the size of drawing.
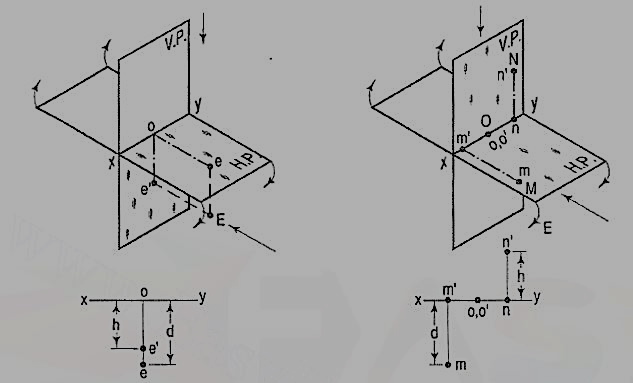
Figure 12
Problems:
1) A L-shaped solid object having dimensions of length (L), width (W) and height (H). If this object is lying in the first quadrant. Draw its front view, top view and side view.
Steps:
(i) Mark the visible corners of the given block as shown front view: Assume that you are viewing the object in the direction of the arrow towards the imaginary V.P. What you will see is a rectangle of height (H) and width (W) on V.P. This will be the front view. To draw this view:
(ii) Draw a reference line xy, which represents the intersecting line of the planes V.P. And H.P. Draw a rectangle as shown W and H, above xy make sure that the width is parallel to the Iinexy. The rectangle is the front orthogonal view of the object.
(iii) Draw a line parallel to and thickness of h to the line 1-2. The rectangle 1-2-4-3 is the front view of the horizontal L-shaped stem of the object.
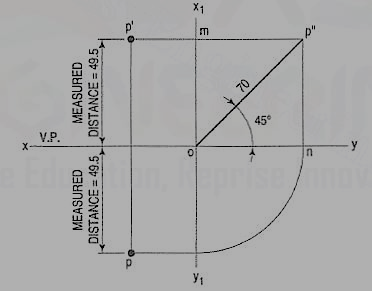
Figure 13
Conventions used to represent methods of orthographic projection
Projections of points in all possible positions w. r. To reference planes
A point may be situated, in space, in any one of the four quadrants formed by the two principal planes of projection or may lie in any one or both. Its projections are obtained by extending projectors perpendicular to the planes.
One of the planes is then rotated so that the first and third quadrants are opened out. The projections are shown on a flat surface in their respective positions either above or below or in xy.
If a point is situated in the first quadrant,
The pictorial view [fig. 14 (i)] shows a point A situated above the H.P. And in front of the V.P., i.e. in the first quadrant. a' is its front view and the top view. After rotation of the plane, these projections will be shown in fig. 14 (ii).
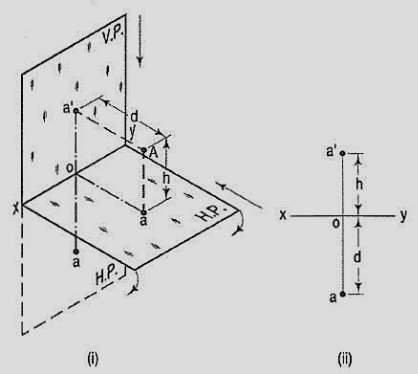
Figure 14
The front view a' is above xy and the top view a below it. The line joining a' and a (which also is called a projector), intersects xy at right angles at a point o. It is quite evident from the pictorial view that a'o = Aa, i.e. the distance of the front view from xy = the distance of A from the H.P. Viz. h. Similarly, ao = Aa',i.e. the distance of the top view from xy = the distance of A from the V.P. Viz. d.
If a point is situated in second quadrant,
A point B (fig. 15) is above the H.P. And behind the V.P., i.e. in the second quadrant. b' is the front view and b the top view. When the planes are rotated, both the views are seen above xy. Note that b'o = Bb and bo = Bb'.
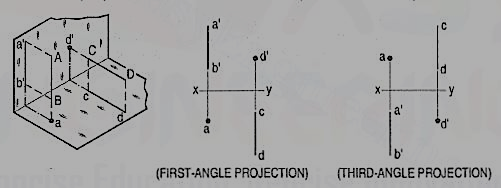
Figure 15
If a point is situated in third quadrant,
A point C (fig. 16) is below the H.P. And behind the Y.P., i.e. in the third quadrant. Its front view c' is below xy and the top view c above xy. Also, c'o = Cc and co = Cc'.
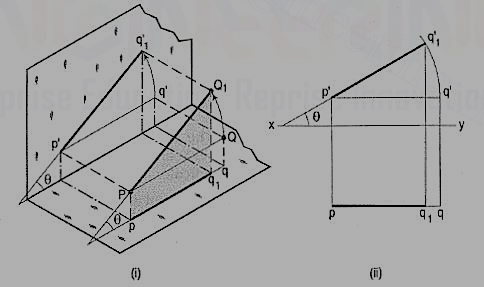
Figure 16
If a point is situated in 4th quadrant,
A point f (fig. 17) is below the H.P. And in front of the V.P., i.e. in the fourth quadrant. Both its projections are below xy, and e'o = Ee and eo = Ee'.
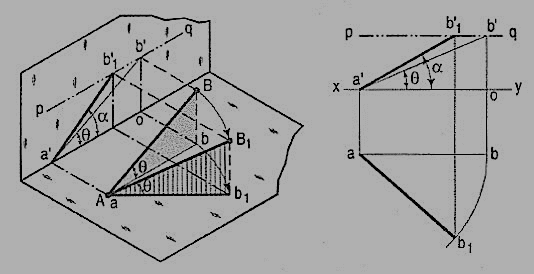
Figure 17
General conclusions:
1. The fine joining the top view and the front view of a point is always perpendicular to xy. It is called a projector.
2. When a point is above the H.P., its front view is above xy; when it is below the H.P., the front view is below xy. The distance of a point from the H.P. Is shown by the length of the projector from its front view to xy.
3. When a point is in front of the V.P., its top view is below xy; when it is behind the V.P., the top view is above xy. The distance of a point from the V.P. Is shown by the length of the projector from its top view to xy.
4. When a point is in a reference plane, its projection on the other reference plane is in xy.
Examples:
1. A point P is in the first quadrant. Its shortest distance from the intersection point of H.P., V.P. And Auxiliary vertical plane, perpendicular to the H.P. And V.P. Is 70 mm and it is equidistant from principal planes (H.P. And V.P.). Draw the projections of the point and determine its distance from the H.P. And V.P.
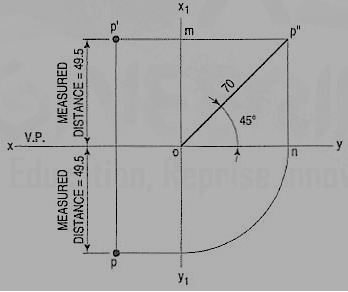
Figure 18
Note: ‘O’ represents intersection of H.P., V.P. And A.V.P.
Drawing steps:
1. Draw xy and x1 y1 perpendicular reference lines.
2. ‘O’ represents intersection of H.P., V.P. And A.V.P.
3. Draw from O a line inclined at 45° of 70 mm length.
4. Project from P" on xy line and x1 y1. The projections are n and m respectively as shown in figure. From O draw arc intersecting x1 y1.
5. Draw a parallel line at convenient distance from x1 y1. Extend P"m to intersect
a parallel line at p' and p as shown.
6. Measure distance from xy line, which is nearly 49.4974 mm say 49.5 mm.
Introduction to Projection of Lines
A straight line is the shortest distance between two points. Hence, the projections of a straight line may be drawn by joining the respective projections of its ends which are points.
The position of a straight line may also be described with respect to the two reference planes. It may be:
1. Parallel to one or both the planes.
2. Contained by one or both the planes.
3. Perpendicular to one of the planes.
4. Inclined to one plane and parallel to the other.
5. Inclined to both the planes.
6. Projections of lines inclined to both the planes.
7. Line contained by a plane perpendicular to both the reference planes.
8. True length of a straight line and its inclinations with the reference planes.
9. Traces of a line.
10. Methods of determining traces of a line.
11. Traces of a line, the projections of which are perpendicular to xy.
12. Positions of traces of a line.
Projections of line parallel to both reference planes
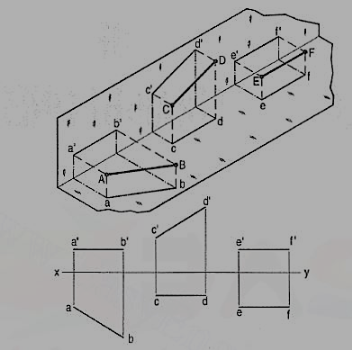
Figure 19
(a) Line AB is parallel to the H.P.
a and b are the top views of the ends A and B respectively. It can be clearly seen that the figure ABba is a rectangle. Hence, the top view ab is equal to AB.
a'b' is the front view of AB and is parallel to xy.
(b) Line CD is parallel to the V.P. The line c'd' is the front view and is equal to CD; the top view cd is parallel to xy.
(c) Line ff is parallel to the H.P. And the V.P. Ef is the top view and e'f' is the front view; both are equal to ff and parallel to xy.
Hence, when a line is parallel to a plane, its projection on that plane is equal to its true length; while its projection on the other plane is parallel to the reference line.
Perpendicular to one of the reference planes
When a line is perpendicular to one reference plane, it will be parallel to the other.
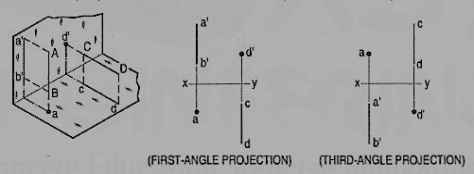
Figure 21
(a) Line AB is perpendicular to the H.P. The top views of its ends coincide in the point a. Hence, the top view of the line AB is the point a. Its front view a' b' is equal to AB and perpendicular to xy.
(b) Line CD is perpendicular to the V.P. The point d' is its front view and the line cd is the top view. Cd is equal to CD and perpendicular to xy.
Hence, when a line is perpendicular to a plane its projection on that plane is a point; while its projection on the other plane is a line equal to its true length and perpendicular to the reference line.
In first-angle projection method, when top views of two or more points coincide, the point which is comparatively farther away from xy in the front view will be visible; and when their front views coincide, that which is farther away from xy in the top view will be visible.
In third-angle projection method, it is just the reverse. When top views of two or more points coincide the point, which is comparatively nearer xy in the front view will be visible; and when their front views coincide, the point which is nearer xy in the top view will be visible.
Inclined to one & parallel to other reference plane
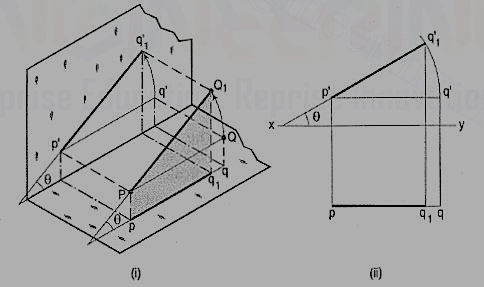
Figure 22
The inclination of a line to a plane is the angle which the line makes with its projection on that plane.
Line PQ1 [fig. 22 (i)] is inclined at an angle 8 to the H.P. And is parallelto the V.P. The inclination is shown by the angle 8 which PQ1 makes withits own projection on the H.P., viz. The top view pq1.
The projections [fig. 22 (ii)] may be drawn by first assuming the line to be parallel to both the H.P. And the V.P. Its front view p'q' and the top view pq will both be parallel to xy and equal to the true length. When the line is turned about the end P to the position PQ1 so that it makes the angle 8 with the H.P. While remaining parallel to the V.P., in the front view the point q' will move along an arc drawn with p' as center and p'q' as radius to a point q'1 so that p'q'1 makes the angle 8 with xy. In the top view, q will move towards p along pq to a point q1 on the projector through q'1. p'q'1 and pq1 are the front view and the top view respectively of the line PQ1.
Inclined to both reference planes
A line AB (fig. 23) is inclined at θ to the H.P. And is parallel to the V.P.The end A is in the H.P. AB is shown as the hypotenuse of a right-angledtriangle, making the angle θ with the base.
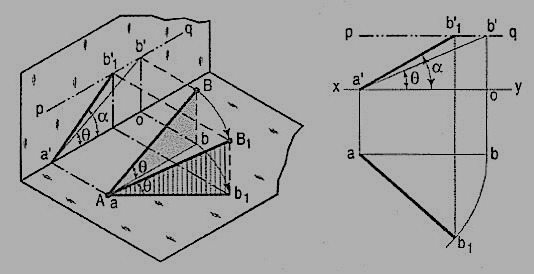
Figure 23
The top view ab is shorter than AB and parallel to xy. The front view a'b' is equal to AB and makes the angle θ with xy.
Keeping the end, A fixed and the angle θ with the H.P. Constant, if the end B is moved to any position, say B1, the line becomes inclined to the V.P. Also.
In the top view, b will move along an arc, drawn with a as center and ab as radius, to a position b1. The new top view ab1 is equal to ab but shorter than AB.
In the front view, b' will move to a point b'1 keeping its distance from xy constant and equal to b'o; i.e. it will move along the line pq, drawn through b' and parallel to xy. This line pq is the locus or path of the end B in the front view. b'1 will lie on the projector through b1. The new front view a'b'1 is shorter than a'b' (i.e. AB) and makes an angle a with xy. a is greater than θ.
Thus, if the inclination θ of AB with the H.P.is constant, even when it is inclined to the V.P.
(i) its length in the top view, viz. Ab remains constant; and
(ii) the distance between the paths of its ends in the front view,viz. b'o remains constant.
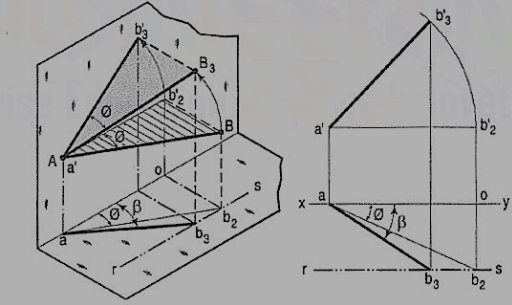
Figure 24
b) The same line AB (fig. 24) is inclined at ϕ to the V.P. And is parallel to the H.P. Its end A is in the V.P. AB is shown as the hypotenuse of a right-angled triangle making the angle ϕ with the base.
The front view a'b'2 is shorter than AB and parallel to xy. The top view ab2 is equal to AB and makes an angle ϕ with xy.
Keeping the end, A fixed and the angle ϕ with the V.P. Constant, if B is moved to any position, say B3, the line will become inclined to the H.P. Also.
In the front view, b'2, will move along the arc, drawn with a' as center and a'b'2 as radius, to a position b'3. The new front view a'b'3 is equal to a'b'2 but is shorter than AB.
In the top view, b2 will move to a point b3 along the line rs, drawn through b2 and parallel to xy, thus keeping its distance from the path of a, viz. b2o constant. Rs is the locus or path of the end B in the top view. The point b3 lies on the projector through b'3. The new top view ab3 is shorter than ab2 (i.e. AB) and makes an angle β with xy. β is greater than ϕ.
Here also we find that, if the inclination of AB with the V.P. Does not change, even when it becomes inclined to the H.P.
(i) its length in the front view, viz. a'b'2 remains constant; and
(ii) the distance between the paths of its ends in the top view, viz. b2o remains constant.
Hence, when a line is inclined to both the planes, its projections are shorter than the two length and inclined to xy at angles greater than the true inclinations. These angles viz. α and β are called apparent angles of inclination.
References:
1. N. D. Bhatt, Engineering Drawing, Charotar Publishing House, 46th Edition, 2003.
2. K. V. Nataraajan, A text book of Engineering Graphic, Dhanalakshmi Publishers, Chennai, 2006.
3. K. Venugopal and V. Prabhu Raja, Engineering Graphics, New Age International (P) Ltd, 2008.
4. Dhananjay A. Jolhe, Engineering Drawing with an Introduction to Autocad,
McGraw Hill Education, 2017
