Unit 7
Psychrometry and psychometric charts
Psychometry is a term used to describe the field of engineering concerned with
the determination of physical and thermodynamic properties of gas-vapor mixtures The term derives from the Greek psuchron meaning "cold" and metron meaning "means of measurement"
The principles of psychometric apply to any physical system consisting of gas vapor mixtures. The most common system of interest, however, are mixtures of water vapor and air because of its application in heating, ventilating, and air-conditioning and meteorology.
Psychometric chart
|
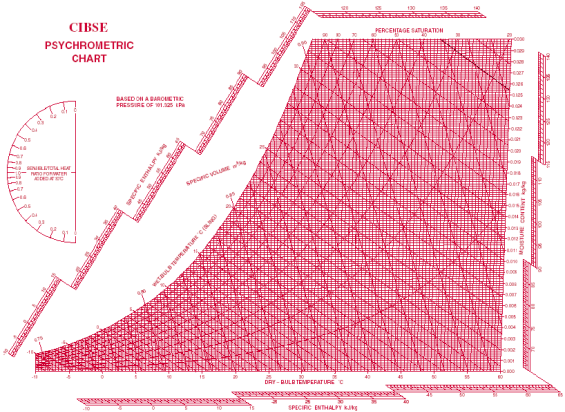
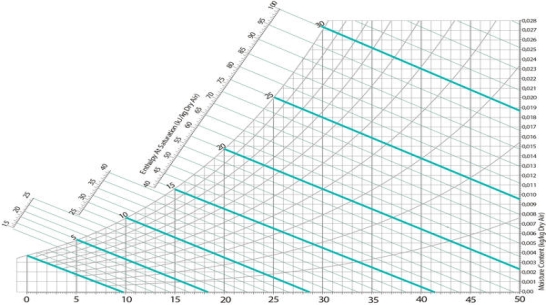
Fig 1- simple psychometric chart
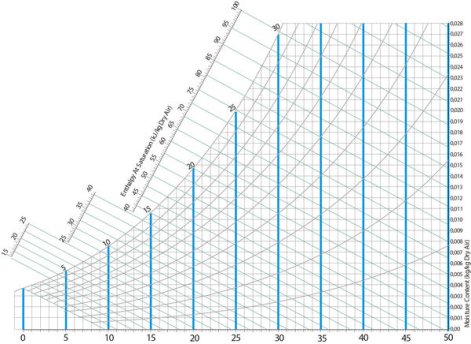
A psychrometric chart is a graph of the physical properties of moist air at a constant pressure (often equated to an elevation relative to sea level). The chart graphically expresses how various properties relate to each other, and is thus a graphical equation of state. The thermo physical properties found on most psychrometric charts are:
• Dry-bulb temperature (DBT) is that of an air sample, as determined by an ordinary thermometer, the thermometer's bulb being dry. It is typically the x axis, the horizontal axis, of the graph. The SI units for temperature are Kelvin; other units are Fahrenheit.
• Wet-bulb temperature (WBT) is that of an air sample after it has passed through a constant-pressure, ideal, adiabatic saturation process, that is, after the air has passed over a large surface of liquid water in an insulated channel. In practice, this is the reading of a thermometer whose sensing bulb is covered with a wet sock evaporating into a rapid stream of the sample air. The WBT is the same as the DBT when the air sample is saturated with water. The slope of the line of constant WBT reflects the heat of vaporization of the water required to saturate the air of a given relative humidity.
• Dew point temperature (DPT) is that temperature at which a moist air sample at the same pressure would reach water vapor saturation. At this saturation point, water vapor would begin to condense into liquid water fog or (if below freezing) solid hoarfrost, as heat is removed. The dewpoint temperature is measured easily and provides useful information, but is normally not considered an independent property. It duplicates information available via other humidity properties and the saturation curve.
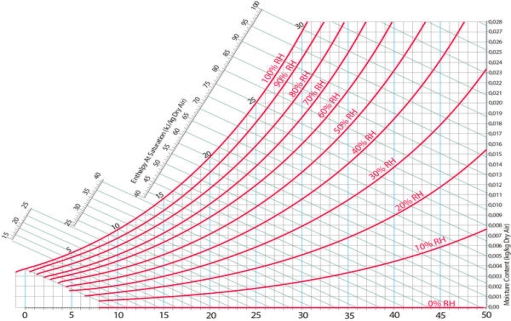
• Relative humidity (RH) is the ratio of the mole fraction of water vapor to the mole fraction of saturated moist air at the same temperature and pressure. RH is dimensionless, and is usually expressed as a percentage. Lines of constant RH reflect the physics of air and water: they are determined via experimental measurement. Note: the notion that air "holds" moisture, or that moisture dissolves in dry air and saturates the solution at some proportion, is an erroneous (albeit widespread) concept (see relative humidity for further details).
• Humidity ratio (also known as moisture content, mixing ratio, or specific humidity) is the proportion of mass of water vapor per unit mass of dry air at the given conditions (DBT, WBT, DPT, RH, etc.). It is typically the y-axis, the vertical axis, of the graph. For a given DBT there will be a particular humidity ratio for which the air sample is at 100% relative humidity: the relationship reflects the physics of water and air and must be measured. Humidity ratio is dimensionless, but is sometimes expressed as grams of water per kilogram of dry air or grains of
water per pound of air.
• Specific enthalpy symbolized by h, also called heat content per unit mass, is the sum of the internal (heat) energy of the moist air in question, including the heat of the air and water vapor within. In the approximation of ideal gases, lines of constant enthalpy are parallel to lines of constant WBT. Enthalpy is given in (SI)
joules per kilogram of air or BTU per pound of dry air.
• Specific volume, also called inverse density, is the volume per unit mass of the
air sample. The SI units are cubic meters per kilogram of dry air; other units are
cubic feet per pound of dry air The versatility of the psychrometric chart lies in the fact that by knowing three independent properties of some moist air (one of which is the pressure), the other properties can be determined. Changes in state, such as when two air streams mix, can be modelled easily and somewhat graphically using the correct psychrometric chart for the location's air pressure or elevation relative to sea level. For locations at or below 2000 ft (600 m), a common assumption is to use the sea level psychrometric chart.
The relationship between DBT, WBT, and RH is given by the Mollier diagram (pressure-enthalpy) for water in air, developed by Richard Mollier Willis Carrier, considered the 'father' of modern air-conditioning, rearranged the Mollier diagram for moist air (its T-s chart) to allow such graphical solutions. Many variations and improvements to the psychrometric charts have occurred since, and most charts do not show the specific entropy (s) like the Mollier diagram. ASHRAE now publishes what are considered the modern, standard psychrometric charts, in both I-P and SI units, for a variety of elevations or air pressures.
How to read the chart
The most common chart used by practitioners and students alike is the "ω-t" (omega-t) chart in which the dry bulb temperature (DBT) appears horizontally as the abscissa and the humidity ratios (ω) appear as the ordinates. In order to use a particular chart, for a given air pressure or elevation, at least two of the six independent properties must be known (DBT, WBT, RH, humidity ratio, specific enthalpy, and specific volume). This gives rise to possible combinations.
DBT: This can be determined from the abscissa on the x-axis, the horizontal axis
DPT: Follow the horizontal line from the point where the line from the horizontal axis arrives at 100% RH, also known as the saturation curve.
WBT: Line inclined to the horizontal and intersects saturation curve at DBT point.
RH: Hyperbolic lines drawn asymptotically with respect to the saturation curve which corresponds to 100% RH.
Humidity ratio: Marked on the y-axis.
Specific enthalpy: lines of equal values, or hash marks for, slope from the upper left to the lower right.
Specific volume: Equally spaced parallel family of lines.
Key Takeaways
- A psychometric chart is a graph of the physical properties of moist air at a constant pressure (often equated to an elevation relative to sea level).
2. The chart graphically expresses how various properties relate to each other, and is thus a graphical equation of state.
3. Dew point temperature (DPT) is that temperature at which a moist air sample at the same pressure would reach water vapor saturation.
Sensible heat
Sensible heat is heat exchanged by a thermodynamic system that changes the temperature of the system without changing some variables such as volume or pressure. As the name implies, sensible heat is the heat that you can feel.
The sensible heat possessed by an object is evidenced by its temperature. As temperature increases, the sensible heat content also increases. However, for a given change in sensible heat content, all objects do not change temperature by the same amount. Each substance has its own characteristics relationship between heat content and temperature. The proportionality constant between temperature rise and change in heat content is called the specific heat, measured in calories per gram per degree Celsius or joules per kilogram per kelvin. Water for example has a specific heat of 1 Cal/g/oC. In general, the gain in heat is accompanied by either a change in volume or a change in pressure (e.g. the water in the pot swells somewhat as you heat it; if you heat gas in a fixed volume, its pressure goes up).
LATENT HEAT
This is the energy absorbed or released by a thermodynamic system during a constant temperature process.
Examples include ice melting or water boiling. When a solid turns into a liquid (melts) or a liquid turns into a gas (evaporates), the loosening of attraction among the molecules requires energy. If you raise ice from -20oC to 0 oC, you put in sensible heat. If you keep adding heat to the ice, it melts but its temperature is constant, the sensible heat of ice/water system is not increasing but you continue to add heat energy to it. Energy is conserved, such that the extra heat tears apart the frozen ice molecules and sets them loose as a liquid. The liquid is therefore storing this energy in a form that you cannot sense. This energy is call latent heat.
To melt all the ice, you have to pump in quite a bit of heat, but you cannot sense any change in the heat content because ice/water system remains at 0oC. Only after all the ice has melted does the temperature of the water rise. At this point, the heat you put in is once again creating a change in sensible heat. However, although you cannot feel it, the liquid has stored all that latent heat. The only way you will observe the latent heat is if you try to transform the water back to ice. If you take the temperature down to 0oC, that alone will not freeze water; you must keep pulling out heat until you have removed every joule of latent heat. Only then will all the water freeze and you can begin to remove more sensible heat and lower the temperature of the system below 0oC.
Heat energy is conserved no matter how the phase change occurs. If you put heat into water, it can evaporate. It evaporates on its own even if you do not add heat. The water will cool off; i.e. some of the sensible heat is lost and converted to latent heat. Conversely, if you cool off some water vapor, it can condense into liquid. If it condenses on its own, it will give off (sensible) heat and get warmer. Therefore sensible heat can be felt while latent heat is the type of heat that cannot be felt.
Very often air having different conditions are mixed in the air conditioning system, such as the mixing of fresh air and return or re-circulated air before it enters the process plant. The psychometric chart can be used to find the resulting condition of the mixture.
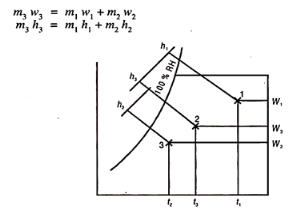
Figure 2 shows the schematic diagram showing two streams of air mixing together.
Let the two streams of masses m1 and m2 humidity rations w1 and w2 and enthalpies h1 and h2 respectively, mix together without any heat exchange with surroundings and also exchange of moisture to give a stream of mass m3 = m1 + m2 humidity w3 = w1 + w2 and enthalpy h3 = h1 – h2.
Fig 2
Eliminating m3 and rearranging the above equation we get
m1/ m2 = w3-w2/w1-w3 = h3-h2/h1-h3
The final condition of the mixture can be found with the help of chart as follows:
First determine the percentage of air in each stream, in the mixture. Let in stream one, this is x%. Therefore, (100 – x) is the percentage of air mass in other stream.
Then locate the two points 1 and 2 from the given conditions of two streams. Join 1 and 2. Next step is very important. Multiply the dry bulb temperature of each air by its percentage in the mixture. Let this be x.t1. This is the contribution of stream (1) DB degrees to the mixture. Similarly for second stream (100 -x) t2 will be DB degrees contributing in the mixture.
x t1 + (100 – x) t2 = 100 x t3
t3 can be found.
Draw a vertical at t3 to meet the line 1-2 in 3. Then all other properties can be found from the chart.
Evaporative cooling
The heart of the modern evaporative cooling system is the cooling pad where water evaporates and air passing through is then cooled. The cooling pads are manufactured from fluted cellulose sheets that are glued together. The material is impregnated with special compounds to prevent rot and ensure a long service life and minimal maintenance.
A special water distribution system spreads water over the cooling pads, ensuring a uniform supply of water that keeps the entire surface wet to maximize cooling capability. Fans create a negative pressure, causing air to be drawn through the pads. Evaporation results from contact between air and water. A control system operates the water pump and the fan distributes the cool air in the area.
The benefits of evaporative cooling:
- Clean air that reduces the risk of bacteria and virus
- No chemicals or refrigerants
- Low energy consumption
- Virtually maintenance-free equipment
Key Takeaways
- A special water distribution system spreads water over the cooling pads, ensuring a uniform supply of water that keeps the entire surface wet to maximize cooling capability.
Standard Thermodynamic Properties for Selected Substances | |||
Substance | ΔH∘f (kJ mol–) | ΔG∘f (kJ mol–1) | S298∘ (J K–1 mol–1) |
aluminium | |||
Al(s) | 0 | 0 | 28.3 |
Al(g) | 324.4 | 285.7 | 164.54 |
Al3+(aq) | –531 | –485 | –321.7 |
Al2O3(s) | –1676 | –1582 | 50.92 |
AlF3(s) | –1510.4 | –1425 | 66.5 |
AlCl3(s) | –704.2 | –628.8 | 110.67 |
AlCl3·6H2O(s) | –2691.57 | –2269.40 | 376.56 |
Al2S3(s) | –724.0 | –492.4 | 116.9 |
Al2(SO4)3(s) | –3445.06 | –3506.61 | 239.32 |
antimony | |||
Sb(s) | 0 | 0 | 45.69 |
Sb(g) | 262.34 | 222.17 | 180.16 |
Sb4O6(s) | –1440.55 | –1268.17 | 220.92 |
SbCl3(g) | –313.8 | –301.2 | 337.80 |
SbCl5(g) | –394.34 | –334.29 | 401.94 |
Sb2S3(s) | –174.89 | –173.64 | 182.00 |
SbCl3(s) | –382.17 | –323.72 | 184.10 |
SbOCl(s) | –374.0 | — | — |
arsenic | |||
As(s) | 0 | 0 | 35.1 |
As(g) | 302.5 | 261.0 | 174.21 |
As4(g) | 143.9 | 92.4 | 314 |
As4O6(s) | –1313.94 | –1152.52 | 214.22 |
As2O5(s) | –924.87 | –782.41 | 105.44 |
AsCl3(g) | –261.50 | –248.95 | 327.06 |
As2S3(s) | –169.03 | –168.62 | 163.59 |
AsH3(g) | 66.44 | 68.93 | 222.78 |
H3AsO4(s) | –906.3 | — | — |
barium | |||
Ba(s) | 0 | 0 | 62.5 |
Ba(g) | 180 | 146 | 170.24 |
Ba2+(aq) | –537.6 | –560.8 | 9.6 |
BaO(s) | –548.0 | –520.3 | 72.1 |
BaCl2(s) | –855.0 | –806.7 | 123.7 |
BaSO4(s) | –1473.2 | –1362.3 | 132.2 |
beryllium | |||
Be(s) | 0 | 0 | 9.50 |
Be(g) | 324.3 | 286.6 | 136.27 |
BeO(s) | –609.4 | –580.1 | 13.8 |
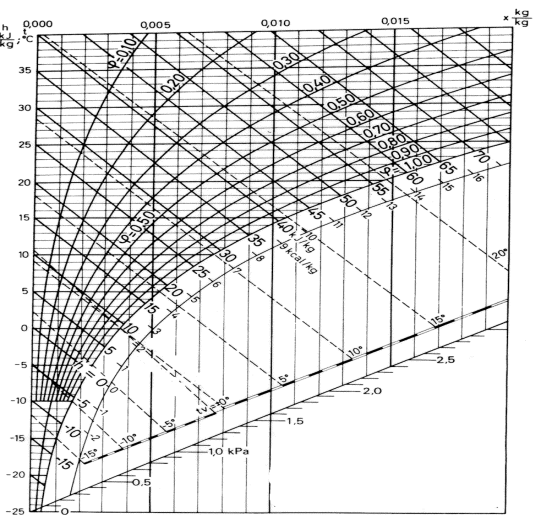
The Mollier diagram is a graphic representation of the relationship between air temperature, moisture content and enthalpy - and is a basic design tool for building engineers and designers
Air is a mixture of mostly oxygen, nitrogen and water vapor. The Mollier diagram is a graphic representation of the relationship between air temperature, moisture content and enthalpy, and is a basic design tool for building engineers and designers.
|
Fig 3
Example - How to use the Mollier Chart
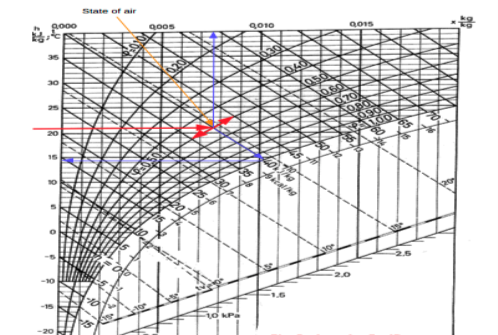
The state of air with dry bulb temperature 21 oC and relative humidity 50% is indicated in the Mollier chart below:
|
Fig 4
From the Mollier chart the enthalpy of the moist air is approximately 40 kJ/kg The wet bulb temperature is approximately 14.5 oC The specific humidity is approximately 0.0076 kg/kg.
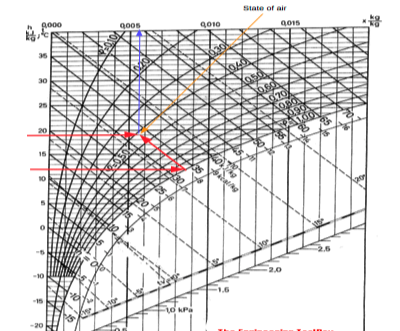
Alternatively- if the dry bulb temperature is 19 oC and the wet bulb temperature is 12 oC - the state of the air can be visualized in the Mollier chart like:
|
Fig 5
From the chart we can see that the enthalpy of the air is approximately 33 kJ/kg and the specific humidity is approximately 0.0056 kg/kg.
Psychometric chart
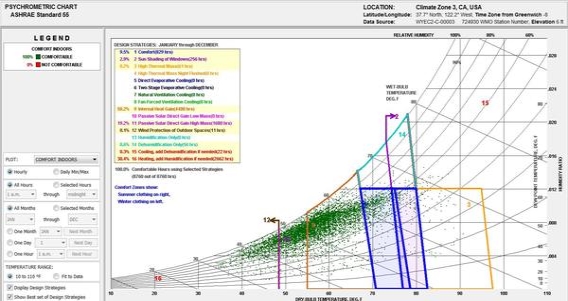
A psychometric chart is a graphical representation of the psychrometric process of air Psychrometric processes includes physical and thermodynamic properties such as dry bulb temperature, wet bulb temperature, humidity, enthalpy, and air density. A psychrometric chart can be used in two different ways. The first is done by plotting multiple data points that represent the air conditions at a specific time, on the chart. Then overlaying an area that identifies the “comfort zone.” The comfort zone is defined as the ranges within occupants are satisfied with the surrounding thermal conditions. After plotting the air conditions and overlaying the comfort zone, it becomes possible to see how passive design strategies can extend the comfort zone.
| |
. |
Fig 6
Example of how plotted data on a psychometric chart can be studied and related to passive design In this chart, the dark blue boxes represent the comfort zone, and the other colors represent design strategies that have been enabled to study how they can potentially expand the comfort zone. This psychometric chart was generated using Climate Consultant
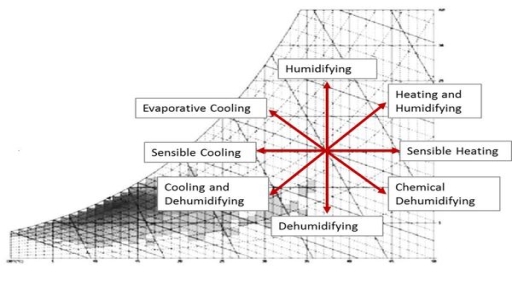
The chart is also often used by mechanical engineers to dynamically plot points that represent the exterior air conditions and understand the process the air must go through to reach comfortable conditions for the occupants inside a building. When using the psychrometric chart for this purpose the data points move around the chart.
|
Fig 7
Psychrometric charts show temperature vs. humidity, and can be used to express human thermal comfort, design strategies, and energy requirements for those strategies
Anatomy of the Psychrometric Chart
Temperature
Every psychrometric chart includes vertical lines that represent the dry bulb temperatures. Air temperature increases from left to right.
|
Fig 8 Dry bulb temperature lines on a psychrometric chart
Every psychrometric chart also includes wet bulb temperatures. These lines are indicated at diagonals, and like dry bulb temperatures they increase from left to right.
|
Fig 9 Wet bulb temperature lines on a psychrometric char
Relative Humidity
Another feature indicated on every psychrometric chart is relative humidity lines. These lines are curved, and begin at 100% along the top of the chart, and decrease moving downward. It is fairly common for these lines to be indicated in intervals of ten.
|
Fig 10) Relative humidity lines on a psychrometric chart
It is a well-known fact that heat flows in the direction of decreasing temperature, i.e., from a high temperature region to a low temperature region.
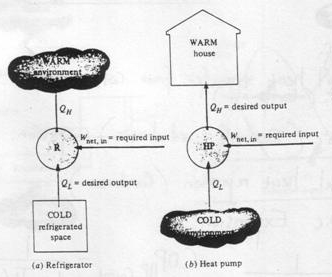
But the reverse process (i.e. heat transfer from low to high temperature) cannot occur by itself (Clausius Definition of Second Law). This process requires a special device called Refrigerator.
Refrigerator and heat pump
Another device which transfers heat from low to high temperature is a Heat Pump. Heat pump and refrigerator cycles are very similar. The difference is in their objectives.
|
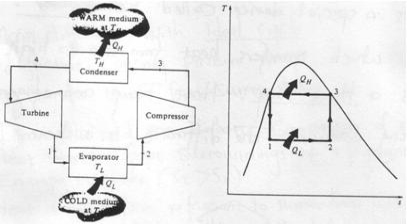
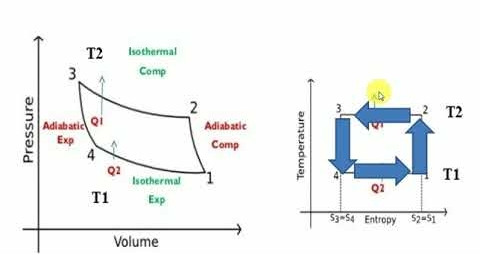
Carnot cycle is a totally reversible cycle which consists of two reversible isothermal processes and two isentropic processes. It has the maximum efficiency for a given temperature limit.
Since it is a reversible cycle, all four processes can be reversed. This will reverse the direction of heat and work interactions, therefore producing a refrigeration cycle.
|
Fig 12
The cycle consists of
1-2: Isothermal heat transfer from cold medium to refrigerant (Evaporator)
2-3: Isentropic (Reversible adiabatic) compression
3-4: Isothermal heat rejection (condenser)
4-1: Isentropic Expansion
|
Practical Difficulties of Carnot cycle compression of two-phase mixture from 1-2 Expansion from 4-1 results in a very wet refrigerant, causing erosion of turbine blades.
Ideal vapour compression refrigeration cycle
The impracticalities of the reversed Carnot Cycle can be eliminated by: Vaporising the refrigerant completely before it is compressed replacing the turbine by a throttle valve by implication; isothermal processes are replaced by constant pressure processes
.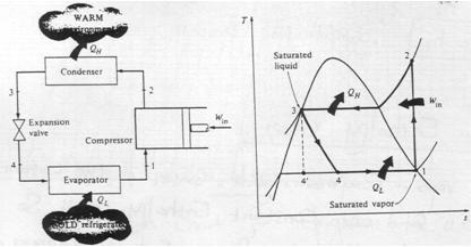
Fig 13
The cycle consists of:
1-2: Isentropic compression
2-3: Constant pressure heat rejection (Condenser)
3-4: Adiabatic expansion in a throttling device
4-1: Constant pressure heat absorption (Evaporator)
The throttling process
Imagine a steady flow process in wich a restriction is introduced into a flow line or pipe. As a result a pressure drop occurs. The process is irreversible.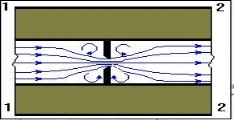
Fig 14
Applying SFEE
|
Therefore, h2 = h1
Actual vapour-compression cycle
Two main differences with ideal cycle:
Fluid frictions, causing pressure drop
Heat transfer to or from surroundings.
|
Fig 15
|
Fig 16
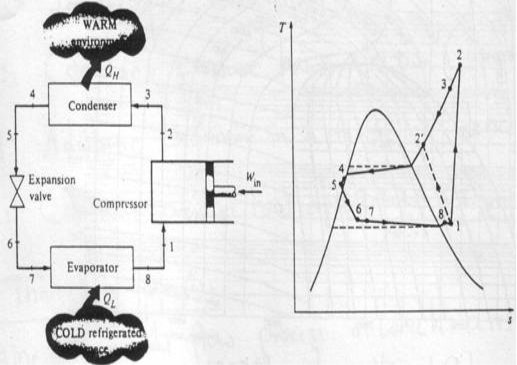
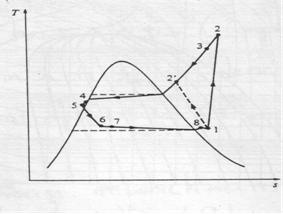
1-2: Irreversible and non-adiabatic compression of refrigerant. Heat transfer from surroundings to refrigerant è Entropy increases (S2>S1).
1-2': Heat transfer from refrigerant to surroundings è S2'<S1 (preferred)
2-3: Temperature (& pressure) drop due to fluid friction and heat transfer
3-4: pressure drops in the condenser because of fluid friction
4-5: temperature and pressure drop (as in 2-3)
5-6: Throttling process
6-7: The throttle valve and evaporator are usually located very close to each other, so pressure drop in connecting line is small.
Refrigerator
|
Fig 17 Refrigerator
In the refrigeration cycle, there are five basic components: a fluid refrigerant; a compressor, a condenser coil, an evaporator coil, and an expansion device. The compressor constricts the refrigerant vapor, raising its pressure, and pushes it into the coils on the outside of the refrigerator. When the hot gas in the coils meets the cooler air temperature of the kitchen, it becomes a liquid. Now, in the liquid form at high pressure, the refrigerant cools down as it flows into the coils inside the freezer and the fridge. The refrigerant absorbs the heat inside the fridge, cooling down the air. Lastly, the refrigerant evaporates and then flows back to the compressor, where the cycle repeats itself.
- Separation of gases: Separation of air into its constituents by fractional distillation as different components of air liquefies at different temperatures.
- Condensation of gases: In industries, gases such as ammonia are condensed before storage and shipment.
- Dehumidification of air: Air is dehumidified by liquefying and separating the moisture present in it.
- Cooling for preservation: Vegetables, organic-chemical, and explosives are kept in cold storage for preservation.
|
Fig 18 heat pump
A heat pump is a mechanical compression cycle that can be reversed to either heat or cool a controlled space.
A typical heat pump consists of two parts: an indoor unit called an air handler and an outdoor unit similar to an air output unit. A compressor circulates a refrigerant that absorbs and releases heat as it travels between these two units. Here, the working fluid or the refrigerant (in its gaseous state) is pressurized by a compressor and circulated through the system. The process of compression makes the fluid hotter. The hot and pressurized vapor, on the discharge side of the compressor, is cooled in a heat exchanger called a condenser, until it condenses into a high pressure, moderate temperature liquid. The pressure of the condensed fluid is reduced using a pressure-lowering device such as a capillary tube or an expansion valve. The temperature of the low-pressure liquid is increased in a heat exchanger after which the refrigerant is made to return to the compressor and the cycle is repeated.
- Space heating: Heat pump is used to heat an enclosed area such as a workspace, greenhouses, and houses.
- Water heating: Water in industries and households is heated using heat recovered from other reactions using the heat pump.
- Process heating: In industries, the heat pump is used to heat the process fluid before the reactions.
- Heat recovery: Heat pump is used to recover process heat from other reactions.
Key Takeaways
- A typical heat pump consists of two parts: an indoor unit called an air handler and an outdoor unit similar to an air output unit.
2. A compressor circulates a refrigerant that absorbs and releases heat as it travels between these two units
The Reversed Carnot Cycle
Reversed Carnot cycle is an ideal refrigeration cycle for constant temperature external heat source and heat sinks. The figure below shows the schematic of a reversed Carnot refrigeration system using a gas as the working fluid along with the cycle diagram on T-s and P-v coordinates. As shown, the cycle consists of the following four processes:
Process 1-2: Reversible, adiabatic compression in a compressor
Process 2-3: Reversible, isothermal heat rejection in a compressor
Process 3-4: Reversible, adiabatic expansion in a turbine
Process 4-1: Reversible, isothermal heat absorption in a turbine
|
Fig 19 Reversed Carnot cycle
In process 1-2: The gas is isentropically compressed, and there is no heat flow into or out of the refrigerator. In process 2-3: Heat is expelled into the sink (e.g. outside air) isothermally (T2=T3). The amount of heat ejected per unit mass of gas is QC=T2 (S2−S3). In process 3-4: The gas is isentropically expanded. The pressure and temperature decrease to P4, T4. Heat transfer at this stage is zero. In process 4-1: The gas expands isothermally (T4=T1), extracting heat from the source (e.g. room). This is where the cooling takes place. The heat extracted from the source per unit mass of gas is QH=T1(S1−S4)=T1(S2−S3) The work done during the process is simply W=QH−QC = T1(S2−S3) - T2 (S2−S3). = (T1−T2)(S2−S3) The efficiency of the reverse Carnot cycle is the heat removed from the cold reservoir / the amount of work input: ηcool=QC / W ηcool= T2 (S2−S3) / (T1−T2)(S2−S3) So ηcool = T2 / T1−T2 Coefficient of Performance (COP) The performance of refrigerators is expressed in terms of coefficient of performance (COP): Coefficient of performance of the system working on the Reverse Carnot cycle C.O.P = Heat absorbed / work done = qa /qa – qr = T1( S1 – S3 )/ ( T2 – T1 ) (S1 – S3 ) = T1/ T2 – T1 Reverse Carnot cycle is most efficient between the fixed temperature limits yet no refrigerator could be made using this cycle. This is due to the fact that the isentropic process requires high speed and the isothermal process requires extremely low speed The reversed Carnot cycle is the most efficient refrigeration cycle operating between two specified temperature levels. It sets the highest theoretical COP.
|
Key Takeaways
1. C.O.P = Heat absorbed / work done
2. The efficiency of the reverse Carnot cycle is the heat removed from the cold reservoir / the amount of work input
Actual Vapour Compression Cycle
|
Fig 20 actual vapour compression cycle
The actual vapour compression cycle differs from the theoretical vapour compression cycle in many ways, some of which are unavoidable and cause losses. The main deviations between the theoretical cycle and actual cycle are as follows:
- The vapour refrigerant leaving the evaporator is in superheated state.
- The compression of refrigeration is neither isentropic nor polytropic.
- The liquid refrigerant before entering the expansion valve is sub-cooled in the condenser.
- The pressure drops in the evaporator and condenser.
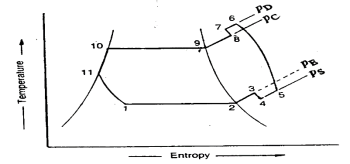
The actual vapour compression cycle on T-s diagram is shown . The various processes are discussed below
(a) Process 1-2-3: This process shows the flow of refrigerant in the evaporator. The point 1 represents the entry of refrigerant into the evaporator and the point 3 represents the exit of refrigerant from evaporator in a superheated state. The point 3 also represents the entry of refrigerant into the compressor in a superheated condition. The superheating of vapour refrigerant from point 2 to point 3 may be due to
(i) Automatic control of expansion valve so that the refrigerant leaves the evaporator as the superheated vapour.
(ii) Picking up of larger amount of heat from the evaporator through pipes located within the cooled space.
(iii) Picking up of heat from the suction pipe, i.e., the pipe connecting the evaporator delivery and the compressor suction valve.
In the first and second case of superheating the vapour refrigerant, the refrigerating effect as well as the compressor work is increased. The coefficient of performance, as compared to saturation cycle at the same suction pressure may be greater, less or unchanged. The superheating also causes increase in the required displacement of compressor and load on the compressor and condenser. This is indicated by 2-3 on T-s diagram as shown.
(b) Process 3-4-5-6-7-8: This process represents the flow of refrigerant through the compressor. When the refrigerant enters the compressor through the suction valve at point 3, the pressure falls to point 4 due to frictional resistance to flow. Thus the actual suction pressure (Ps) is lower than the evaporator pressure (Pe). During suction and prior to compression, the temperature of the cold refrigerant vapour rises to point 5 when it comes in contact with the compressor cylinder walls. The actual compression of the refrigerant is shown by 5-6 , which is neither isentropic nor polytropic. This is due to the heat transfer between the cylinder walls and the vapour refrigerant.
The temperature of the cylinder walls is some-what in between the temperatures of cold suction vapour refrigerant and hot discharge vapour refrigerant. It may be assumed that the heat absorbed by the vapour refrigerant from the cylinder walls during the first part of the compression stroke is equal to heat rejected by the vapour refrigerant to the cylinder walls. Like the heating effect at suction given by 4-5, there is a cooling effect at discharge as given by 6-7. These heating and cooling effects take place at constant pressure. Due to the frictional resistance of flow, there is a pressure drop i.e., the actual discharge pressure (Pd) is more than the condenser pressure (Pc).
(c) Process 8-9-10-11: This process represents the flow of refrigerant though the condenser. The process 8-9 represents the cooling of superheated vapour refrigerant to the dry saturated state. The process 9-10 shows the removal of latent heat which changes the dry saturated refrigerant into liquid refrigerant. The process 10-11 represents the sub-cooling of liquid refrigerant in the condenser before passing through the expansion valve.
This is desirable as it increases the refrigerating effect per kg of the refrigerant flow. It also reduces the volume of the refrigerant partially evaporated from the liquid refrigerant while passing through the expansion valve. The increase in refrigerating effect can be obtained by large quantities of circulating cooling water which should be at a temperature much lower than the condensing temperatures.
(d) Process 11-1: This process represents the expansion of subcooled liquid refrigerant by throttling from the condenser pressure to the evaporator pressure.
Effect of Suction Pressure
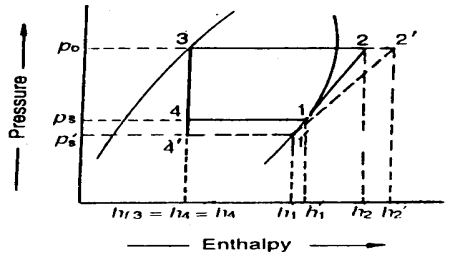
We have discussed in the previous article that in actual practice, the suction pressure (or evaporator pressure) decreases due to the frictional resistance of flow of the refrigerant. Let us consider a theoretical vapour compression cycle 1'-2'-3-4' when the suction pressure decreases from ps to ps' as shown on p-h diagram. It may be noted that the decrease in suction pressure
- decreases the refrigerating effect from (h1 - h4) to (h1'- h4') and
- increases the work required for compression from (h2 – h1) to (h2' – h1')
|
Fig 21
Since the C.O.P. of the system is the ratio of refrigerating effect to the work done, therefore with the decrease in suction pressure, the net effect is to decrease C.O.P. of the refrigerating system for the same amount of refrigerant flow. Hence with the decrease in suction pressure, the refrigerating capacity of the system decreases and the refrigeration cost increases.
Effect of Discharge Pressure
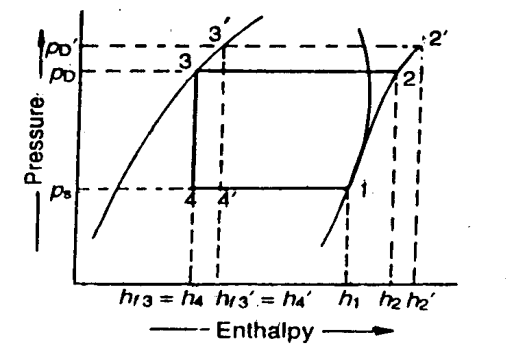
We have already discussed that in actual practice, the discharge pressure (or condenser pressure) increases due to frictional resistance of flow of the refrigerant. Let us consider a theoretical vapour compression cycle 1-2'-3'-4' when the discharge pressure increases from Pd to Pd' as shown on p-h diagram.
|
Fig 22
It may be noted that the increase in discharge pressure:
- decreases the refrigerating effect from (h1 - h4) to (h1 - h4')
- increases the work required for compression from (h2-h1) to (h2' - h1)
From above, we see that the effect of increase in discharge pressure is similar to the effect of decrease in suction pressure. But the effect of increase in discharge pressure is not as severe on the refrigerating capacity of the system as that of decrease in suction pressure.
Heat pump
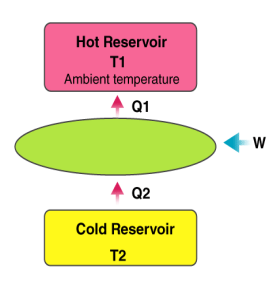
A heat pump is a device which applies external work to extract an amount of heat QC from a cold reservoir and delivers heat QH to a hot reservoir. A heat pump is subject to the same limitations from the second law of thermodynamics as any other heat engine and therefore a maximum efficiency can be calculated from the Carnot cycle. Heat Pumps are usually characterized by a coefficient of performance which is the number of units of energy delivered to the hot reservoir per unit work input.
|
The coefficient of performance (CP) for a heat pump is the ratio of the energy transferred for heating to the input electric energy used in the process. In reference to the standard heat engine illustration, the coefficient is defined by
Coefficient of performance = QH/W
There is a theoretical maximum CP, that of the Carnot cycle :
|
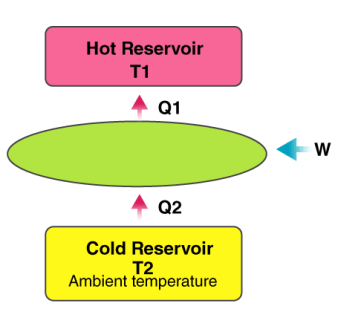
For a refrigerator, however, the useful quantity is the heat extracted, QC , not the heat exhausted. Therefore, the coefficient of performance of a refrigerator is expressed as
CpRefrigerator = Qc/w
Key Takeaways
- CpRefrigerator = Qc/w
- Coefficient of performance of heat pump= QH/W
Gas Refrigeration Cycle
Just as the vapors are used for cooling in the vapor compression cycle and vapor absorption cycle, the gas is used for cooling in gas refrigeration cycle. When the gas is throttled from very high pressure to low pressure in the throttling valve, its temperature reduces suddenly while its enthalpy remains constant. This principle is used in gas refrigeration system.
In this system instead of using Freon or ammonia as the refrigerant, the gas is used as the refrigerant. Throughout the cycle there are no phase changes of the gas, which are observed in the liquid refrigerants. Air is the most commonly used gas, also called as refrigerant in this case, in the gas refrigeration cycles.
Components and Working of the Gas Refrigeration Cycle
The components of the gas refrigeration cycle are very similar to the vapor compression cycle. The gas flows through the compressor where its pressure and temperature becomes very high. It then flows into the heat exchanger, which performs the function similar to the condenser in the vapor compression cycle, except that there is no change in the phase of air or gas. In the heat exchanger the air gives up heat, but its pressure remains constant
The high pressure and medium temperature air then enters the throttling valve (also called expander), where its pressure is reduced suddenly and due to this its temperature also becomes very low. The low temperature and low pressure gas then enters the other heat exchanger (also called refrigerator) which performs the function similar to the evaporator in vapor compression cycle. The gas absorbs the heat from the substance to be cooled and becomes hotter, while the substance becomes cooler. There is no change in phase of the gas in this heat exchanger. The high pressure and high temperature gas then enters the compressor where the cycle repeats.
When air is used as the refrigerant in the gas cycle, reverse Carnot cycle can be followed to achieve the refrigeration effect. However, the reverse Carnot cycle is an ideal cycle and is not useful for the practical applications. Bell Coleman cycle is a more practical cycle in which the isothermal processes are replaced by the constant pressure processes. This is one of earliest types of refrigerators and was used for ships for transport of the food items.
The efficiency of the gas cycles is lesser than the vapor compression cycle. For absorbing the same amount of heat or producing the same refrigerating effect, the amount of gas required is very high compared to the amount of the liquid refrigerant required, hence the refrigeration systems with the gas cycles tend to be very large and bulky.
Vapour absorption system:
The power utilized in vapour compression system is high grade energy i.e., electric power for running the compressor motor. In absorption refrigeration system, however, heat is directly utilized as source of energy. Of course, it may be preferable to utilize heat as such as it avoids undergoing through the various energy transformations required in the generation of electrical energy from heat energy.
It may be recalled that in the compression system the vapour was compressed by undergoing a great change in volume during the compression process. Accordingly the major part of the power was consumed in the process. If means were available for rising this pressure of the refrigerant without appreciably altering its volume, the work requirements will be enormously reduced (by about 95% or so).
This may possibly be done by dissolving the refrigerant in some absorbent and supplying the heat to the solution for compression purposes. The absorption cycle achieves this objective by placing the refrigerant in solution before the so called compression process and by removing from the solution immediately after the process. The absorption of the vapour is governed by Raoult’s law.
The basic difference between vapour compression and vapour absorption cycles will thus be to replace the compressor of the vapour compression cycle by a set of equipment which fulfils the objective discussed above. The other important element i.e., condenser, expansion device and evaporator will exist in both systems.
Simple Vapour Absorption Cycle:
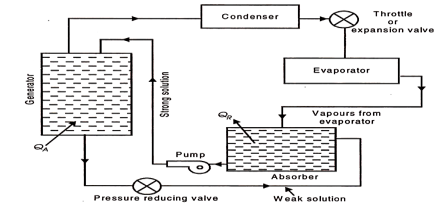
Illustrates the simplest scheme of equipment required for the replacement of the compressor.
|
Fig 23 Equipment replacing the compressor (simple vapour absorption system of refrigeration)
QA = Heat added or supplied
QR = Heat rejected to cooling
The most commonly used fluids in the absorption system are water as absorbent and ammonia as refrigerant. The vapour from the evaporator is allowed to be mixed and absorbed in the absorber. The heat of absorption generated in the process is rejected from the absorber to the circulating cold water in a heat exchanger dipped in the solution contained in the absorber.
The strong aqua-ammonia solution from the absorber is pumped upto the condenser pressure and fed to the generator which is the main energy consuming element of the system. Heat is supplied to the generator. The boiling point of refrigerant NH3, is lower than that of the absorbing liquid H2O, hence the vapours leaving the generator are predominantly those of refrigerant.
These vapours then pass on to the condenser. The liquid refrigerant from the condenser, then, passes through an expansion valve or throttle valve to the evaporator where it absorbs heat from the substances or bodies to be refrigerated. Liquid refrigerant is then evaporated and the vapours enter the absorber completing the cycle.
The weak aqua-ammonia solution in the generator left due to separation of refrigerant vapour is drained back to the absorber for repeating the cycle.
The weak aqua-ammonia solution leaving the generator is at high pressure and the pressure in the absorber is the evaporator pressure which is less than the generator or condenser pressure, and hence a pressure reducing valve is provided in the weak solution line to the absorber. The energy requirements of the system are at the generator and at the pump as compared to those at compressor in the vapour compression system. Since the volume of liquid handled by the pump is too small, the power required here is almost negligible as compared to that by the generator.
Practical Absorption Refrigeration Cycle:
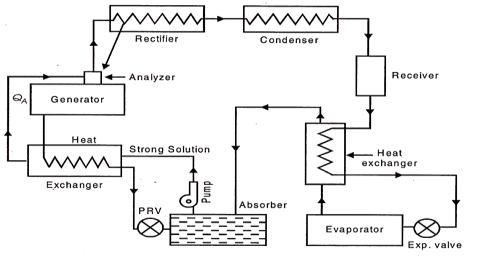
The replacement of the compressor by the simple arrangement of Fig. 36.33 is not very economical in practice. In order to make improvements certain additional auxiliary items are provided in the system. They include analyzer, a rectifier, and two heat exchangers. The practical absorption cycles as developed after incorporating these auxiliaries is shown in Fig
(a) Analyser:
The ammonia vapours leaving the generator may contain certain moisture, and therefore it should be freed from any trace of water vapour before passing on to the condenser and then to the expansion valve, otherwise the water vapour is likely to freeze in the small valve passage and choke the flow. The function of the analyzer is to remove the moisture as far as possible. It is an open types of cooler and forms an integral part of the generator, mounted on its top. Both the strong aqua-ammonia solution from the absorber and the condensate removed in rectifier are introduced from the top and flow downwards. The hot rising vapour of ammonia therefore comes in contact with the same and gets cooled. Thus most of the water vapour is condensed and drips back into the generator. This helps in salvaging a certain portion of heat in outgoing vapour which would otherwise have been rejected out through the condenser.
|
Fig 24 Practical absorption System
(b) Rectifier:
It is a closed type of cooler and is actually a miniature condenser where any traces of water vapour left in the ammonia vapour, are removed by condensation The cooling is achieved by circulating water as is done in an ordinary condenser. The condensed aqua is drained back to the generator through the analyser.
(c) Heat Exchangers:
Two heat exchangers are provided to internally exchange heat from the higher temperature fluid to the lower temperature fluid so that one is cooled and the other is heated. One heat exchanger is provided between liquid receiver and evaporator so that the liquid is sub-cooled and vapour is heated up. Another heat exchanger is located between generator and absorber so that the strong aqua is heated up before going on to the analyser and weak aqua is cooled before entering the absorber.
Performance of Vapour Absorption System:
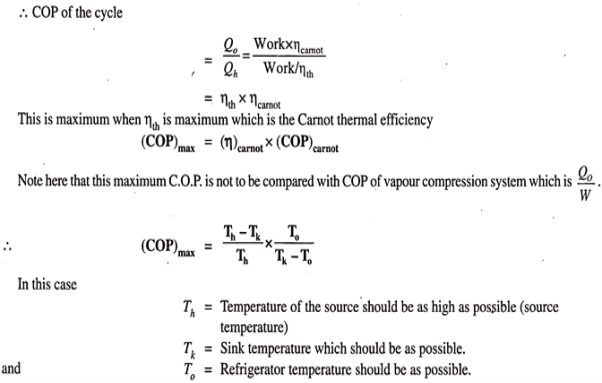
Maximum coefficient of performance of heat operated vapour absorption system:
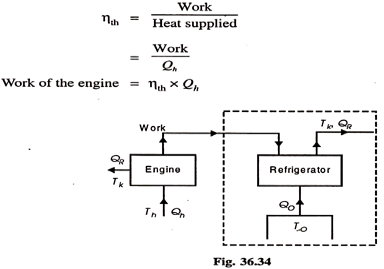
We know that refrigerant vapours are liberated from the strong solution when heated in a generator. This type of the machine or system is called a heat operated machine. Let Th be the temperature at which heat is supplied to the strong solution.
Tk is the temperature at which heat is rejected to atmosphere; To is the temperature of the body to be refrigerated. Thermal efficiency of the engine is given by-
|
Fig 25
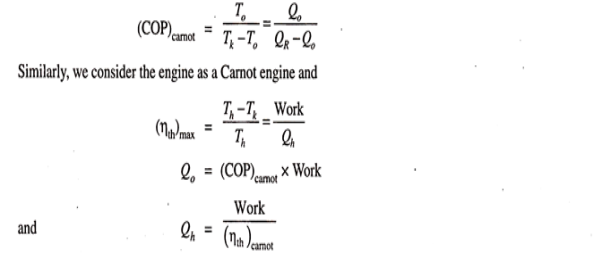
This work, it is assumed, is used for refrigeration system. For refrigeration system, To is the temperature at which heat is given to refrigerant (actually this is the heat abstracted from the body to be refrigerated) and the heat is rejected the atmosphere at Tk temperature. To get the maximum COP, we have to consider the Carnot reversed engine.
|
|
Reference:
- ASHRAE Handbook (HVAC Equipment’s)
- ASHRAE, Air Conditioning System Design Manual, IInd edition, ASHRAE.
- Stocker W.F. and Jones J.W., Refrigeration and Air-conditioning, McGraw Hill International.
- Threlkeld J.L., Thermal Environmental Engineering, Prentice Hall Inc. New Delhi
