Unit - 2
Spectroscopic techniques and applications
Vibrational Spectroscopy
When light interacts with a material, multiple processes can occur: reflection
transmission, scattering, absorption, fluorescence or vibration. These processes take place when the incident radiation induces changes in the energy level of the material. The change in energy level can be detected and can provide valuable information regarding the underlying material. Vibrational spectroscopy along with autofluorescence provides information regarding the biochemical component based on the interaction of light.
Rotational Spectroscopy
It is concerned with the measurement of the energies of transitions between quantized rotational states of molecules in gaseous form. The spectra of polar molecules can be measured in absorption or emission or IR Spectroscopy. the non-polar molecules can be measured by Raman spectroscopy. Homonuclear diatomic molecules such as molecular hydrogen nitrogen, and oxygen have no net dipole moment. when the molecule stretches and compresses itself in its one vibrational mode, the equilibrium is unchanged, and at no time does a dipole moment exist. On the other hand, heteronuclear diatomic such as HCl and CO have permanent dipole moment, which changes in magnitude as the molecule vibrates. Hence, HCl and CO have electric dipole-allowed transitions and therefore show infrared absorptions corresponding to vibrational excitation.
Electronic spectroscopy depends on the quantized nature of energy states, an c electron can be excited from its original ground state or initial excited state (hot band) and briefly exist in a higher energy excited state. Electronic transitions involve exciting an electron from one principle quantum state to another without incentive, an electron will not transition to a higher level only by absorbing energy, can an electron be excited.
In general, an excitation source such as X-rays, electrons or synchrotron radiation will eject from an inner-shell orbital of an atom.
When we pass white light through a substance that is coloured, some of the light gets absorbed. A solution having hydrated copper (II) ions, for example looks pale blue because the solution absorbs light from the red end of the spectrum. The other wavelengths in the light combine with the eye and the brain to give the appearance of cyan (pale blue).
Some colourless materials are also found to absorb light - but in the ultra-violet region. Different materials absorb different wavelengths of light, and this can be used to help to find the substance - the presence of particular metal ions.
The amount of absorption of light also depends on the concentration of the substance in solution. The measurement of the amount of absorption can be used to find concentrations of very dilute solutions. An absorption spectrometer measures the amount of light is absorbed by a compound varies across the UV and visible spectrum.
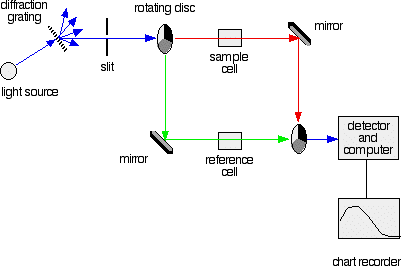
Fig 1: A simple double beam spectrometer
We need a light source which gives the entire visible spectrum together with the near ultra-violet so that you are covering the range from about 200 nm to about 800 nm. (This extends slightly into the near infra-red as well.)
This range of wavelengths is not obtained from a single lamp, and so a combination of two is used - a deuterium lamp for the UV part of the spectrum, and a tungsten / halogen lamp for the visible part. The combined output of these two bulbs is focused on to a diffraction grating.
A diffraction grating does it but more efficiently.

Fig.2: The diffraction grating and the slit
The blue arrows show the way the various wavelengths of the light are sent off in different directions. The slit only allows light of a very narrow range of wavelengths through into the rest of the spectrometer. By gradually rotating the diffraction grating, we allow light from the whole spectrum (a tiny part of the range at a time) through into the rest of the instrument.
The rotating disks
Each disk is made up of a number of different segments. Those that are in the machine are described to have three different sections - other designs may have a different number.
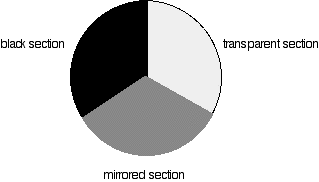
Fig 3: Different sections of rotating disc
The light coming from the diffraction grating and slit will hit the rotating disk and one of three things can happen.
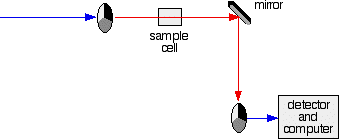
Fig. 4: The red path shows the sequence of steps in the diagram:
2. If the original beam of light that comes from the slit hits the mirrored section of the first rotating disk, it is bounced down along the green path as shown in the diagram. After the mirror, it passes through a small reference cell. Finally, the light moves to the second disk which rotates in a way that it meets the transparent section. It goes straight through to the detector and then to the computer.
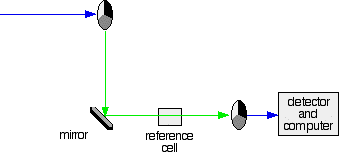
Fig.5: Green path shows the movement of light from disc to the detector
If the light meets the first disk at the black section, it will be blocked - and for some time no light passes through the spectrometer. This will allow the computer to permit any current generated by the detector in the absence of any light.
The sample and reference cells
These are very small rectangular glass or quartz containers or called cuvettes. They are so that the light beam travels a distance of 1 cm through the contents inside the cuvette. The sample cell contains a solution of the substance for testing - usually that is very dilute. The solvent is chosen so that it doesn't absorb any significant amount of light in the wavelength range we are interested in (200 - 800 nm). The reference cell contains only the pure solvent.
Detector converts the light coming into a current. The higher the current, the greater will be the intensity of the light. For each wavelength of light passing through the spectrometer, the intensity of the light passing through the reference cell and is measured. This is usually referred to as Io - where I stand for Intensity.
The intensity of the light passing through the sample/cuvette cell is also measured for that wavelength - given the symbol, I for intensity.
If I is lesser than Io, then assuredly the sample has absorbed some of the light. A simple math is then done in the computer to convert this into something called the absorbance of the sample – which is given the symbol, A.
For reasons which will become clearer, the relationship between A and the two intensities is given by:
A=log(I/Io)
The absorbance ranges from 0 to 1, but it can go higher than that. An absorbance of 0 at some wavelength means that absolutely no light of that particular wavelength has been absorbed. The intensities of the sample solution and solvent beam are both the same, so the ratio Io/I is 1. Log10 of 1 is zero.
The absorption spectrum is a plot of absorbance against wavelength. The output on the computer will look like this:
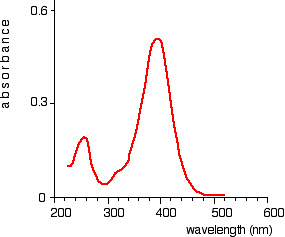
Fig. 6: Absorption spectrum showing sharp curve at 255 and 395 nm
This particular substance has a sharp curve at and is known as absorbance peaks at 255 and 395 nm.
Fluorescence spectrometry is a fast, simple and inexpensive method to determine the concentration of an analyte in solution based on its fluorescent properties. It can be used for measuring compounds in solution.
In fluorescence spectroscopy, a beam of light with a wavelength varying between 180 and ∼800 nm passes through a solution present in a cuvette. We then measure it – from an angle - the light that is emitted by the sample. In fluorescence spectrometry both an excitation spectrum (the light that is absorbed by the sample solution) and/or an emission spectrum (the light emitted by the sample solution) can be measured or estimated. The concentration of the analysis sample is directly proportional with the intensity of the emission.
There are several parameters influencing the intensity and shape of the spectrum. When recording an emission spectrum, the intensity is dependent on the:
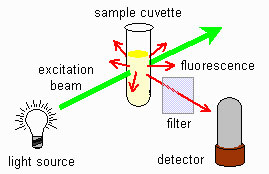
Fig 6: Fluorimeter scheme
The figure shows a schematic representation of fluorescence. The light source is at a 90-degree angle with the detector. The sample is located at the intersection of the two beam paths can we use it?
An excitation (also called an absorption spectrum) and an emission spectrum of a fluorescent compound can be created. The absorption spectrum tells us which wavelengths coming towards it can be absorbed by the solution, with the emission or fluorescence spectrum, we can find out which wavelengths are emitted after absorbing the incoming light. In the figure below we see on the left side an excitation spectrum (200-400 nm) and on the right side an emission spectrum (375-550 nm) is shown. The x-axis shows the wavelength; The y-axis shows the intensity of the emission.
Excitation (left) fluorescence spectrum (right)
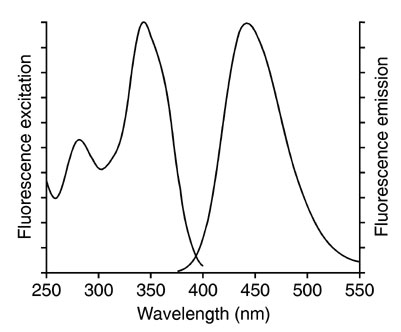
Fig.7: Fluorescence Emission
Applications of Fluorescence in Medicine
Fluorescence in the life sciences is used generally as a non-destructive way of tracing or analysis of biological molecules by using the fluorescent emission at a specific frequency.
Nuclear principles involve the alignment of the magnetic nuclear spins in an applied constant magnetic field. The perturbation of this alignment of the nuclear spins by a weak oscillating magnetic field, usually referred to as radio-frequency pulse. The oscillation frequency require for significant perturbation is dependent upon the static magnetic field and the nuclei.
It is a research technique that exploits the magnetic properties that are present in certain
atomic nuclei. The NMR spectroscopy identifies and determines the physical and chemical properties of molecules or atoms.
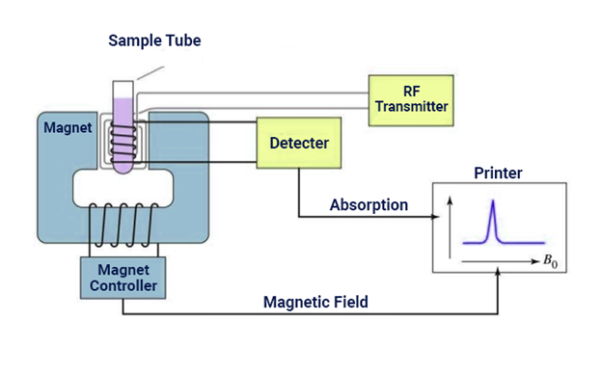
Fig 9: NMR Spectroscopy Instrumentation
It relies on the phenomenon of nuclear magnetic resonance and provides detailed information about the structure, dynamics, reaction state, and chemical environment of molecules.
Applications
It is a non-invasive imaging technology that produces three dimensional detailed anatomical images, it is often used for disease detection, diagnosis and treatment monitoring; the technology involves excitation and detection of the changes in the direction of the rotational axis of proton found in water that makes up the living tissues. MRI employ powerful magnets which produce a strong magnetic field that forces protons in the body to align with that field, when a radiofrequency current is pulsed through the patient, the protons are stimulated and spin out of equilibrium. The brain, spinal cord and nerves as well as muscles, ligaments and tendons are seen more clearly wit MRI than with regular X-ray and CT scans.
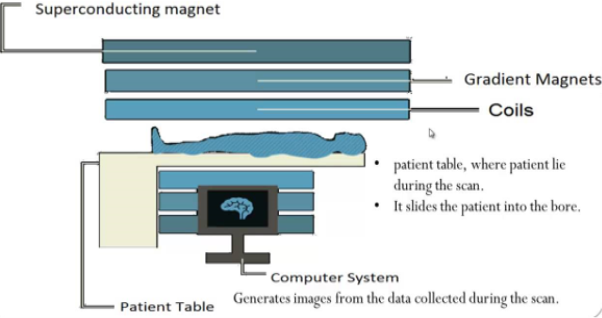
Fig.10: (MRI) is a test that uses powerful magnets, radio waves, and a computer to make detailed pictures inside our body.it can monitor how well you’re doing with a treatment. MRIs can be done on different parts of your body. It's especially useful for looking at soft tissues and the nervous system.
References: