Module 2
Turning Moment Diagram
The turning moment diagram (also known as crank-effort diagram) is the graphical representation of the turning moment or crank-effort for various positions of the crank. It is plotted on cartesian co-ordinates, in which the turning moment is taken as the ordinate and crank angle as abscissa.
2.1.1. Turning Moment Diagram for a Single Cylinder Double Acting Steam Engine:
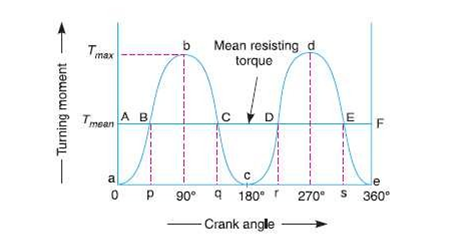
A turning moment diagram for a single cylinder double acting steam engine is shown in given figure. The vertical ordinate represents the turning moment and the horizontal ordinate represents the crank angle.
We know that the turning moment on the crankshaft is written as:


Fig .1 Turning moment diagram for a single cylinder, double acting steam engine.
Where,
 Piston effort,
 Radius of crank
 Radius of the connecting rod length and radius of crank
θ = Angle turned by the crank from inner dead centre.
From the above expression, we see that the turning moment (T) is zero, when the crank angle (θ) is zero.
The turning moment in crank shaft is maximum when the crank angle is 90° and it is again zero when crank angle is 180°.
This is shown by the curve abc in Fig. given above and it represents the turning moment diagram for outstroke. The curve cde is the turning moment diagram for in stroke and is somewhat similar to the curve abc.
Since the work done is the product of the turning moment and the angle turned, therefore the area of the turning moment diagram represents the work done per revolution. In actual practice, the engine is assumed to work against the mean resisting torque, as shown by a horizontal line AF. The height of the ordinate a A represents the mean height of the turning moment diagram. Since it is assumed that the work done by the turning moment per revolution is equal to the work done against the mean resisting torque, therefore the area of the rectangle aAFeis proportional to the work done against the mean resisting torque.
2.1.2. Turning Moment Diagram for a Four Stroke IC Engine
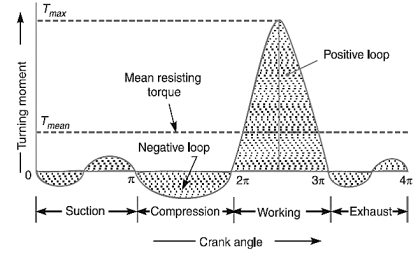
A turning moment diagram for a four-stroke cycle internal combustion engine is shown in Fig. We know that in a four-stroke cycle internal combustion engine, there is one working stroke after the crank has turned through two revolutions, i.e. 720° (or 4 π radians).

Figure 2: Turning moment diagram for a four-stroke cycle internal combustion engine
Since the pressure inside the engine cylinder is less than the atmospheric pressure during the suction stroke, therefore a negative loop is formed as shown in figure. During the compression stroke, the work is done on the gases, therefore a higher negative loop is obtained. During the expansion or working stroke, the fuel burns and the gases expands, therefore a large positive loop is obtained. In this stroke, the work is done by the gases. During exhaust stroke, the work is done on the gas, therefore a negative loop is formed. It may be noted that the effect of the inertia forces on the piston is taken into account in Figure.
2.1.3. Turning Moment Diagram for a Multi-cylinder Engine
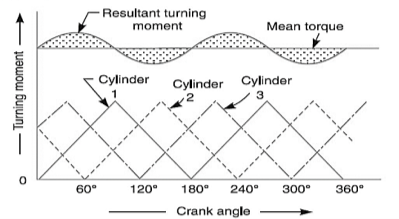
A separate turning moment diagram for a compound steam engine having three cylinders and the resultant turning moment diagram is shown in Fig. The resultant turning moment diagram is the sum of the turning moment diagrams for the three cylinders. It may be noted that the first cylinder is the high-pressure cylinder, second cylinder is the intermediate cylinder and the third cylinder is the low-pressure cylinder. The cranks, in case of three cylinders, are usually placed at 120° to each other.

Figure 3: Turning moment diagram for a multi-cylinder engine
2.1.4: Fluctuation of crankshaft speed:
The fluctuation of speed can be defined as the variation in speeds of device or object (crank shaft) during a cycle and the difference between the maximum and minimum speeds during a cycle is called the maximum fluctuation of speed.
The difference between the maximum and minimum speeds during a cycle is called the maximum fluctuation of speed. The ratio of the maximum fluctuation of speed to the mean speed is called the coefficient of fluctuation of speed.
Let N1 and N2 = Maximum and minimum speeds in r.p.m. during the cycle, and
N =mean speed in r.p.m. =
2.1.5: Coefficient of fluctuation of speed:

(
 (in terms of linear speeds)
The coefficient of fluctuation of speed is a limiting factor in the design of flywheel. It varies depending upon the nature of service to which the flywheel is employed.
2.2.1: Fluctuation of Energy:
The fluctuation of energy may be determined by the turning moment diagram for one complete cycle of operation. Consider the turning moment diagram for a single cylinder double acting steam engine as shown in Fig. 16.1. We see that the mean resisting torque line AF cuts the turning moment diagram at points B, C, D and E. When the crank moves from a to p, the work done by the engine is equal to the area aBp, whereas the energy required is represented by the area aABp. In other words, the engine has done less work (equal to the area a AB) than the requirement. This amount of energy is taken from the flywheel and hence the speed of the flywheel decreases. Now the crank moves from p to q, the work done by the engine is equal to the area pBbCq, whereas the requirement of energy is represented by the area pBCq. Therefore, the engine has done more work than the requirement. This excess work (equal to the area BbC) is stored in the flywheel and hence the speed of the flywheel increases while the crank moves from p toq.
Similarly, when the crank moves from q to r, more work is taken from the engine than is developed. This loss of work is represented by the area C c D. To supply this loss, the flywheel gives up some of its energy and thus the speed decreases while the crank moves from q to r. As the crank moves from r to s, excess energy is again developed given by the area D d E and the speed again increases. As the piston moves from s to e, again there is a loss of work and the speed decreases. The variations of energy above and below the mean resisting torque line are called fluctuations of energy. The areas BbC, CcD, DdE, etc. represent fluctuations of energy.
A little consideration will show that the engine has a maximum speed either at q or at s. This is due to the fact that the flywheel absorbs energy while the crank moves from p to q and from r to s. On the other hand, the engine has a minimum speed either at p or at r. The reason is that the flywheel gives out some of its energy when the crank moves from a to p and q to r. The difference between the maximum and the minimum energies is known as maximum fluctuation of energy.
2.2.2. Determination of Maximum Fluctuation of Energy:
A turning moment diagram for a multi-cylinder engine is shown by a wavy curve in Fig. The horizontal line A G represents the mean torque line. Let a1, a3, a5 be the areas above the mean torque line and a2, a4 and a6 be the areas below the mean torque line. These areas represent some quantity of energy which is either added or subtracted from the energy of the moving parts of the engine.
Let the energy in the flywheel at A = E, then from Fig. , we have Energy at B = E + a1
Energy at C = E + a1– a2
Energy at D = E + a1 – a2 + a3 Energy at E = E + a1 – a2 + a3 – a4
Energy at F = E + a1 – a2 + a3 – a4 + a5 Energy at G = E + a1 – a2 + a3 – a4 + a5 – a6
= Energy at A (i.e. cycle repeats after G)
Let us now suppose that the greatest of these energies is at B and least at E.
2.2.3. Expression for maximum fluctuation of energy:
Let  = maximum speed during the cycle.
 = minimum speed during the cycle.
N = mean speed of flywheel =
And  = co-efficient of fluctuation of speed
The mean kinetic energy of the flywheel


Key takeaway point: The difference between the maximum and the minimum energies is known as maximum fluctuation of energy and this formula is very useful while calculating maximum fluctuation of energy, 
A flywheel used in machines serves as a reservoir, which stores energy during the period when the supply of energy is more than the requirement, and releases it during the period when the requirement of energy is more than the supply.
In case of steam engines, internal combustion engines, reciprocating compressors and pumps, the energy is developed during one stroke and the engine is to run for the whole cycle on the energy produced during this one stroke. For example, in internal combustion engines, the energy is developed only during expansion or power stroke which is much more than the engine load and no energy is being developed during suction, compression and exhaust strokes in case of four stroke engines and during compression in case of two stroke engines. The excess energy developed during power stroke is absorbed by the flywheel and releases it to the crankshaft during other strokes in which no energy is developed, thus rotating the crankshaft at a uniform speed. A little consideration will show that when the flywheel absorbs energy, its speed increases and when it releases energy, the speed decreases. Hence a flywheel does not maintain a constant speed, it simply reduces the fluctuation of speed. In other words, a flywheel controls the speed variations caused by the fluctuation of the engine turning moment during each cycle of operation.
In machines where the operation is intermittent like *punching machines, shearing machines, riveting machines, crushers, etc., the flywheel stores energy from the power source during the greater portion of the operating cycle and gives it up during a small period of the cycle. Thus, the energy from the power source to the machines is supplied practically at a constant rate throughout the operation.
2.3.1. Energy Stored in a fly wheel:
We have discussed in that when a flywheel absorbs energy, its speed increases and when it gives up energy, its speed decreases.
Let, m = Mass of the flywheel in kg,
k = Radius of gyration of the flywheel in meters
I = Mass moment of inertia of the flywheel about its axis of rotation in kg

 maximum and minimum speeds during the cycle in r.p.m
N =mean speed during the cycle in r.p.m = 
 = mean angular speed during the cycle in r.p.m =
 coefficient of fluctuation of speed =
We know that the mean kinetic energy of the fly wheel.

As the speed of the fly wheel changes from ω1 toω2 the maximum fluctuation of energy.
 = maximum K.E – minimum K.E

 -------1


 (in N- m or joules)
2.3.2. Expression for Dimensions of Flywheel:
D= mean diameter of rim.
R= mean radius of rim.
A= cross- sectional area of rim.
 = density of rim material
N = speed of flywheel
 Angular velocity of flywheel.
 Tensile (or hoop) stress due to centrifugal force, and
V= linear velocity at the mean radius.

2. Consider a small element of rim which subtends an angle  at the centre of the flywheel.
3. Volume of the small element and, mass of the small element = AR 
Dm=Density ×volume
=
4. Centrifugal force that acts radially outwards

=
5. Vertical component of dF= dF sin 
= 
6. Total vertical upward force tending to burst the rim across the diameter XY,
 ………1
………1
7. This vertical upward force will produce hoop stress (or centrifugal stress or circumferential stress) and it is resisted by 2p, such that
 …………….2
8. On equating eq. (1) and eq. (2)


the mass of rim, m= volume × density
=

Using equations (1) and (2), we can find the value of the mass radius and cross- sectional area of the rim.
If the cross- sectional area of the rim is rectangular then,
 , where

 Thickness of the rim
Key takeaway point: and
and  are important formulas while expressing the dimensions of a flywheel.
References