Unit - 4
Properties of Pure Substance
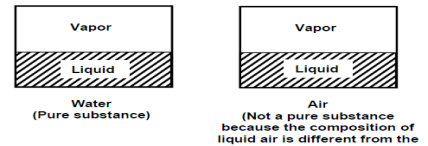
A substance that has a fixed chemical composition throughout is calledpure substance. Water, helium carbon dioxide, nitrogen are examples. It does not have to be a single chemical element just as long as it is homogeneous throughout, like air. A mixture of phases of two or more substance is can still a pure substance if it is homogeneous, like ice and water (solid and liquid) or water and steam (liquid and gas).
|
Fig 1
Phases of a Pure Substance
There are three principle phases – solid, liquid and gas, but a substance can have several other phases within the principle phase. Examples include solid carbon (diamond and graphite) and iron (three solid phases). Nevertheless, thermodynamics deals with the primary phases only. In general:
- Solids have strongest molecular bonds.
- Solids are closely packed three dimensional crystals.
- Their molecules do not move relative to each other
- Intermediate molecular bond strength
- Liquid molecular spacing is comparable to solids but their molecules can float about in groups.
- There is molecular order within the groups
- Weakest molecular bond strength.
- Molecules in the gas phases are far apart, they have no ordered structure
- The molecules move randomly and collide with each other.
- Their molecules are at higher energy levels, they must release large amounts of energy to condense or freeze.
Phase – Change Processes of Pure Substances
At this point, it is important to consider the liquid to solid phase change process. Not so much solid to liquid because thermodynamics deals only with liquid to gases (or vice versa) to generate power.
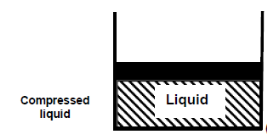
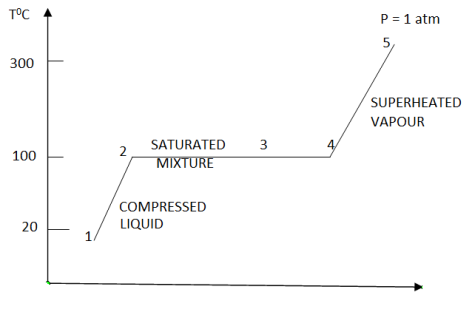
Consider water at room temperature (20°C) and normal atmospheric pressure (1 atm) in a piston-cylinder device. The water is in liquid phase, and it is called compressed liquid or sub cooled liquid (not about to vaporize).
|
Fig 2
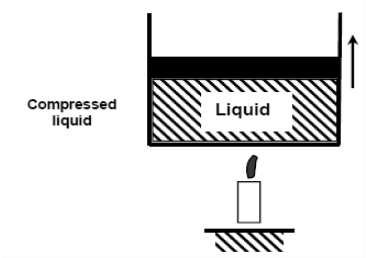
If we add heat to water, its temperature will increase; let us say until 50°C. Due to the increase in temperature, the specific volume v will increase. As a consequence, the piston will move slightly upward therefore maintaining constant pressure (1 atm).
|
Fig 3
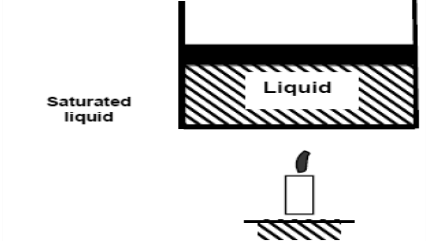
Now, if we continue to add heat to the water, the temperature will increase further until 100°C. At this point, any additional addition of heat will vaporize some water. This specific point where water starts to vaporize is called saturated liquid.
|
Fig 4
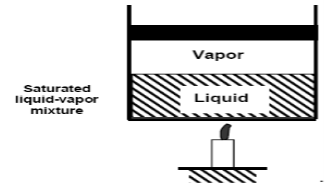
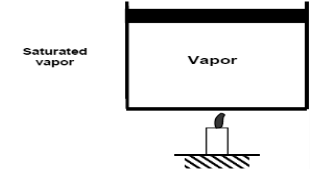
If we continue to add heat to water, more and more vapor will be created, while the temperature and the pressure remain constant (T = 100°C and P= 1 atm). The only property that changes is the specific volume. These conditions will remain the same until the last drop of liquid is vaporized. At this point, the entire cylinder is filled with vapor at 100°C. This state is called saturated vapor
|
Fig 5
The state between saturated liquid (only liquid) and saturated vapor (only vapor) where two phases exist is called saturated liquid-vapor mixture
|
Fig 6
After the saturated vapor phase, any addition of heat will increase the temperature of the vapor, this state is called superheated vapor
|
Figure 7: T-v diagram representing phase change for water at constant pressure
This concept can be applied to pure substance other than water
Property Diagrams for Phase Change Processes
T-v Diagram
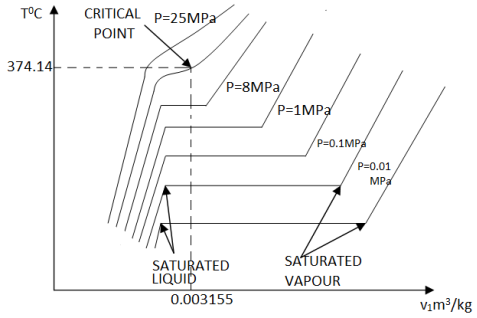
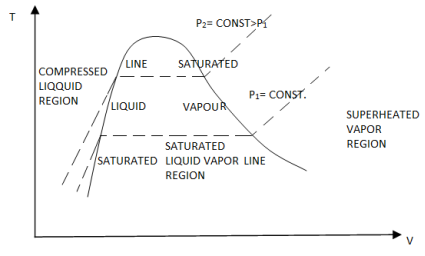
If we increase the pressure of water in the piston-cylinder device, the process from compressed liquid to superheated vapor will follow a path that looks like the process for P = 1 atm, the only difference is that the width of the mixture region will be shorter.
Then, at a certain pressure, the mixture region will be represented only by one point. This point is called the critical point. It is defined as the point at which the saturated liquid and saturated vapor states are identical.
At the critical point, the properties of a substance are called critical properties (critical temperature (Tcr), critical pressure (Pcr) and critical specific volume (Vcr)).
Example
Water Pcr = 22.09 MPa
Tcr = 374.148°C = 647.298 K
Vcr = 0.003155 m3/kg
Air Pcr = 3.77 MPa
Tcr = 132.5°C = 405.65 K
Vcr = 0.0883 m3/kg
|
Figure 8: T-v diagram
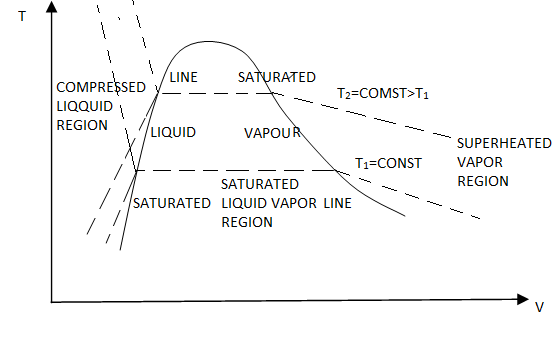
If we connect all the points representing saturated liquid we will obtain the saturated liquid line.
If we connect all the points representing saturated vapor we will obtain the saturated vapor line.
The intersection of the two lines is the critical point.
|
Figure 9: T-v diagram and saturation lines
P-v Diagram
If we consider the pressure-cylinder device, but with some weights above the piston, if we remove the weights one by one to decrease the pressure, and we allow a heat transfer to obtain an isothermal process, we will obtain one of the curves of the P-v diagram.
|
Figure 10: P-v diagram.
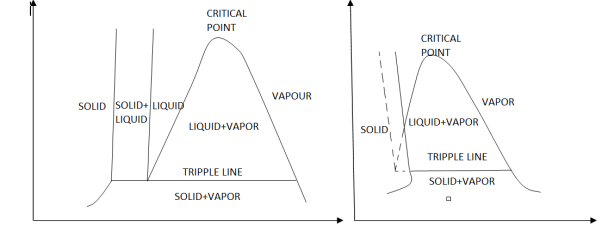
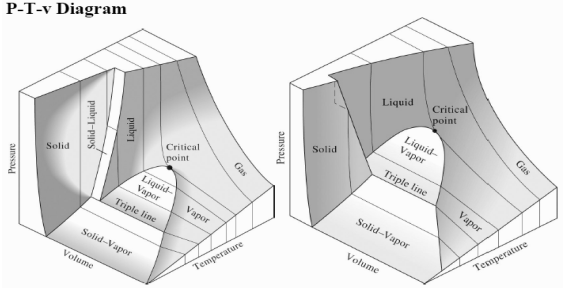
The P-v diagram can be extended to include the solid phase, the solid liquid and the solid-vapor saturation regions. As some substances, as water, expand whenthey freeze, and the rest (the majority) contracts during freezing process, we have two configurations for the P-v diagram with solid phase.
|
Figure 11: P-v diagram for a substance that contracts during freezing (left) and for a substance that expends during freezing (right).
Triple point
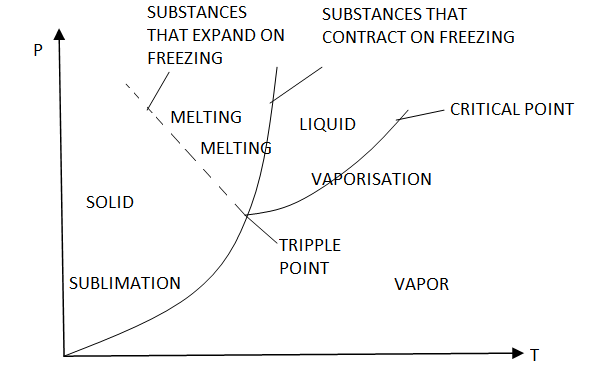
Until now, we have defined the equilibrium between two phases. However, under certain conditions, water can exist at the same time as ice (solid), liquid and vapor. These conditions define the so called triple point.
On a P-T diagram, these conditions are represented by a point.
Example
Water T = 0.01°C = 273.16 K and P = 0.6113 kPa
|
Figure 12: P-T diagram and the triple point.
The P-T diagram is often called the phase diagram since all three phases are separated by three lines.
Solid - vapor sublimation
Solid - liquid melting
Liquid - vapor vaporization
|
Figure 13: P-T-v diagram for a substance that contracts during freezing
(Left) and for a substance that expends during freezing (right).
Property Tables
In addition to the temperature, pressure, and specific volume data, tables contain data for the specific internal energy u, the specific enthalpy h, and the specific entropy s. In thermodynamics analysis, we will encounter the combination of properties U + PV frequently. For simplicity this combination is defined as a new property called enthalpy.
H =U + PV (kJ)
The enthalpy per unit mass is
h = u + PV (kJ/kg)
Temperature-Entropy Diagram of Water And Steam
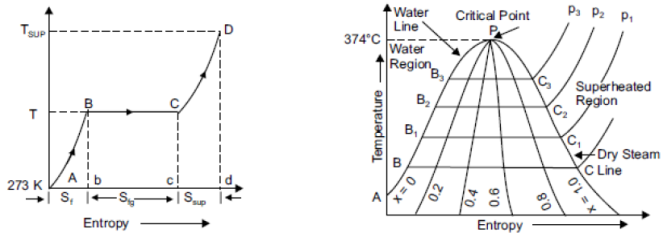
It is useful in solving the problem on adiabatic expansion and compression of steam. The abscissa of the diagram represents the entropy of the vertical ordinate showing the values of temperature as shown in figure. Consider 1 kg of water and steam above the freezing point of water at constant pressure. When heat is added to the water entropy will increase where the logarithmic curve increase in entropy = Sf = AB.
On further heating water starts evaporating and receives heat at constant temperature T. Entropy goes on increasing till the entire latent heat required to evaporate 1 kg of water has been supplied, increase in entropy Sfg = BC.
|
Fig 14
If we draw a family of similar curves at different pressure and plot the points B1, B2 and C1, C2 etc., then the line joining the points A, B1, B2, B3 etc. is called water line. Similarly, the line joining the points C, C1, C2, C3 etc. is called dry steam line. The point where the water and dry steam line meets (P) is called critical point it is represented by 374.15°C.
Isothermal Lines on T-S Diagram
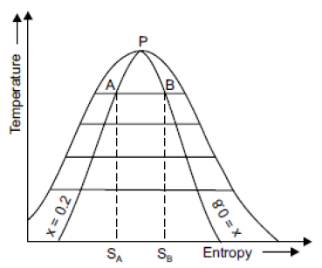
We know that there is no change of temperature during isothermal process.
1 kg of wet steam at 250°C, x = 0.2 at A expanded isothermally up to x = 0.8 at B
Increase in entropy = Sb – Sa= 5.42 – 3.45= 1.97 kJ/kg. K.
Isothermal line AB is shown in figure.
|
Fig 15
Isentropic Lines
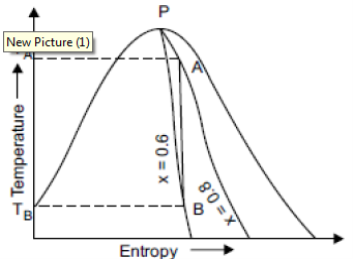
There is no increase or decrease in enthalpy or total heat during an isentropic process. There is no change in entropy during the process.
Consider a sample of 1 kg of wet steam at temperature of 310°C and dryness fraction of 0.8 at A. Let the sample expanded isentropically till its dryness fraction 0.6 marks B.
TA = 310°C, TB = 40°C Fall in temperature = 310 – 40= 270°C
It is shown in figure on t-s diagram.
|
Fig 16
Enthalpy–Entropy (H-S) Diagram For water And Steam or Mollier Chart
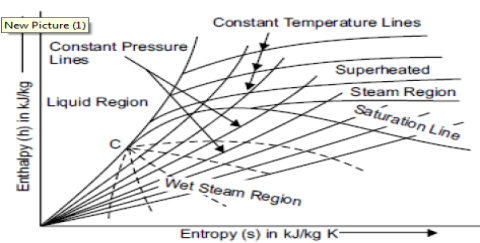
Mollier chart is a graphical representation of the steam tables, in which the enthalpy (h) Is plotted along the ordinate and entropy (s) along abscissa. First of all, enthalpy and entropy of water and dry saturated steam, for any particular pressure, are obtained from the steam tables. These values of enthalpies and entropies are plotted and then liquid line and dry saturated line is obtained. Both these line meet at C, i.e., the critical point as shown in figure. The critical point corresponds to the enthalpy of liquid and dry saturated steam at 221.2 bar. The enthalpy-entropy chart like temperature entropy chart, is also very useful in solving the problems in adiabatic or isentropic expansion and compression of steam. In actual diagram, abscissa of the diagram represents the entropy of 1 kg ofwater and steam, i.e., specific entropy above the freezing point of water and the vertical ordinate shows the values of specific enthalpy i.e., total heat, as shown in figure.The diagram is divided into two parts by a line termed as saturation line. Upper region of the saturation line is called superheated region where temperature of steam increases at given pressure and lower region of saturation line is called wet region where temperature of steam remains constant at a given pressure.
The Mollier diagram has the following lines
1. Dryness fraction lines
2. Constant volume (i.e., specific volume) line
3. Constant pressure lines
4. Isothermal lines
5. Isentropic lines and
6. Throttling line
|
Fig 17
Constant Volume Line
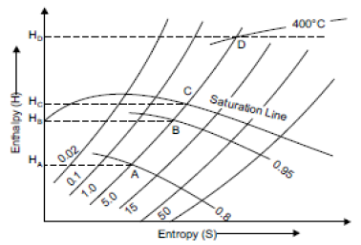
The constant volume lines are drawn in both the wet region and superheated steam region. These lines are straight in the wet steam region, but curved upwards above the saturation curve, i.e., superheated region as shown in figure. by parts AB and CD of line of constant volume 1.0.
|
Fig 18
Constant Pressure Line
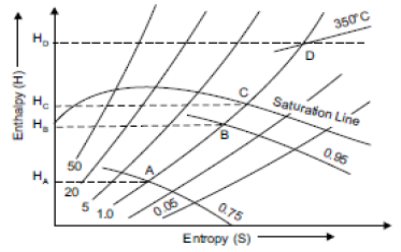
Constant pressure lines are drawn in both upper and lower region of saturated steam line. These lines are straight in the wet region because during vaporisation the increase of enthalpy is directly proportional to the increase in quality, and hence to the increase in entropy. It is curve and it is closer to wet region than superheated region is shown in figure.
|
Fig 19
Isothermal Line
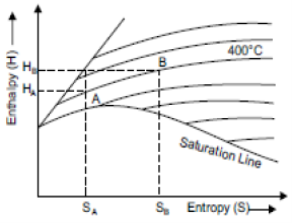
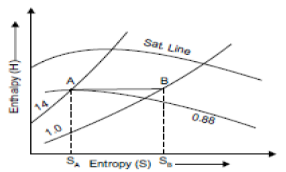
The isothermal lines or constant pressure lines are drawn only above the saturation line. These lines represent the condition of superheated steam between various values of enthalpy and entropy, as shown in figure 7.16 by the line AB.
|
Fig 20
Isentropic Line on (H-S) Diagram
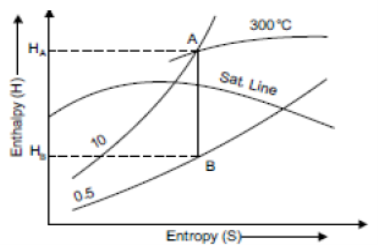
Isentropic process is a reversible adiabatic process. In this process entropy is constant. So isentropic line is parallel to vertical axis by the line AB which is shown in figure
|
Fig 21
Throttling Lines on H-S Diagram
In throttling process enthalpy before throttling is equal to enthalpy after throttling i.e., there is no change of enthalpy. So enthalpy line AB will be parallel to horizontal axis as shown in figure
|
Fig 22
Key takeaways
- If we connect all the points representing saturated liquid we will obtain the saturated liquid line.
2. If we connect all the points representing saturated vapor we will obtain the saturated vapor line.
It is necessary to understand the properties of steam so that we can make proper use of it. Equipment size can be decided, pipe systems can be perfectly designed. It also allows us to make informed decisions affecting the energy usage of the system.
The properties are: (1) Quality of steam (Dryness fraction) Dryness fraction in simple words denotes the mass of dry steam in given steam. Or how much steam is dry or in other words how much water vapour is present in steam. It is denoted by ‘x’. X = M / M +m Where M=mass of the dry steam The use of dryness fraction allows us to know both the mass of dry steam and mass of water vapour. Obviously for dry steam, x = 1 (2) Specific volume: Gases (steam is a gas) occupy less space under higher pressure than under lower pressure. This means 1 kilogram of steam occupies different volumes, depending upon its pressure. The term specific volume refers to the volume that one kg of steam occupies at a given pressure and temperature.
‘h‘ is generally used term which represents specific enthalpy, unit for which is KJ/Kg. In steam tables you will see enthalpy written as hi, hg, hig
|
Key takeaways
- Dryness fraction in simple words denotes the mass of dry steam in given steam. Or how much steam is dry or in other words how much water vapour is present in steam. It is denoted by ‘x’.
X = M / M +m
2. The total heat content of a substance is called enthalpy
For non-flow process: For flow process
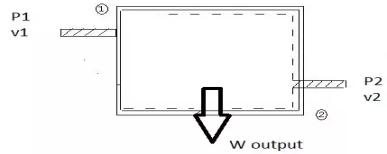
Fig 23 work at inlet is force *displacement of fluid per unit time
|
Reference:
- Engineering thermodynamics
- ASHRAE, Air Conditioning System Design Manual, IInd edition, ASHRAE.
- Thermodynamics P.K Nag
- Threlkeld J.L., Thermal Environmental Engineering, Prentice Hall Inc. New Delhi
