Unit - 5
Power Cycles
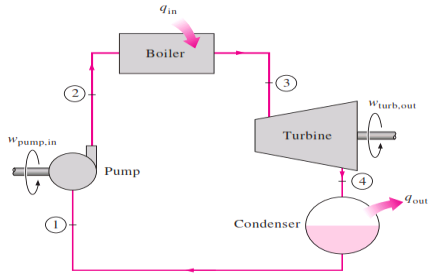
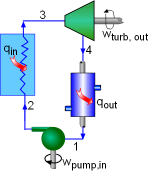
The ideal Rankine cycle does not involve any internal irreversibilities and consists of the following four processes:
1-2 Isentropic compression in a pump
2-3 Constant pressure heat addition in a boiler
3-4 Isentropic expansion in a turbine
4-1 Constant pressure heat rejection in a condenser
|
Fig 1 simple ideal Rankine cycle
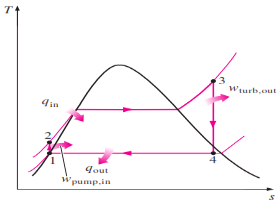
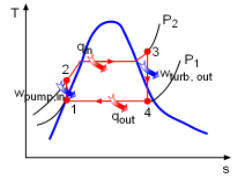
The T-S Diagram of Rankine cycle is shown below:
|
Fig 2 T-S Diagram
Water enters the pump at state 1 as saturated liquid and is compressed isentropically to the operating pressure of the boiler. The water temperature increases somewhat during this isentropic compression process due to a slight decrease in the specific volume of water. The vertical distance between states 1 and 2 on the T-s diagram is greatly exaggerated for clarity. Water enters the boiler as a compressed liquid at state 2 and leaves as a superheated vapor at state 3. The boiler is basically a large heat exchanger where the heat originating from combustion gases, nuclear reactors, or other
sources is transferred to the water essentially at constant pressure. The boiler, together with the section where the steam is superheated (the super heater), is often called the steam generator.
The superheated vapor at state 3 enters the turbine, where it expands isentropically and produces work by rotating the shaft connected to an electric generator. The pressure and the temperature of steam drop during this process to the values at state 4, where steam enters the condenser. At this state, steam is usually a saturated liquid–vapor mixture with a high quality. Steam is condensed at constant pressure in the condenser, which is basically a large heat
exchanger, by rejecting heat to a cooling medium such as a lake, a river, or the atmosphere. Steam leaves the condenser as saturated liquid and enters the pump, completing the cycle. In areas where water is precious,
the power plants are cooled by air instead of water. This method of cooling, which is also used in car engines, is called dry cooling. Several power plants in the world, including some in the United States, use dry cooling to conserve water.
Remembering that the area under the process curve on a T-s diagram represents the heat transfer for internally reversible processes, we see that the area under process curve 2-3 represents the heat transferred to the
water in the boiler and the area under the process curve 4-1 represents the heat rejected in the condenser. The difference between these two is the net work produced during the cycle.
(qin – qout)+ (win – wout) = hc = ht
Wpump.in = h2-h1
ENERGY ANALYSIS OF RANKINE CYCLE
All four components associated with the Rankine cycle (the pump, boiler, turbine, and condenser)are steady-flow devices, and thus all four processes that make up the Rankine cycle can be analysed as steady-flow processes. The kinetic and potential energy changes of the steam are usually small relative to the work and heat transfer terms and are therefore usually neglected. Wpump.in = h2-h1 The boiler and the condenser do not involve any work, and the pump and the turbine are assumed to be isentropic. Then the conservation of energy relation for each device can be expressed as follows: Wpump.in = v (p2-p1) Qin = h3 – h2 Wturb.out = h3 = h4 qout = h4=h1 The thermal efficiency of the Rankine cycle is determined from
|
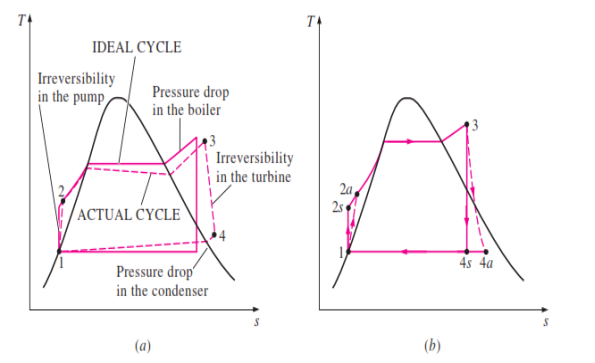
DEVIATION OF ACTUAL CYCLE FROM IDEAL CYCLE
|
Fig 3
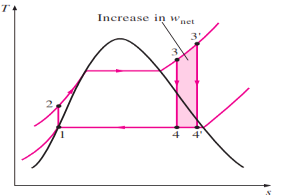
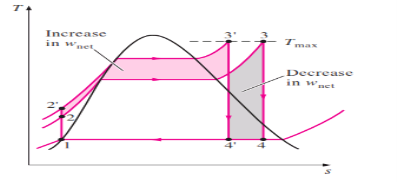
Increasing Efficiency of Rankine Cycle
The Various steps to increase the efficiency of Rankine Cycle are as follows:
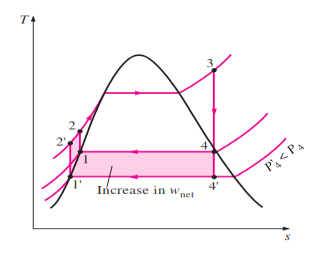
1. Lowering the Condenser Pressure
|
Fig 4
The effect of lowering the condenser pressure on the ideal Rankine cycle
2. Superheating the Steam to High Temperatures
|
Fig 5
The effect of superheating the steam to higher temperatures on the ideal Rankine cycle
3. Increasing the Boiler Pressure
|
Fig 6
The effect of increasing the boiler pressure on the ideal Rankine cycle
COMBINED GAS VAPOUR POWER CYCLE
The continued quest for higher thermal efficiencies has resulted in rather innovative modifications to conventional power plants. The binary vapor cycle discussed later is one such modification. A more popular modification involves a gas power cycle topping a vapor power cycle, which is called the combined gas–vapor cycle, or just the combined cycle. The combined cycle of greatest interest is the gas-turbine (Brayton) cycle topping a steam turbine
(Rankine) cycle, which has a higher thermal efficiency than either of the cycles executed individually. Gas-turbine cycles typically operate at considerably higher temperatures than steam cycles. The maximum fluid temperature at the turbine inlet is about 620°C (1150°F) for modern steam power plants, but over 1425°C (2600°F) for gas-turbine power plants. It is over 1500°C at the burner exit of turbojet engines. The use of higher temperatures in gas turbines is made
possible by recent developments in cooling the turbine blades and coating the blades with high-temperature-resistant materials such as ceramics. Because of the higher average temperature at which heat is supplied, gas-turbine cycles have a greater potential for higher thermal efficiencies. However, the gas-turbine cycles have one inherent
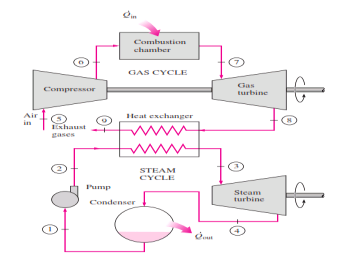
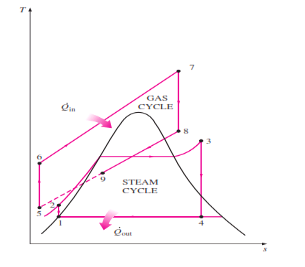
Disadvantage: The gas leaves the gas turbine at very high temperatures (usually above 500°C), which erases any potential gains in the thermal efficiency. The situation can be improved somewhat by using regeneration, but the improvement is limited. It makes engineering sense to take advantage of the very desirable characteristics of the gas-turbine cycle at high temperatures and to use the high temperature exhaust gases as the energy source for the bottoming cycle such as a steam power cycle. The result is a combined gas–steam cycle, as shown
|
Fig 7 Combined gas–steam power plant
In this cycle, energy is recovered from the exhaust gases by transferring it to the steam in a heat exchanger that serves as the boiler. In general, more than one gas turbine is needed to supply sufficient heat to the steam. Also, the steam cycle may involve regeneration as well as reheating. Energy for the reheating process can be supplied by burning some additional fuel in the oxygen-rich exhaust gases. Recent developments in gas-turbine technology have made the combined gas–steam cycle economically very attractive. The combined cycle increases the efficiency without increasing the initial cost greatly. Consequently, many new power plants operate on combined cycles, and many more existing steam- or gas-turbine plants are being converted to combined-cycle power plants. Thermal efficiencies well over 40 percent are reported as a result of conversion.
|
Fig 8
The ideal cycle for vapor power
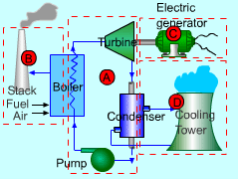
Vapor power plants generate electrical power by using fuels like coal, oil or natural gas. The schematic of a vapor power plant is shown on the left. The entire power plant can be broken down into four major subsystems.
- Subsystem A: Energy conversion from heat to work
- Subsystem B: Energy source and waste removal required to vaporize the water
- Subsystem C: Electric generator
- Subsystem D: Cooling water system
The focus of this chapter is subsystem A. The thermodynamic cycle in subsystem A is called the Rankine cycle. Subsystem A consists of a boiler, turbine, condenser and a pump. Fuel, burned in the boiler, heats the water to generate superheated steam (subsystem B). This steam is used to run the turbine which powers the generator. Electrical energy is generated when the generator windings rotate in a strong magnetic field (subsystem C). After the steam leaves the turbine, it is cooled to its liquid state in the condenser by transferring heat to the cooling water system (subsystem D). The liquid is pressurized by the pump prior to going back to the boiler.
|
Fig 9 Schematic of a Vapor Power Plant
All four components associated with the ideal Rankine cycle are steady-flow devices, and thus all four processes that make up the Rankine cycle can be analysed as steady-flow process. The kinetic and potential energy changes of water are small relative to the heat and work terms, are thus neglected. Energy analysis of the four components is given below.
|
Fig 10 Schematic of the Rankine Cycle
Pump (process 1-2): Pump pressurized the liquid water from the condenser prior to going back to the boiler. Assuming no heat transfer with the surroundings, the energy balance in the pump is wpump, in = h2 - h1 Boiler (process 2-3): Liquid water enters the boiler and is heated to superheated state in the boiler. The energy balance in the boiler is qin = h3 - h2 Turbine (process 3-4): Steam from the boiler, which has an elevated temperature and pressure, expands through the turbine to produce work and then is discharged to the condenser with relatively low pressure. Neglecting heat transfer with the surroundings, the energy balance in the turbine is wturbine, out = h3 - h4 Condenser (process 4-1): Steam from the turbine is condensed to liquid water in the condenser. The energy balance in the condenser is qout = h4 - h1 For the whole cycle, the energy balance can be obtained by summarizing the four energy equations above. It yields, (qin- qout) - (wturbine, out - wpump, in) = 0 The thermal efficiency of the Rankine cycle is determined from ηth = wnet ,out/qin = 1 - qout/qin Where the net work output from the cycle is wnet, out = wturbine, out - wpump, in
|
Fig 11 T-s Diagram of an Ideal Rankine Cycle
The Rankine cycle is an ideal cycle if water passes through the four components without irreversibilities and pressure drops. The ideal Rankine cycle consists of the following four processes, as shown on the T-s diagram on the left:
- 1-2: Isentropic compression in a pump
- 2-3: Constant pressure heat addition in a boiler
- 3-4: Isentropic expansion in a turbine
- 4-1: Constant pressure heat rejection in a condenser
Ideal Reheat cycle
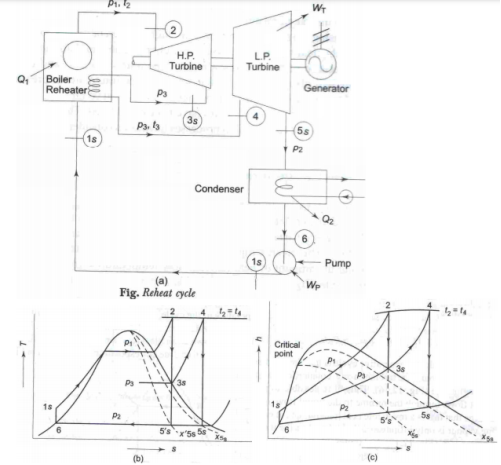
We know that, the efficiency of the Rankine cycle could be increased by increasing steam pressure in the boiler and superheating the steam. But this increases the moisture content of the steam in the lower pressure stages in the turbine, which may lead to erosion of the turbine blade. ∴The reheat cycle has been developed to take advantage of the increased pressure of the boiler, avoiding the excessive moisture of the steam in the low pressure stages. In the reheat cycle, steam after partial expansion in the turbine is brought back to the boiler, reheated by combustion gases and then fed back to the turbine for further expansion.
|
Fig 12
In the reheat cycle the expansion of steam from the initial state (2) to the condenser pressure is carried out in two or more steps, depending upon the number of reheats used. In the first step, steam expands in HP turbine from state 2 to approximate the saturated vapour line (process 2-3s). The steam is then reheated (or resuperheated) at constant pressure in the boiler (or in a reheater) process 3s-4 and the remaining expansion process 4s-5 is carried out in the LP turbine.
Note: 1) To protect the reheater tubes, steam is not allowed to expand deep into the two-phase region before it is taken for reheating, because in that case the moisture particles in steam while evaporating would leave behind solid deposits in the form of scale which is difficult to remove. Also a low reheat pressure may bring down Tm1 and hence cycle η.
Again a high reheat pressure increases the moisture content at turbine exhaust. Thus reheat pressure is optimized. Optimum reheat pressure is about 0.2 to 0.25 of initial pressure. We have for 1 kg of steam QH = (h2 – h1S) + (h4 – h3S); QL = h5S – h6 WT = (h2 – h3S) + (h4 – h5S); WP = h1S – h6 ηR = (WT-WP)/ QH Steam rate 3600/ (WT-WP) kg/kwh Since higher reheat pressure is used, WP work is appreciable.
|
2) In practice, the use of reheat gives a marginal increase in cycle η, but it increases the net work output by making possible the use of higher pressures, keeping the quality of steam at turbine exhaust within a permissible limit. The quality improves from x5’s to x5S by the use of reheat.
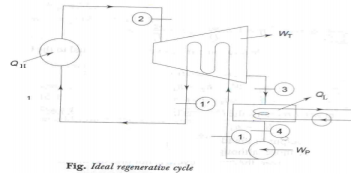
Ideal Regenerative cycle:
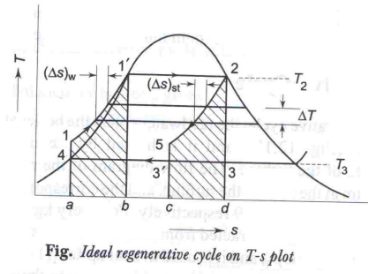
The mean temperature of heat addition can also be increased by decreasing the amount of heat added at low temperatures. In a simple Rankine cycle (saturated steam entering the turbine) a considerable part of the total heat supplied is in the liquid phase when heating up water from 1 to 11, at a temperature lower than T2, the maximum temperature of the cycle. For maximum η, all heat should be supplied at T2, and feed water should enter the boiler at 11. This may be accomplished in what is known as an ideal regenerative cycle as shown in figures (a) and (b).
|
Fig 13
|
Fig 14
∆T (water) = - ∆T (steam)
The unique feature of the ideal regenerative cycle is that the condensate, after leaving the pump circulates around the turbine casing, counter-flow to the direction of vapour flow in the turbine. Thus it is possible to transfer heat from the vapour as it flows through the turbine to the liquid flowing around the turbine. Let us assume that this is a reversible heat transfer i.e., at each point, the temperature of the vapour is only infinitesimally higher than the temperature of the liquid. ∴The process 2-31 represents reversible expansion of steam in the turbine with reversible heat rejection. i.e., for any small step in the process of heating the water ∆T (water) = - ∆T (steam) and (∆S) water = (∆S) steam. Then the slopes of lines 2-31 and 11 -4 will be identical at every temperature and the lines will be identical in contour. Areas 1-11 -b-a-1 and 31 -2-d-c-31 are not only equal but congruous. ∴, all heat added from external source (QH) is at constant temperature T2 and all heat rejected (QL) is at constant temperature T3, both being reversible.
Then QH = h2 – h1 1 = T2 (S2 – S1 1 ) QL = h31 – h4 = T3 (S31 –S4) Since S11 – S4 = S2 – S3 1 or S2 – S11 = S31 – S4 η Re,g 1- QL/QH= 1− T3/T2 i.e., the η of ideal regenerative cycle is thus equal to the Carnot cycle η. Writing SFEE to turbine, h2 + h1 = WT + h11 + h31 i.e., WT = (h2 – h31) – (h11 – h1) And the WP is same as simple rankine cycle i.e., WP = (h1 – h4)
|
The net work output of the ideal regenerative cycle is less and hence its steam rate will be more. Although it is more efficient when compared to rankine cycle, this cycle is not practicable for the following reasons.
1) Reversible heat transfer cannot be obtained in finite time.
2) Heat exchanger in the turbine is mechanically impracticable.
3)The moisture content of the steam in the turbine is high.
The First Law analysis of power cycles determine, from the specific enthalpies of the working substance at the various key points of the cycles, the mass flow of the working substance, the heat flow and the flow of the rotary shaft output work for each piece of equipment. The Second Law analysis is an effective method for the establishment of the ideal power cycle and the maximum work output. Also it pinpoints the thermodynamic penalty which results from the individual departure from the ideal cycle. In the Second Law analysis of gas power cycles the intention is to include the scope of the First Law analysis and in addition to transcend it so that the flows of available and unavailable energies are evaluated and the creation of entropies by irreversible processes with the resultant available energy degraded is determined.
The Second Law analysis of the basic gas power cycle can be summarized by the concept of the Law of conservation of mass and energy of the First Law analysis and the following statements:
(1) Available energy is measured by the rotary shaft work output and is wholly available.
(2) Heat flow is composed of an available and an unavailable part, Q = A + U.
(3) Entropy cannot be destroyed but is created by the irreversibilities of fluid friction or finite temperature difference in the heat transfer processes.
(4) The increase in entropy of the universe equals the creation of entropy. SUniv = Screat
(5) The available energy cannot be created but is destroyed through the creation of entropy.
(6) Unavailable energy cannot be destroyed but is created by the creation of entropy.
(7) The destruction of available energy is the available energy that has been degraded by irreversibilities: it equals the creation of unavailable energy, and the flux of available energy of the heat supplied minus the rotary shaft work output:
∑(AD) = Ucreat = (A)Q s - Wout
(8) The increase in unavailable energy of the universe equals the unavailable energy created, degradation of available energy and the increase of the unavailable energy of the atmosphere minus the unavailable energy of the heat supplied:
∆UUniv=Ucreat= ∑(AD)Uatmos - UQ s
(9) The theoretical maximum work output from the cycle in excess of the actual rotary shaft work output is equal to the destruction of available energy and the increase in unavailable energy of the Universe
∆W = Wout,ideal – Wout = ∆(AD) = ∆UUniv To ∆SUniv
|
ANALYSIS
The Second Law analysis of gas power cycles is demonstrated by means of numerical examples given in Appendix at the end of this paper. In these examples Air Standard Cycle (Carnot or Brayton) is an ideal Standard and is a criterion for the maximum shaft work output, specifically it will be shown that: 1) Departures from the ideal standard such as finite temperature differences in the heat transfer process and fluid friction in the processes will create entropy and that will cause the entropy increase of the Universe ∆SUniv = (Sf + S∆t,Q ) (2) Such departures require that the rotary shaft work output to be lesser than that of ideal maximum: ∆W = Wout, ideal - Wout (3) This decrease of work output from ideal maximum equals the product of absolute temperature of the atmosphere and the increase of entropy of the universe (TO ∆SUniv ) and is also equal to the sum of all the available energy degraded by the irreversibilities produced through finite temperature difference in the heat transfer process and the fluid friction : ∆W=To (∆SUniv) = ∑ (AD)=( AD) f +(AD) ∆t, Q |
An important application of thermodynamics is the analysis of power cycles through which the energy absorbed as heat can be continuously converted into mechanical work. A thermodynamic analysis of the heat engine cycles provides valuable information regarding the design of new cycles or for improving the existing cycles.
Classification of Cycles: The purpose of a thermodynamic cycle is either to produce power, or to produce refrigeration/pumping of heat. Therefore, the cycles are broadly classified as follows:
(a) Heat engine or power cycles.
(b) Refrigeration/heat pump cycles.
Any thermodynamic cycle is essentially a closed cycle in which, the working substance undergoes a series of processes and is always brought back to the initial state. However, some of the power cycles operate on open cycle. It means that the working substance is taken into the unit from the atmosphere at one end and is discharged into the atmosphere after undergoing a series of processes at the other end.
The following are illustrations of heat engines operating on open cycle:
(i) Petrol and diesel engines in which the air and fuel are taken into the engine from a fuel tank and products of combustion are exhausted into the atmosphere.
(ii) Steam locomotives in which the water is taken in the boiler from a tank and steam is exhausted into the atmosphere. However, they can be analysed by adding an imaginary processes to bring the state of the working substance, thus completing a cyclic.
Note that the terms closed cycle and open cycle used here does not mean closed system cycle and open system cycle. In fact, the processes both in closed and open cycles could either be closed or open system processes. Different types of working fluids are employed in the power plants. The nature of the working fluids can be classified into two groups: vapours and gases.
The power cycles are accordingly classified into two groups as:
(1) Vapour power cycles in which the working fluid undergoes a phase change during the cyclic process.
(2) Gas power cycles in which the working fluid does not undergo any phase change.
In the thermodynamic analysis of power cycles, our chief interest lies in estimating the energy conversion efficiency or the thermal efficiency. The thermal efficiency of a heat engine is defined as the ratio of the network delivered to the energy absorbed as heat. Analysis of Cycles: In air standard analysis, air is considered as the working medium.
The analysis is carried out with the following assumptions.
Assumptions:
(i) The working substance consists of a fixed mass of air and behaves as a perfect gas. The closed system is considered which under goes a cycle process. Therefore, there is no intake or exhaust process.
(ii) The combustion process is replaced by an equivalent heat addition process form an external source. Thus there is no change in the chemical equilibrium of the working fluid and also composition.
(iii) There is no exhaust process; this is replaced by an equivalent heat rejection process.
(iv) Compression and expansion processes in the cycle are considered as reversible adiabatic process.
(v) The specific heats Cp and Cv of air do not vary with temperature.
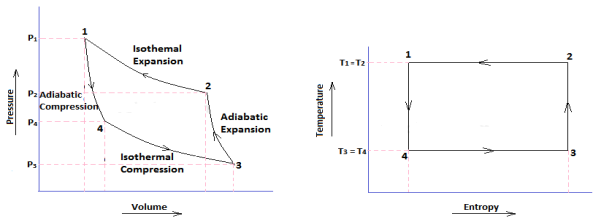
CARNOT CYCLE: In a Carnot cycle, the working substance is subjected to a cyclic operation consisting of two isothermal and two adiabatic processes. The engine developed by Carnot has air (which is assumed to work as a perfect gas) as its working substance enclosed in a cylinder, in which a frictionless piston moves.
|
Fig 15 P-V and T-S Diagram of a Carnot
Carnot Cycle Processes
- Isothermal Expansion
- Adiabatic or Isentropic Expansion
- Isothermal Compression
- Isentropic Compression
Process 1-2 (Isothermal Expansion)
Heat supplied = Work done during isothermal expansion H1= p1v1 ln (v2/v1) = m R T1 ln (v2/v1) Process 2-3 (Adiabatic or Isentropic Expansion)
Work done = W 2-3 = mcv (T1-T2) Process 3-4 (Isothermal Compression)
Hear rejected = Work done on the air W3-4 =-p3v3 ln (v3/v4) = -m R T2 ln (v3/v4) Process 4-1 (Isentropic Compression)
Increases in internal energy = Work done on the air W4-1 = -m cv (T1-T2)
We know that efficiency =work done/ heat supply η= W/Q1
Net work per cycle = area 1-2-3-4 W = m R T1 ln (v2/v1) + mcv (T1-T2) -m R T2 ln (v3/v4) -m cv (T1-T2) W = m R T1 ln (v2/v1) -m R T2 ln (v3/v4)
Heat supply = work done + change in internal energy Q = W1-2 +U2-U1
There is no change in internal energy U1=U2
Q=W1-2 = m R T1 ln (v2/v1)
η= W / Q1 = m R T1 ln (v2/v1) -m R T2 ln (v3/v4) / m R T1 ln (v2/v1)
= T1 ln (v2/v1) - T2 ln (v3/v4) / T1 ln (v2/v1) We know that (v2/v1) = (v3/v4)
eliminate these terms We get η= W / Q1 = T1 - T2 / T1 η= 1- T2 / T1
|
Key takeaways
H1= p1v1 ln (v2/v1) = m R T1 ln (v2/v1) 2. Hear rejected = Work done on the air W3-4 =-p3v3 ln (v3/v4)= -m R T2 ln (v3/v4) 3. η= 1- T2 / T1 |
Air Standard Assumptions
In power engines, energy is provided by burning fuel within the system boundaries, i.e. internal combustion engines. The following assumptions are commonly known as the air standard assumptions:
1- The working fluid is air, which continuously circulates in a closed loop (cycle).
Air is considered as ideal gas.
2- All the processes in (ideal) power cycles are internally reversible.
3- Combustion process is modeled by a heat-addition process from an external source.
4- The exhaust process is modeled by a heat-rejection process that restores the
Working fluid (air) at its initial state
Assuming constant specific heats for air, is called cold-air-standard
Assumption
Some Definitions for Reciprocation Engines:
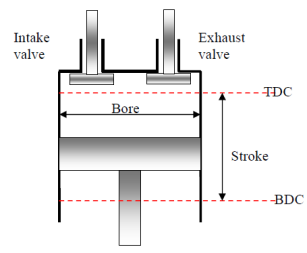
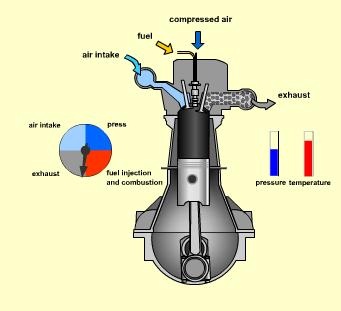
The reciprocation engine is one the most common machines that is being used in a wide variety of applications from automobiles to aircrafts to ships, etc.
|
Fig. 16: Reciprocation engine.
Top dead center (TDC): The position of the piston when it forms the smallest volume in the cylinder.
Bottom dead center (BDC): The position of the piston when it forms the largest volume in the cylinder.
Stroke: The largest distance that piston travels in one direction.
Bore: The diameter of the piston.
Clearance volume: The minimum volume formed in the cylinder when the piston is at TDC.
Displacement volume: The volume displaced by the piston as it moves between the TDC and BDC.
Compression ratio: The ratio of maximum to minimum (clearance) volumes in the
Cylinder:

Mean effective pressure (MEP): A fictitious (constant throughout the cycle) pressure that if acted on the piston will produce the work.
Wnet = MEP x APiston x Stroke = MEP x Displacement vol.

An engine with higher MEP will produce larger net output work.
Internal Combustion Engines
1. Spark ignition engines:
- a mixture of fuel and air is ignited by a spark plug
- applications requiring power to about 225 kW (300 HP)
- relatively light and low in cost
2. Compression ignition engine:
- air is compressed to a high enough pressure and temperature that
Combustion occurs when the fuel is injected
- applications where fuel economy and relatively large amounts of power
are required
Spark‐Ignition (Gasoline) Engine
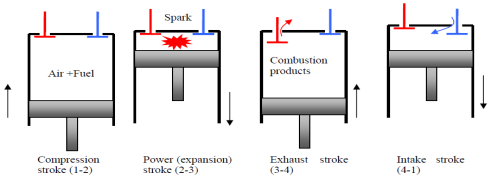
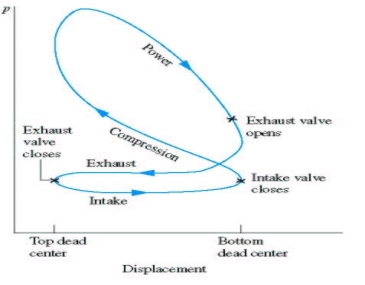
|
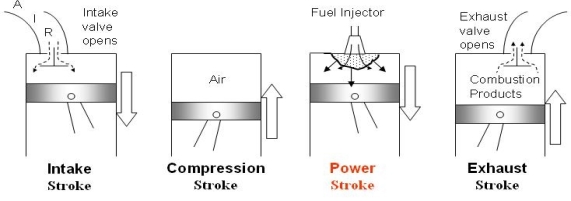
Fig. 17: Actual cycle for spark-ignition engines, four-stroke
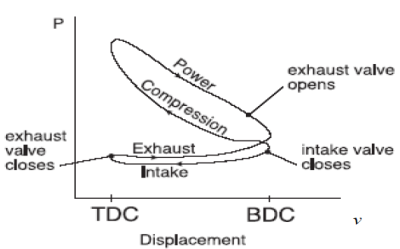
|
Fig. 18 : P-v diagram for spark-ignition engines
Otto Cycle
The Otto cycle is the ideal cycle for spark-ignition reciprocating engines. It serves as the theoretical model for the gasoline engine:
- Consists of four internally reversible processes
- Heat is transferred to the working fluid at constant volume
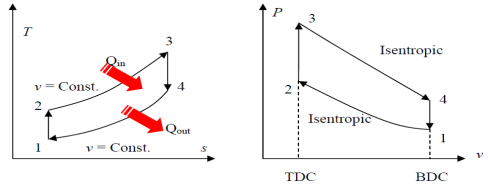
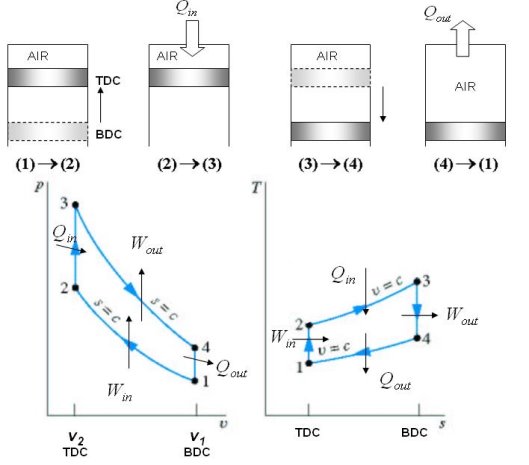
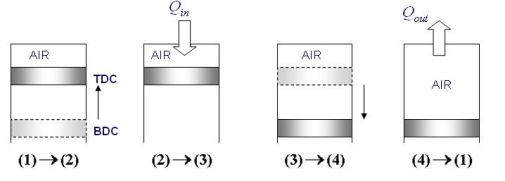
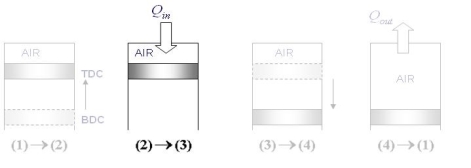
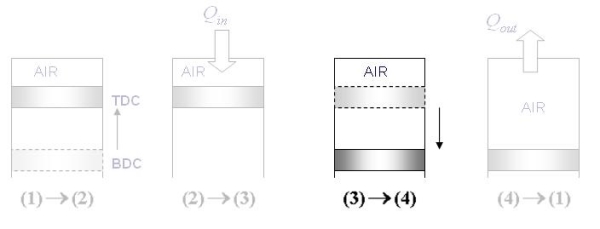
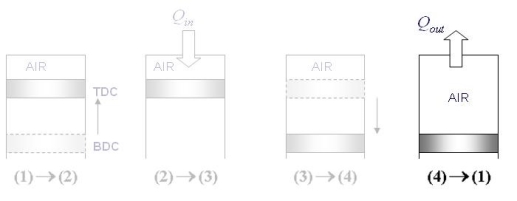
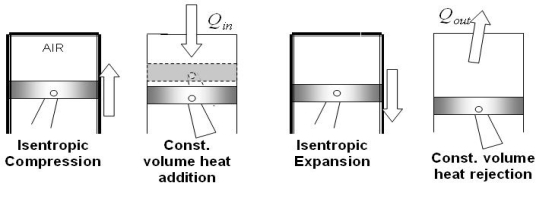
The Otto cycle consists of four internally reversible processes in series:
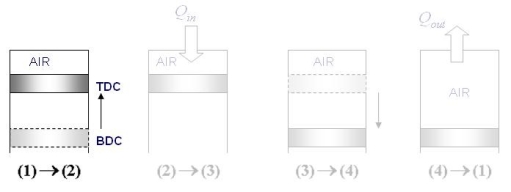
1-2 isentropic compression
2-3 Constant-volume heat addition
3-4 isentropic expansion
4-1 Constant-volume heat rejection
|
Fig. 19: T-s and P-v diagrams for Otto cycle.
The Otto cycle is executed in a closed system. Neglecting the changes in potential and kinetic energies, the 1st law, on a unit mass base, can be written:
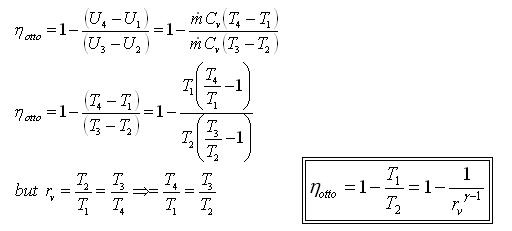
Thermal efficiency can be written
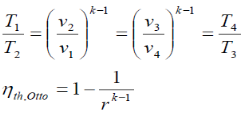
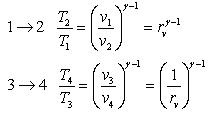
Processes 1-2 and 3-4 are isentropic, and v2 = v3 and v4 = v1. Thus,
Where r is called the compression ratio
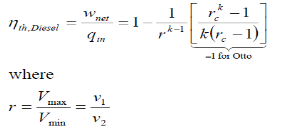
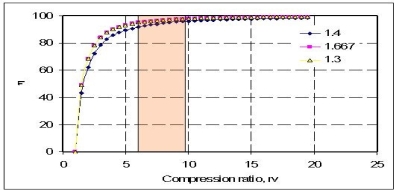
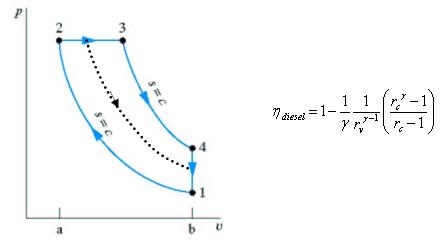
Typical compression ratios for spark-ignition engines are between 7 and 10. The thermal efficiency increases as the compression ratio is increased. However, high compression ratios can lead to auto ignition or engine knock Diesel Engine The Diesel cycle is the ideal cycle for compression ignition engines. It is very similar to spark-ignition, expect the method of ignition. In diesel engine, air compressed to a temperature that is above the ignition temperature of the fuel
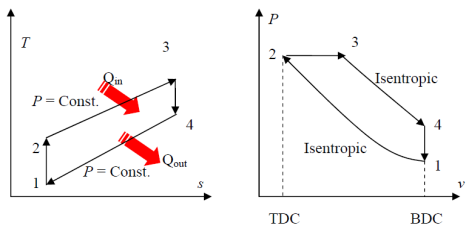
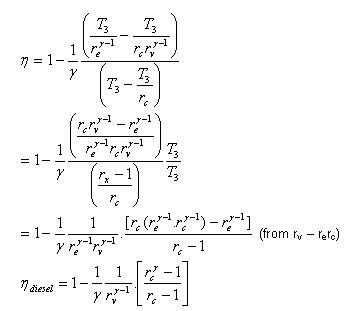
Fig. 20: T-s and P-v diagram of Diesel engine. The thermal efficiency of the Diesel engine under the cold air standard assumptions becomes:
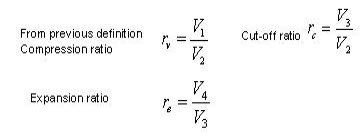
We also define the cut off ratio rc, as the ratio of cylinder volumes after and before the combustion process (ignition period):
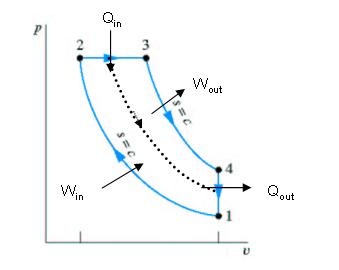
Comparison of the Otto and the Diesel Cycle
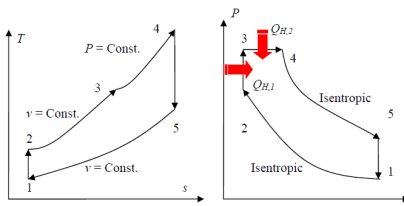
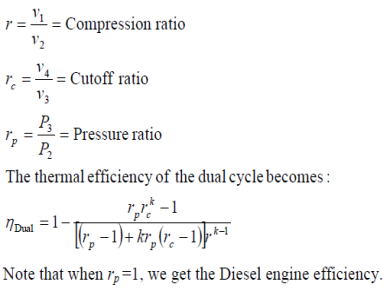
Dual Cycle (Limited Pressure Cycle)
Combustion process in internal combustion engines either as constant-volume (Otto cycle) or constant-pressure (Diesel cycle) heat addition is overly simplified and it is not realistic.
Fig. 21: T-s and P-v diagrams for an ideal dual cycle.
|
Assumptions for Air standard cycle, as describe before: 1) Fixed amount of air (ideal gas) for working fluid 2) Combustion process replaced by constant volume heat addition with piston at TDC 3) Intake and exhaust not considered, cycle completed with constant volume heat removal with piston at BDC 4) All processes considered internally reversible Air-Standard Otto cycle
Otto Cycle- indicator diagram of Otto cycle
Otto, P-V and T-S diagram
Fig 24 Compression ratio Fig 25
Applying First law: U2-U1 = Q - Win
Fig 27 Applying First law: U3-U2 = +Qin - W 3-4 Isentropic Expansion Fig 28 Applying First law: U4-U3 = Q - Wout 4-1 Constant volume heat removal
Fig 29
The thermal efficiency is given by:
The specific heats are assumed to be constant. Here y=1.4 at ambient temperature For higher efficiency, higher compression ratios are required, as shown below. However, increase in pressure ratios, would increase the air-fuel temperature above the temperature at which the mixture can auto-ignite. This would result in 'engine-knock', reducing the performance of the engine. In order to avoid such situations, additives are generally added which increases the auto-ignition temperature.
Fig 30
Fig 31
Cycle consists of four distinct strokes (processes) as in the case of SI engines, except that the spark plug is replaced by a fuel injector
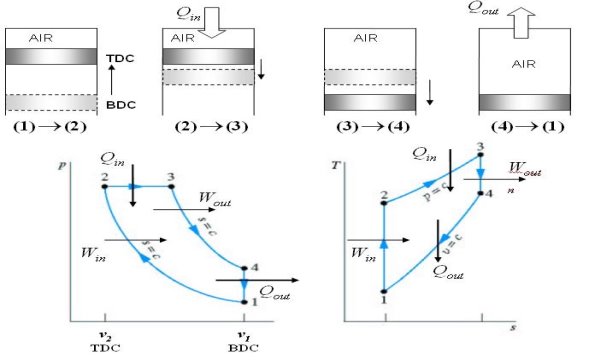
Fig 32 Here the fuel is injected when the piston approaches TDC, ie when the air is at maximum temperature due to compression. The combustion process starts now The fuel is injected after the piston starts moving down the volume increases, on the other hand, the fuel evaporates to fill the volume. Thus keeping the pressure inside roughly the same. Hence the combustion can be considered to occur at constant pressure.
|
Fig 33 Assumptions for Air standard cycle, as describe before: Air-Standard Otto cycle Diesel T-S and P-V diagram
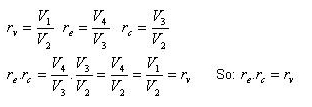
Fig 34 Three Volume Ratios
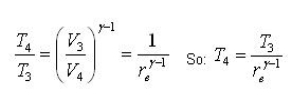
Thermal Efficiency of Diesel Cycle
Fig 35 Given: Process 1-2: Isentropic compression
However a smaller rc yields less net work per cycle, so to achieve the same power at lower rc values higher engine speeds are required.
|
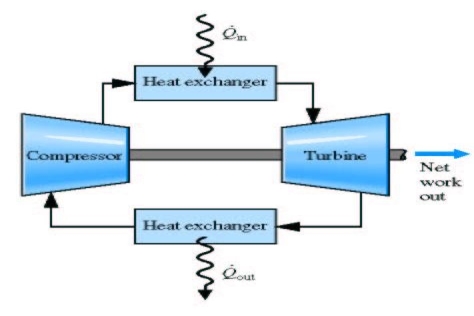
- Brayton cycle is the air standard for GT power plant.
- Air is first compressed reversibly and adiabatically
- Heat is added to it reversibly at constant pressure
- Air expands reversibly, adiabatically in the turbine
- The heat is removed from the system reversibly at constant pressure to bring it to original state
|
Fig 37
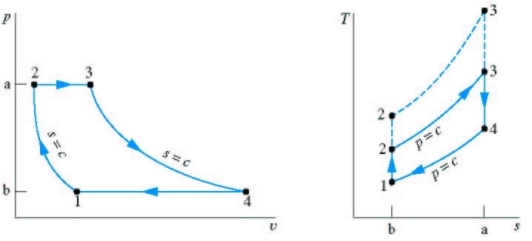
Brayton cycle therefore consists of two isobars and two reversible adiabatic (isentropic):
Air is first compressed reversibly and adiabatically
Heat is added to it reversibly at constant pressure
Air expands reversibly, adiabatically in the turbine the heat is removed from the system reversibly at constant pressure to bring it to original state
P-V, T-S diagram of ideal Brayton Cycle
|
Fig 38
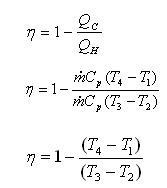
1 - 2 isentropic compression Thermal efficiency:
Since processes 1-2 & 3-4 are isentropic between the same pressures :- Where rv is the pressure ratio Hence, substituting in the efficiency expression
This is the efficiency for ideal Joule/Brayton Cycle. Work Ratio It may easily be shown from the expression,
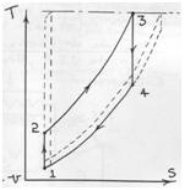
And a similar approach to that above, that work ratio We also know that a high work ratio is desirable in order to minimize the effect of irreversibilities in real gas turbines. This depends on the temperature limits and the pressure ratio for constant gamma. Consider the T-S diagram below for the ideal cycle & the dotted cycles.
|
T3 is usually fixed by metallurgical limits on turbine blading & T1 is the natural sink temperature for an ideal cooler. The two dotted cycles show the limits of operation. Consider left hand dotted cycle. Here the pressure ratio is large & the cycle efficiency approaches the Carnot Efficiency ie T2 has been raised. Unfortunately the net work output is approaching zero. The other dotted cycle has a reduced T2 & again net work output is approaching zero. It can be shown that for an ideal cycle with fixed T1 and T3, the value of T2 for maximum work output is: 
Irreversibilities and isentropic efficiencies
We shall only consider the effect of irreversibilities upon compression and expansion processes. Irreversibilities in heaters and coolers who up as pressure drops and are not considered here.
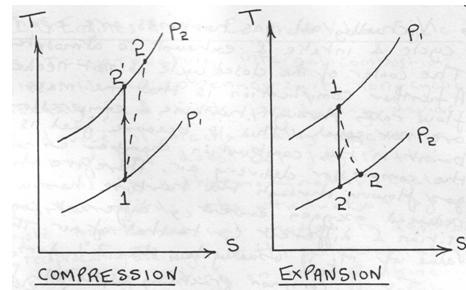
The two T-S diagrams show the effect on compression and expansion processes in general from state 1 to state 2. These are analogous to the similar diagrams for the Rankine cycle except that they are processes of a perfect gas. Then for the steady flow compression process:-
|
Fig 40
For the steady flow compression process
|
For the steady flow expansion process:
|
Note that Celsius temperatures may also be used in these expressions.
Reference:
- Engineering thermodynamics
- ASHRAE, Air Conditioning System Design Manual, IInd edition, ASHRAE.
- Thermodynamics P.K Nag
- Threlkeld J.L., Thermal Environmental Engineering, Prentice Hall Inc. New Delhi
