Module III
Noise
Sound is said to be produced in the environment by alternating pressure changes in the surrounding air. These alternating pressure changes produced in the air are known as alternating compression & rarefaction which further produces sound waves. These sound waves travel in a sinusoidal path.
Any unwanted or displeasing human or machine sound that disrupts quality of life is known as Noise. It produces undesirable psychological and physiological effects in an individual by interfering with one’s social activities like work, sleep, rest and recreation.
Noise of very high intensity and duration, known as Noise Pollution can not only impair our hearing abilities but can also hinder our concentration and work efficiency. It can cause stress and even accidents.
Causes of Noise Pollution
- Industrialization
- Poor Urban Planning
- Social Events
- Road & Air Transportation
- Construction Activities
Effects of Noise Pollution
- General annoyance & irritation
- Headaches
- Insomnia
- Fatigue
- Nausea
- High Blood Pressure
- High Pulse Rate
Characteristics of Sound
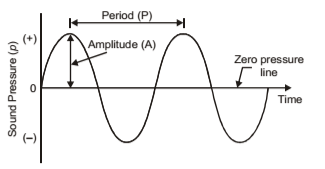
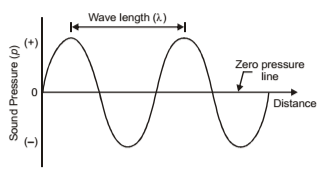
As discussed above, sound is said to be produced when alternating compression and rarefaction is produced in the surrounding air molecules. This sound produced travels in the form of waves in a sinusoidal path, as shown below in Figures 1 & 2.

Figure 1: Period (P)
Figure 1 depicts the time period between two consecutive troughs or peaks of oscillations. This is marked as Period (P) in the figure. The inverse of this period gives the frequency of oscillations (f) i.e., the number of times a peak (or a trough) is produced in one second.
Mathematically, 

Figure 2: Wavelength ()
Figure 2 gives the distance between two consecutive troughs or peaks of oscillations. This is known as Wavelength () as shown in the figure. A mathematical relation between wavelength & frequency of observations is given as follows:


Where, C is the proportionality constant, known as the velocity of sound wave.
Important Terminology
Amplitude (A) – It is the height of the peak sound pressure measured above or below the zero pressure line. It is depicted as the height of each peak or depth of each trough. It is the maximum displacement of vibrating particles of the medium from their mean position when the sound is produced.
The pressure equivalent of such a sine wave is represented by root mean square pressure  as
as

Where,  = pressure at any time t
Power of Sound (W) – It is the rate of work done by a travelling sound wave in the direction of wave propagation. This rate of work done is energy. Hence, the energy transmitted by a sound wave in the direction of its propagation is defined as the Power of Sound and it is represented in watts.
Sound Intensity (I) – It is the power of sound averaged over time per unit area perpendicular to the direction of propagation of sound wave.
Mathematically, 
Where, I = Intensity of sound wave in watt/m2
W = Power of sound wave in watts
a = Unit area perpendicular to direction of wave motion
Further, sound intensity is also related to root mean square pressure  as per the following equation:

Where, I = Intensity of sound wave in watt/m2
 = root mean square pressure in Pascal
= density of air or any other medium in which the sound wave is travelling in kg/m3
C = velocity of sound wave in m/s
Unit of Measurement of Sound
The human ear is a versatile hearing device. It has a built-in mechanism to reduce its own sensitivity as the sound level rises and can handle an enormous range of sound power levels. This is why we can hear the sound of a pin dropping close-by as well as the roar of a jet engine far away.
Sound pressure of the faintest sound that can be heard by a normal healthy individual is about 20 micro-pascal (µPa) and loudest sound produced by a Saturn rocket at the lift off stage is about 200 Pa.
Sound is measured in terms of Sound Pressure Level (SPL) and expressed in decibel (dB). The decibel (dB) is a unit used to express the ratio of two values of a physical quantity, often power or intensity.
Note: One ‘decibel’ is one-tenth of one ‘bel’. The term ‘bel’ was coined in the honour of Alexander Graham Bell. This unit ‘bel’ is seldom used.
Sound level (L) is represented as
 (bels)
Where, Q = measured quantity of sound pressure, or sound level, or sound intensity
Qo = reference standard quantity of sound pressure, or sound level, or sound intensity
L = sound level in bels
When sound level is expressed in decibels, the above equation becomes
 (dB)
(dB)
In terms of Sound Pressure (Qo = 20 µPa)


In terms of Power (Qo = 10-12 Watts)

In terms of Intensity (Qo = 10-12 Watt/m2)

Types of Sound
- Continuous Noise – It is an uninterrupted sound level which varies less than 5 dB during the entire period of observation. e.g. Running fan
- Intermittent Noise – It is a noise that continues for more than 1 second and is then interrupted for more than 1 second. e.g. Drilling machine used by a dentist
- Impulse Noise – It is characterised by a change in sound pressure of at least 40 dB within 0.5 second and duration less than 1 second. e.g. Firing of a weapon
Noise Standards
U.S. Environmental Protection Agency has given Noise Standards as tabulated below to show the limiting noise levels for different types of areas that should be maintained to safeguarding public health over long periods.
S. No. | Type of Area | Day (dB) | Night (dB) |
1 | Sensitive | 50 | 40 |
2 | Residential | 55 | 45 |
3 | Commercial | 65 | 55 |
4 | Industrial | 75 | 70 |
Decibel Meter
Sound can be measured with the help of an instrument known as the decibel meter or the sound-level meter. It measures and samples sound. This instrument consists of a microphone which further has a diaphragm. A diaphragm is a transducer intended to interconvert mechanical vibrations to sounds, or vice versa. The diaphragm present in the microphone reacts to the changes in air pressure due to sound waves. Now-a-days, a decibel meter can even be accessed on a smartphone through apps.
Decibel Scale
It is now known that the human ear has the ability to handle a vast range of different sound levels. Therefore, in order to express sound levels meaningfully in numbers, a logarithmic scale is used rather than a linear one. This scale is called the decibel scale or dB scale.
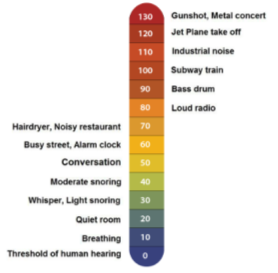
On the decibel scale, the smallest audible sound is 0 dB. A sound 10 times more powerful is 10 dB. A sound 100 times more powerful than near total silence is 20 dB. A sound 1,000 times more powerful than near total silence is 30 dB.
The decibel scale gives the source of sound/noise from 0 dB onwards. A typical decibel scale for some common noises is as shown in Figure 3.

Figure 3: Typical Decibel Scale for Common Sounds
Octave Band
For the purpose of characterization, noise is further broken down into frequency components known as spectra. These frequencies are then divided into various ranges.
An octave band is a frequency band between a given frequency and twice that frequency. For example:
22-44 Hz: First Octave Band
44-88 Hz: Second Octave Band
88-175 Hz: Third Octave Band and so on.
Please note that Hertz (Hz) is a unit of frequency.
Octave Band Analysis is carried out to control large scale community noise by identifying violators.
Addition of Sound Levels
Since sound levels are calculated on log scale, simple arithmetic addition of two or more sound levels is not possible. For example, if we have to add 30 dB and 30 dB of noise levels, we will not get 60 dB of noise but will add up to 33 dB as per the following calculation:
We know that,

Therefore, 
 31.622

Therefore, 30 dB + 30 dB in root mean square value will be
 = 894.427 µPa
Hence, resultant sound pressure level =  = 33 dB
Averaging Sound Pressure Levels
Since sound levels are calculated on log scale, simple averaging of two or more sound levels is not possible. Instead, the following equation is used to compute the average sound pressure levels:

Where,  = average sound pressure level in dB
N = number of measurement readings
 nth sound pressure level in dB
n = 1, 2, 3, . . . . ., n
Noise Rating Systems
- LN Concept
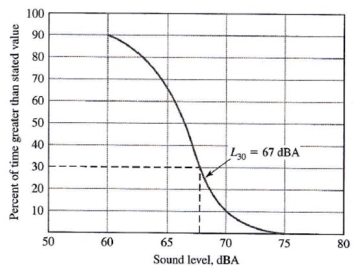
It is a statistical method in which the parameter LN indicates how frequently a particular sound level has been exceeded. The LN value represents the sound pressure level that will exceed for N% of the measuring time. For example, if we have been given a 30dB value of L67, it means that the sound level will exceed 30dB of sound level for 67% of the gauging time.
A cumulative distribution curve is said to be obtained when we plot LN against N values, as shown in Figure 4.

Figure 4: Cumulative Distribution Curve
2. Leq Concept
It is an analytical method in which the parameter Leq is defined as the equivalent noise level, which over a given time, expands the same amount of energy as is expanded by fluctuating levels over the same time.
This value is expressed using the following equation:

Where, Leq = Equivalent noise level
n =Total number of sound levels
Li = Noise level of the ith sample expressed as % of total time
ti = Time period of ith noise level expressed as % of total time
In order to prevent Noise Pollution, some of noise abatement & control techniques are, as follows:
- Legal laws & ordinances about dB levels & timings
- Dampening & Attenuation of some noise levels using good technology and proper town planning
- Education & Awareness
- Construction of wall barriers along roads & railway lines
- Growth of thick & high vegetations to act as noise barriers
Noise reduction is computed using the following equation:

Where, H = height of the barrier wall
R = distance between source & barrier wall
= wavelength of sound
Reference Books:
- Santosh Kumar Garg -“Environmental Engineering (Vol. II) Sewage Waste Disposal and Air Pollution Engineering” – Khanna Publishers
- Dr. K.N. Duggal- “Elements of Environmental Engineering” – S. Chand
Reference YouTube Video Links:
- Https://www.youtube.com/watch?v=Appjj6x3HUU
- Https://www.youtube.com/watch?v=f1O7XrN2zhk