Module VI
Stresses in Soil
Stresses may occur in a soil mass due to the weight of the soil mass above it and due to the external applied loads. In order to design a structure safely, including slope analysis, determination of earth pressures, settlement analysis of foundations etc, we need to study about these stresses in detail.
Various assumptions are made in order to determine the soil stresses. These are, as follows:
- Soil mass is homogenous and isotropic.
- Stress-strain relationship is assumed to be linear.
- The theory of elasticity is used to determine the stresses in the soil, which does not strictly adhere to the conditions at site. Hence, we get approximate results instead of accurate ones. But, since these approximate results can be safely used practically, we make use of this assumption.
The effect of applied loads at any point in a soil mass can be found with the help of two theories:
- Boussinesq’s Theory
Boussinesq gave theoretical solutions for stress distribution in an elastic soil medium subjected to a point load on its surface.
Assumptions:
i) Soil mass is semi-infinite, elastic, homogenous and isotropic.
Ii) The medium obeys Hooke’s Law (stress strain).
Iii) Self-weight of soil is ignored.
Iv) Soil mass is initially unstressed.
v) Change in volume of soil due to applied loads is negligible.
Vi) Top surface of soil is free from shear stresses and is subjected to point load only.
Vii) The stresses are distributed symmetrically.
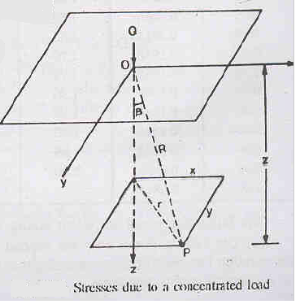
Let us consider a horizontal continuous soil stratum, subjected to a concentrated load Q at point O. Let point O be the origin of the 3-D coordinate system, as can be seen in the figure. The x, y and z axes originate from point O.
As per Boussinesq’s theory,
z = KB  where,
KB =  [
[ 

Here,
z = stress at any point at a distance z vertically below point O and at a radial distance of r in the same plane (say Point P in the figure)
z = vertical distance of Point P from Point O
r = radial distance of Point P from Point O
KB = Boussinesq’s Influence Factor
If in the above equation, Point P lies vertically below Point O i.e. if r = 0, then KB =  = 0.4775 and z = 0.4775
For practical cases, Boussinesq’s equation can be safely applied to field problems at shallow depths. In deep deposits, the modulus of elasticity increases with an increase in depth, thereby limiting the application of this solution.
B. Westergaard’s Theory
Refer to the same figure as shown above.
Assumptions:
i) Soil mass is semi-infinite, elastic, homogenous and anisotropic.
Ii) Material is laterally reinforced with numerous closely spaced particles of negligible thickness. It means that soil is considered rigid in horizontal direction and elastic in vertical direction, and the ratio of elasticity in horizontal direction (EH) to elasticity in vertical direction (EV) is assumed to be infinity i.e.,  = .
= .
As per Westergaard’s theory,
z = KW  where,
KW =  [
[ 

Here,
z = stress at any point at a distance z vertically below point O and at a radial distance of r in the same plane (say Point P in the figure)
z = vertical distance of Point P from Point O
r = radial distance of Point P from Point O
KW = Westergaard’s Influence Factor
If in the above equation, Point P lies vertically below Point O i.e. if r = 0, then KW =  = 0.318 and z = 0.318
Westergaard’s solution closely represents the actual sedimentary deposits and is therefore more realistic than Boussinesq’s solution.
C. Comparison between the Graphs of Boussinesq’s & Westergaard’s Theory
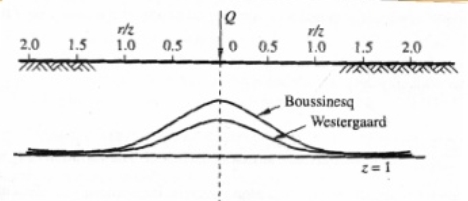
Three important observations can be made from this graph:
- Both graphs meet at
 = 1.5.
 - KW < KB for
 < 1.5.
- KW > KB for
 > 1.5.
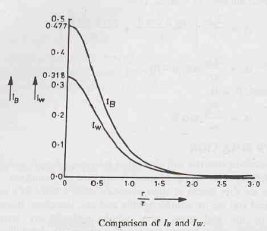
- For
 < 2, KW ≈
  KB
KB
- For
 > 2, KW values are slightly greater.
- Stresses due to Point Load
These are calculated using the Westergaard and Boussinesq solutions, as discussed above.
B. Stresses due to Line Load
Boussinesq’s equation provides a basis for finding stress at any point P due to a concentrated load in an elastic semi-infinite mass. By applying this principle, the stress at any point P due to a line load of infinite extent in the elastic semi-infinite mass can also be calculated.
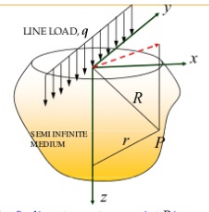
Let us assume a state of stress-plain strain condition such that strain in y-direction parallel to the line load is zero.
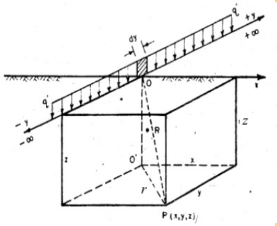
Consider an elementary length ‘dy’ along the line load of intensity q per unit length. Therefore, the load ‘qdy’ can be taken as a concentrated load. Vertical stress Δz at a point due to this load will be
Δz =  [
[ 

 where,
r2 = x2 + y2 (applying pythagorus theorem in the figure above)
Substituting the value of r2 in the equation of Δz and integrating the equation from - to +, we get
z =  [
[ 

C. Stresses due to Strip Load
a) Point P is below the centre of the strip
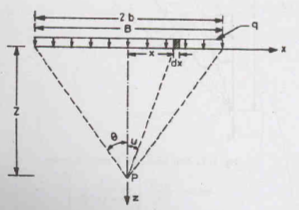
In the figure, we can see a strip load of width B = 2b and intensity q. Let us consider an elementary width ‘dx’ at a distance of x from the centre of the load. Therefore, the load ‘qdx’ can be taken as a concentrated load. Vertical stress Δz at a point due to this load will be
Δz =  [
[ 


Now, x/z = tan u. Therefore, dx = zsec2udu. Substituting these values in the above equation and integrating from 0 to , where = tan-1(b/z), we get
z =  [
[
b) Point P is not below the centre of the strip
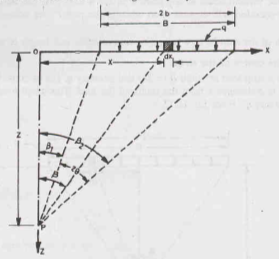
In the figure, we can see a strip load of width B = 2b and intensity q. The extremities of the strip makes angle 1 and 2 at P. Let us consider an elementary width ‘dx’ at a distance of x from Point O. Therefore, the load ‘qdx’ can be taken as a concentrated load. Vertical stress Δz at a point due to this load will be
Δz =  [
[ 


Now, x/z = tan. Therefore, dx = zsec2d. Substituting these values in the above equation and integrating the above equation from 1 to 2, we get
z =  [
[
D. Stresses due to uniformly loaded circular area
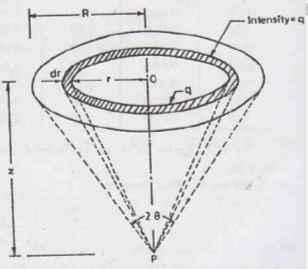
Consider a point P at a depth z below the centre of a uniformly loaded circular area. The load intensity is q per unit area and R is the radius of the circular area. Consider an elementary ring of thickness ‘dr’ at radius ‘r’ from the centre O. Therefore, the load on this elementary ring will be q(2𝝿r)dr. Vertical stress Δz at a point due to this load will be
Δz =  [
[ 


Integrating the above equation from 0 to R, we get
z = q [1 -  ]
]
OR
z = q [1 – cos3] where, cos = 
E. Stresses due to rectangular loaded area
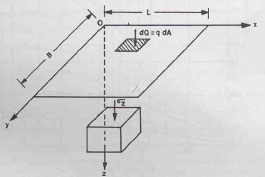
Vertical stress under a corner at depth z, of a rectangular area (B L) with a uniformly distributed load of intensity q can be calculated by taking an elemental rectangular area having side dx and dy.
Therefore, dQ = q dA = q dx dy for an elemental rectangular area having sides dx and dy, as shown by the hatched block in the given figure. Vertical stress Δz at a point due to this load will be
Δz =  [
[ 


By double integrating the equation, first from 0 to B and then from 0 to L, we get
z =  [
[
 + sin-1 (
 )]
)]
Where, m = L/z and n = B/z.
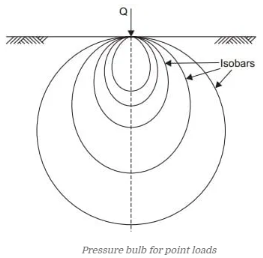
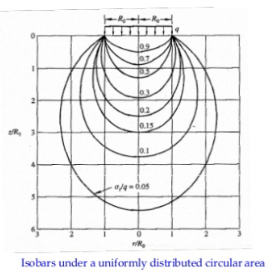
An isobar is a line connecting points below the ground level that are subjected to the same vertical pressure. Am isobar is a curved surface resembling a bulb, since points at the same radial distance from the load have the same value of vertical pressure. For this reason, an isobar is also known as a Pressure Bulb.
Any number of pressure bulbs may be drawn for a single point load since each bulb represents a randomly chosen value of stress. Also, as we move radially outwards, the size of the bulb increases but the pressure value decreases.
Procedure for Plotting an Isobar:
a) Let us plot an isobar of intensity 0.5Q per unit area.
b) Stress distribution is given by the Boussinesq’s formula z = KB 
Taking z = 0.5Q, we get
0.5Q = KB 
Hence, KB = 0.5z2
c) Assuming various values of z, compute the values of KB.
d) We know that, KB =  [
[ 

Using the computed values of KB, find the values of r/z from the above formula.
e) Now, find the value of r for the various assumed values of z in Step (c).
f) We know that an isobar is symmetrical about the line of application of point load. Hence, after plotting the isobar on one side of the z-axis, draw the other half using symmetry.
Newmark’s Influence Charts help to determine the vertical stress at any point under a uniformly loaded area of any shape. It consists of a number of concentric circles and radial lines where each unit area causes equal vertical stress at the centre of the diagram.
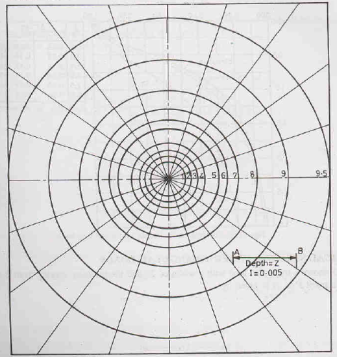
Construction of Newmark’s Influence Chart
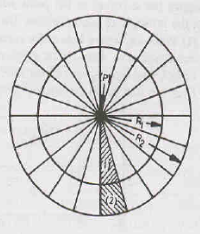
- Typically these charts are based on the determination of vertical stress below the centre of a circular area.
- Consider a uniformly loaded circular area of radius R1 divided into 20 equal sectors.
- Therefore, the load at point P vertically below the centre of the circle at depth z, due to load on one sector (represented as hatched area 1) will be
Z =  q [1 - {
 ]
]
- Let us now give an arbitrary value to Z, say 0.005q. Therefore,
0.005q = =  q [1 - {
 ]
]
Solving the above equation, we get R1/z = 0.270.
This means that every 1/20th sector of a circle of radius R1 = 0.270z will give a vertical stress of 0.005q at the centre.
- Now, let us draw another circle of radius R2 divided into 20 equal sectors, such that each large sector comprises of two sub-sectors. If the small area (represented as hatched area 2) also exerts a pressure of 0.005q at P, the vertical stress due to both the areas (hatched areas 1 and 2) will be 2 0.005q.
Therefore, 2 0.005q = =  q [1 - {
 ]
]
Solving the above equation, we get R2/z = 0.40.
- Similarly, determine the areas of third to ninth circles. It will be observed that the radius of 10th circle tends to infinity and hence it cannot be drawn. Therefore, a Newmark’s Chart consists of only 9
 circles.
Use of Newmark’s Influence Chart
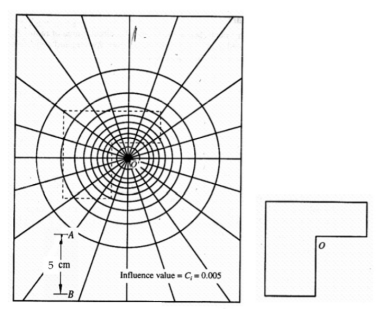
7 A plan of the loaded area is traced on a tracing paper and placed on the Newmark’s Chart in such a way that the point below which stress is required coincides with the centre of the Newmark’s Chart.
8 Scale of the plan is such that the length AB on the Chart corresponds to the depth at which the pressure is required.
9 Let us assume that pressure is required at a depth of 5m below the ground level then, the foundation plan is drawn to a scale of 5cm = 5m i.e. 1cm = 1m.
10 The vertical stress at any point is given by the equation z = I q n where,
I = influence coefficient = 0.005
n = number of small area units covered by the plan
q = load intensity
The upward pressure at the contact surface between the base of the foundation and the underlying soil mass is termed as Contact Pressure. Contact pressure distribution depends on the following factors:
a) Flexural rigidity of footing
b) Elastic properties of the sub-grade soil
If the footing is flexible, contact pressure is uniform irrespective of the types of soil. However, in case of rigid footings, the contact pressure may depend on whether the soil is cohesive or cohesion less.
Case 1: Contact Pressure on Saturated Clay
Let us assume that we have two types of footings resting on saturated clay – flexible and rigid – subjected to a uniformly distributed load q.
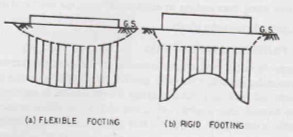
Flexible Footing
- Pressure distribution is uniform but settlement is non-uniform.
- Footing deforms to form a bowel-like shape with maximum deflection at the centre.
Rigid Footing
- Pressure distribution is maximum at edges and minimum at centre but the settlement is uniform.
Case 2: Contact Pressure on Sand
Let us assume that we have two types of footings resting on sand – flexible and rigid – subjected to a uniformly distributed load q.
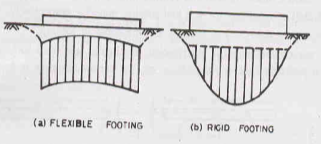
Flexible Footing
- Pressure distribution is uniform but settlement is maximum at edges and minimum at the centre.
Rigid Footing
- Pressure distribution is zero at edges and maximum at centre but the settlement is uniform.
Reference Books:
1) A.S.R. Rao and Gopal Ranjan -“Basic and Applied Soil Mechanics” – New Age International, 2007
2) A.K. Jain and B.C. Punmia- “Soil Mechanics and Foundations” – Laxmi Publications