The significance of the separate steps to lay a safer foundation for our subsequent study of complete problems that require the simultaneous consideration of all three steps once again.
STEPS
(i) Study of forces and requirements for equilibrium
(ii) The study of deformation and geometric fit conditions
(iii) Application of relations of force-deformation
3.1.1 Definition of slender members
Note that you can classify a large portion of the load-carrying members as slender members. We mean any part with a slender member whose length is much larger (say, at least five times larger) than either of its cross-sectional dimensions.
Things like beams, columns, shafts, rods, stringers, struts, and links are included in this classification. It still retains its identity as a slender member, even if a long, thin rod is formed into a hoop or a coil spring whose diameter is large compared to the thickness of the rod.
3.1.2 General Method
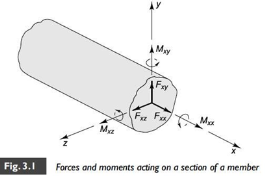
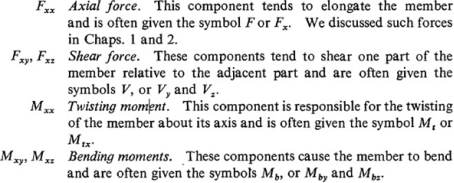
Definition of force vector direction in 3-D Fxy
The former, x, is the vector direction of the area that is perpendicular to the area. The latter, Y, is the direction of the vector of force or moment. F implies that the y direction force on the y-z plane is applied.
|
Sign convention for analytical consistency and reproducibility
(i) Positive when the force or moment component acts in a positive coordination direction on a positive face. Components of the force and moment shown in Fig. 3.1 According to this convention, everyone is positive.
(ii) Positive when the component of force or moment acts in a negative coordination direction on a negative face.
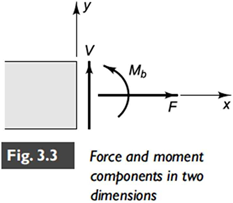
For 2-D case (say, the xy plane), the only three components remain: the axial force (F), the shear force (V), and the bending moment (Mb)
|
The steps required to resolve the forces and moments in a slender member
(i) Idealization: idealizing the real problem, i.e. creating a system model, and isolating the main structure, demonstrating all the forces that act on the structure.
(ii) Determination of external forces or moments: calculate any unknown external or support forces using the equation of equilibrium ( ⁇ = 0 and ⁇ = 0).
(iii) Determination of internal forces or moments: cut the member to an interest section, isolate one segment, and repeat step 2 for that segment.
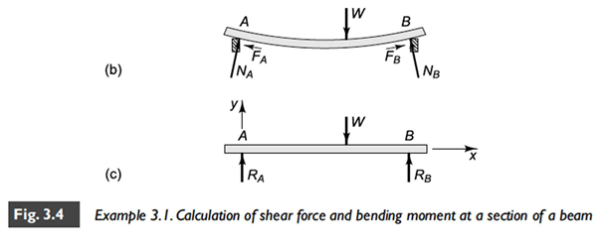
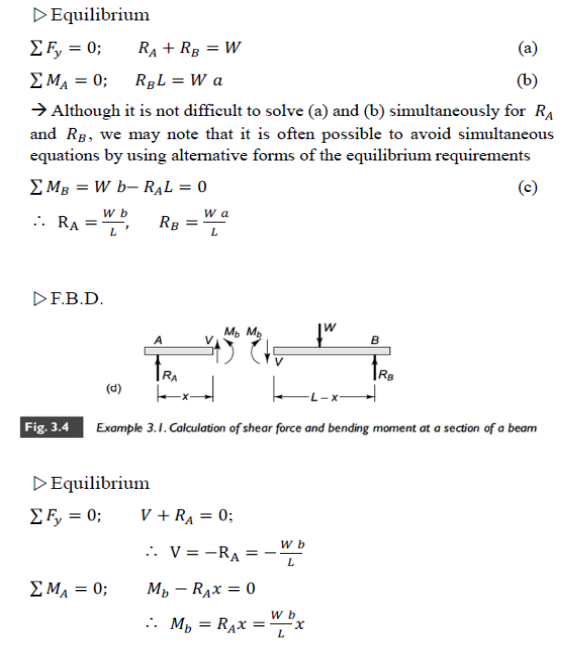
Example 3.1As an example, let us consider a beam that supports a weight near the center and rests on two other beams, as if it were on two other beams.
Displayed in Fig. 3.4 (a). The forces and moments acting in section C should be discovered.
|
Assumption
I If the beam is not entirely rigid, the beam tends to bend slightly, as in Fig. 3.4 4.4 (b). When the friction coefficient is small, compared to normal forces, we can be satisfied that the friction forces will be small. We idealize the system in Fig 3.4 (c) on the basis of these considerations, where vertical reactions have been shown in A and B.
Fig. ii) In Fig. 3 4(c) We also ignored the weight of the beam.
|
|
Shear Force and Bending Moment Diagrams
(i) Diagram of Shear-force (S.F.D)
A graph that shows shear force plotted along a beam against distance
(ii) Diagram of Bending-Moment (B.M.D)
A similar graph that shows the moment of bending as a function of distance.
Axial-force diagrams and twisting-moment diagrams are also used in discussing slender members.
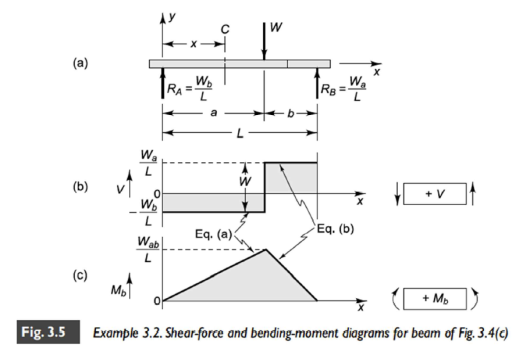
Example 3.2. The shear-force and bending-moment diagrams for the idealized beam of Fig 3.4 (c) that is redrawn in Fig 3.5 (a).
|
1) For 0 < x < a
F.B.D are in Fig. 3.4 (d) and in Example 3.1 we obtained the values

We can thus consider Eqs. (a) to define the shear-force and bendingmoment diagrams in the range 0 < x < a.
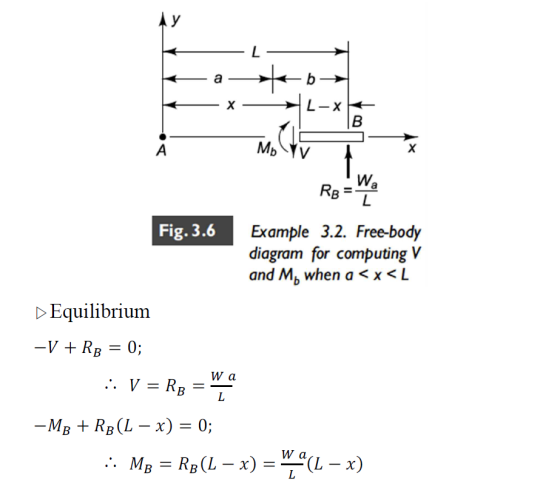
2) For a < x < L
F.B.D.
In Fig. 3.6~
|
3.1.3 Distributed Load
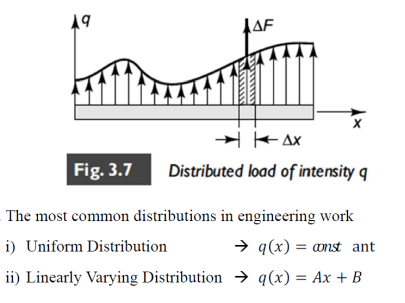
In the previous section, it was assumed that concentrated or "point" forces were the load acting on the slender members and support forces. The concept of continuously distributed loading is another idealization that is commonly used.
Intensity of Loading “q”

These forces can arise from pressures of fluid or gas, or from magnetic or gravitational attractions.
|
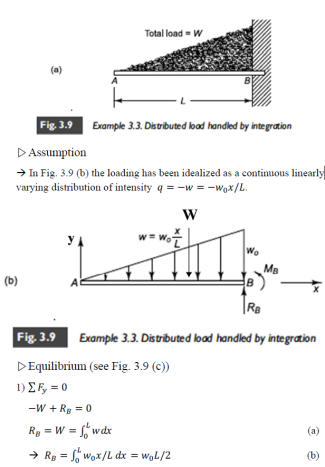
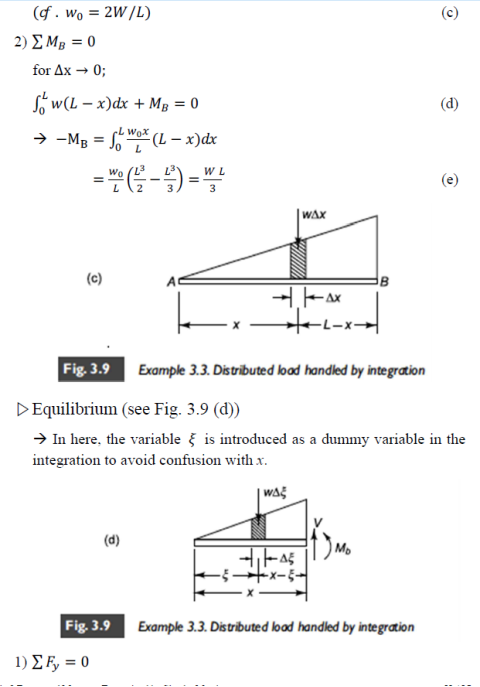
Example 3.3 Consider the AB cantilever beam, built in, shown in Fig., at the right end. 3.9 (a). In triangular fashion, bricks with a total weight were stacked up. Shear-force and bending-moment diagrams are desired.
|
|
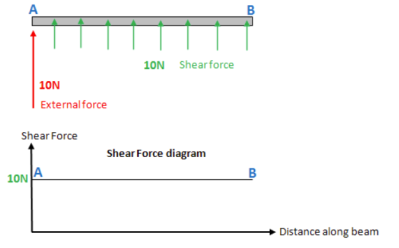
A force of 10N is exerted on a beam at point A. This is a type of force that is external. The beam is, however, the rigid structure, the force will be transferred all along the beam internally. Shear force can be known as this internal force. The shear force is normally plotted on the shear force diagram between points A and B. In this example, the plot is only a straight line as the shear force is 10 N all along the beam.
|
It seems odd to have the idea of shear force, maybe this example can help explain. Imagine pushing an object, with a force of 10 N, along a kitchen table. Even if the force is only applied to the object at a single point, it is not only the point of the object that moves forward. The whole object moves forward, which tells us that the force must have been transferred throughout the object, such that this 10N force is experienced by each and every atom of the object.
What if there were more than one force, as shown in the diagram below, then what would the diagram of shear force look like?
|
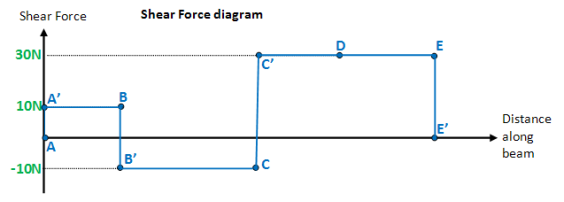
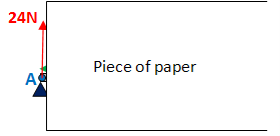
By finding the shear force at points A, B, C, E, the way you can go about this is (as there can be an external force acting at these points). The way the shear force can be worked out at any point is by covering everything to the right of that point (either with your hand or a piece of paper), and simply adding up the external forces. Plotting the point on the diagram of the shear force then. This is done for illustrationpurposes for point D:
|
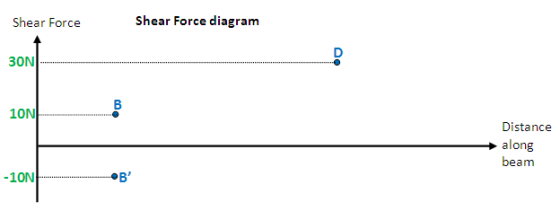
Shear force here at D = 10N – 20N + 40N = 30N
|
Consider point B now. But there's a force acting at point B - slight complication, are you going to include it? Both yes and no can be the answer. There are 2 measurements you need to consider. Put your piece of paper in the first place, so it's JUST before point B:
|
Shear force here at B = 10N
|
Now place the paper JUST after point B:
|
Shear force here at B = 10N - 20N = -10N
|
(B' is vertically below the B)
Now, do the points A, D, and E, and then finally get the points together. Your schematic should look like the one below.
|
Notice at point D how nothing exciting happens, which is why at that point you wouldn't normally analyze the shear force. For clarity, it is recommended that you move the paper from left to right when making these diagrams, and thus analyze the points A, B, C, and E in that order. You can also try this procedure that covers the left side rather than the right side, though your diagram will be "upside down" The diagrams are both correct.
3.2.1 Basic bending moment diagram
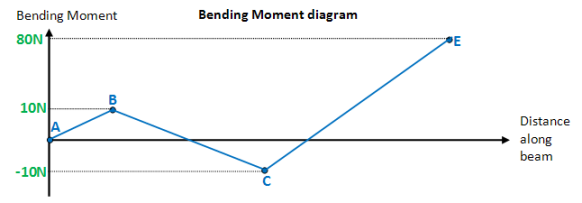
The moment of bending relates to the inner moment that can cause something to bend. When we bend a ruler, although the forces/moments are applied at the ends of the ruler, bending occurs all along the ruler, indicating that there is a bending moment along the ruler at all. The bending moment is therefore shown in a diagram of the bending moment. Here you can use the same case from before:
|
Cover (with a piece of paper) everything to the right of that point to work out the bending moment at any given point, and then take moments on that point. (To be positive, I will take clockwise moments). To illustrate, I will work out the moment of bending at point C:
|
Moment of bending at C = 10 N x 3 m- 20 N x 2 m = -10 N m
(Please note that units should be shown in 'Nm' in the two diagrams given below, not in 'N' as shown at present).
|
Notice that "just before and also just after" point C, there is no need to work out the bending moment (as in the case for this shear force diagram). This is because at point C, the 40N force exerts no moment on point C, either way.
Repeating the procedure and joining all the points for points A, B and E:
|
You can usually expect the diagram to begin and end at zero, but in this case it won't. This is my fault, and it happened because I accidentally selected the forces so that there was a moment of imbalance. That is, take the moments of any point (without covering the right of the point) and you will notice that, as they should be, the moments are not balanced. It also means that you will get a completely different diagram if you're covering the left side as opposed to the right. The forces are unbalanced upon inspection, so it is immediately expected that the diagram will most probably not be balanced.
3.2.2 Uniformly Distributed Load (UDL)
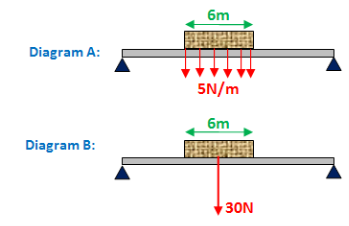
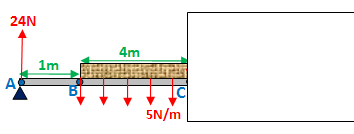
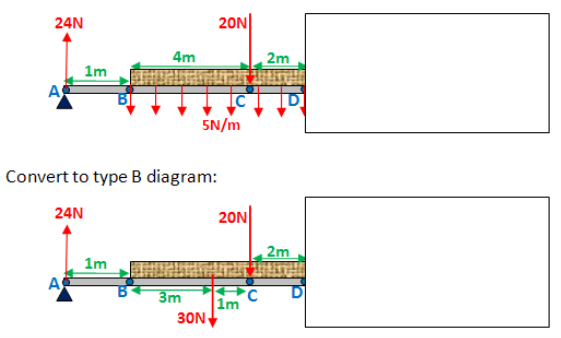
A brick lying on a beam is located below. The weight of the brick is distributed evenly on the beam (shown in diagram A). The brick has a brick weight of 5N per brick meter (5N/m). Since the brick is six meters long, the brick's total weight is 30N. In diagram B, this is shown. A simplification of diagram A is diagram B. You will need to be able to convert a type A diagram to a type B diagram, as you will see.
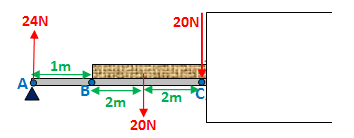
At point C, I have added an external force and a point moment to the diagram below to make your life harder. This is the most difficult kind of question I can think of, and step by step I'm going to do the shear force and bending moment diagram for it.
Firstly, identify the key points at which you will work out the shear force and bending moment at. These will be points: A, B, C, D, E and F.
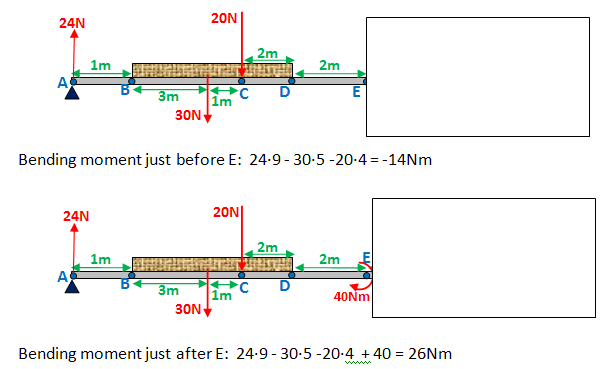
When you work out the bending moment and shear force at any given point, as you would have noticed, sometimes you just work it out at the point, and sometimes you work it out just before and after. Here is a summary: If you are dealing with a point force (points A, C and F in the diagram above), work out the shear force before and after the point when drawing a shear force diagram. Otherwise (for points B and D), just work it out at that point. If you are dealing with a point moment (point E), work out the bending moment before and after the point moment, when drawing a bending moment diagram.
You want to work out the values of R1 and R2 after identifying the key points. Now, as shown below, you need to convert it to a type B diagram. Notice that between points B and D, the 30N force acts right in the middle.
Force equilibrium: R1 + R2 = 50
Take moments about A:
4·30 + 5·20 + 40 - 10·R2 = 0
R1 = 24N, R2= 26N
Update original diagram:
Shear force diagram
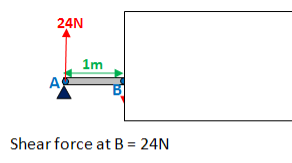
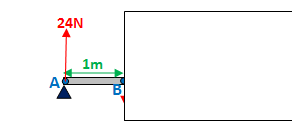
point A:
point B:
Notice that there is no effect on point B of the uniformly distributed load.
Item C:
Right before C:
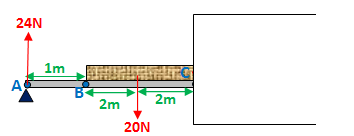
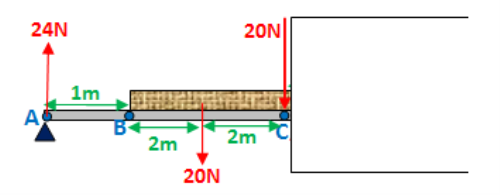
Now convert to a type B diagram. Total weight of brick from point B to C = 5x4 = 20N
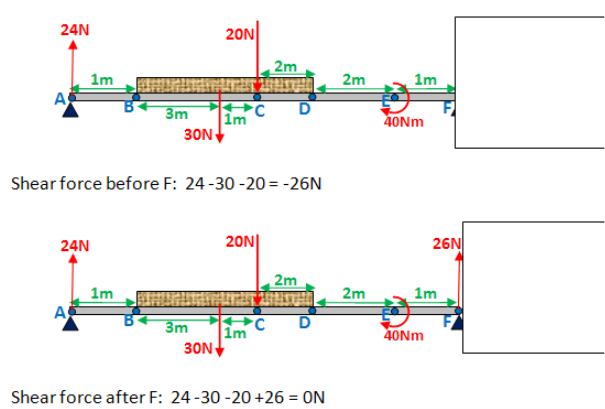
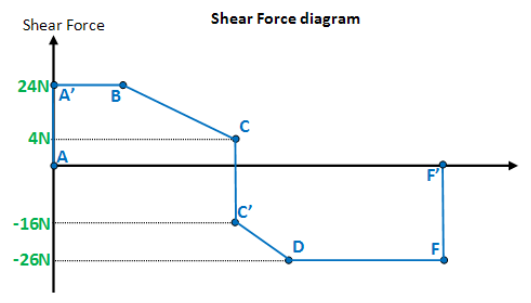
Shear force before C: 24 - 20 = 4N
Shear force after C: 24 - 20 - 20 = -16N
point D:
Shear force at D: 24 - 30 - 20 = -26N
point F:
(I have already converted to a type B diagram, below)
Finally plot all the points on the shear force diagram and join them up:
Bending moment diagram
Point A
Bending moment at A: 0Nm
Point B
Moment of bending at B: 24•1 = 24Nm
Item C:
(I have converted to a type B diagram already, below)
Moment of bending at C: 24•5 - 20•2 = 80Nmm
Paragraph D:
(I have converted to a Type B diagram already, below)
Bending moment at D: 24·7 - 30·3 - 20·2 = 38Nm
point E:
(I have already converted to a type B diagram, below)
point F:
(I have already converted to a type B diagram, below)
Bending moment at F: 24·10 - 30·6 - 20·5 + 40 = 0Nm
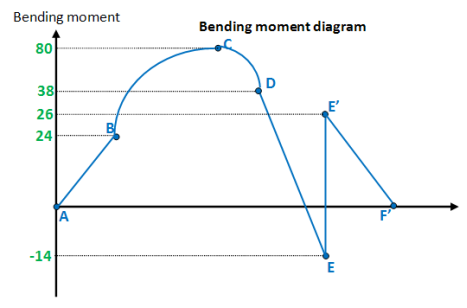
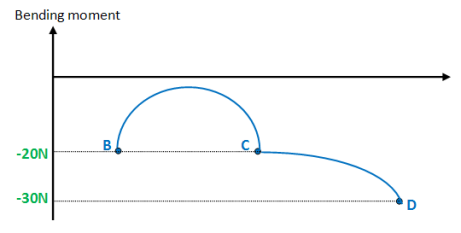
Finally, plot the points on the bending moment diagram. Join all the points up, EXCEPT those that are under the uniformly distributed load (UDL), which are points B,C and D. As seen below, you need to draw a curve between these points. Unless requested, I will not explain why this happens.
Note: The diagram will not be drawn to scale at all.
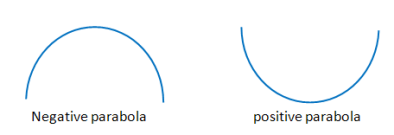
We have 2 curves drawn. One to C from B, one to D from C. Notice that some portion of a negative parabola resembles each of these curves.
Rule: When drawing a diagram of the bending moment, you must connect the points with a curve under the UDL. Some portion of a negative parabola must resemble this curve.
Note: "clockwise moments are taken as positive" is the convention used throughout this page. You would need to draw a positive parabola if the convention was "counter-clockwise moments are taken as positive".
3.2.4 Hypothetical scenario
What if points B, C and D were plotted as shown below for a hypothetical question? Notice how the curves for this case I have drawn.
How would you do it if you wanted to find the peak of the curve? Just simple. Add an additional point (point G), centrally between points B and C, to the original diagram (used at the start of the question). Then, at point G, work out the bending moment.
Let the distribution of Cauchy stress within a deformed solid be denoted. Suppose that the solid is subjected to a force of the body and allows and denotes the displacement, velocity and acceleration of a material particle in the deformed solid position.
The third law of motion of Newton (F=ma) may be
Phrased as
Written out in full
|
Note that in relation to the position in the actual, deformed solid, the derivative is taken. In the absence of body forces, for the specific (but rather common) case of a solid in static equilibrium,
Derivation: Recall that the resulting force that acts within a solid on an arbitrary volume of material V is
Where the internal traction acting on surface A is T(n) with normal n bounded by V. The linear momentum of volume V is that of volume V.
where v is the velocity vector of a material particle in the deformed solid. Express T in terms of
To convert the first integral into a volume integral, apply the divergence theorem and note that one can show (see Appendix D) that
so
|
The maximum stress criterion is often used to predict the failure of brittle materials, also known as the normal stress, Coulomb, or Rankine criterion.
The maximum stress criterion states that failure occurs when either the uniaxial tension strength st, or the uniaxial compression strength sc, is reached by the maximum (normal) principal stress
|
where s1 and s2 are the principal stresses for 2D stress.
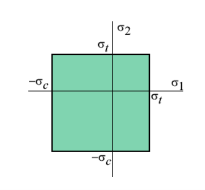
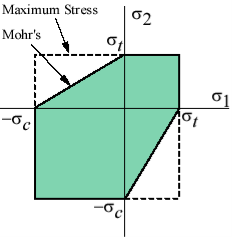
The maximum stress criterion graphically requires that the two main stresses lie within the green zone shown below,
|
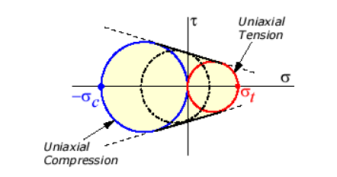
The Mohr Theory of Failure is based on the famous Mohr's Circle, also known as the Coulomb-Mohr criterion or internal-friction theory. In predicting the failure of brittle materials, Mohr's theory is often used and is applied to cases of 2D stress. The theory of Mohr suggests that failure occurs when the circle of Mohr exceeds the envelope created by the two circles of Mohr for uniaxial tensile strength and uniaxial compression strength at a point in the body. The figure below displays this envelope,
|
At the limiting compression stress of the material, the left circle is for uniaxial compression. Similarly, at the limiting tension stress, the correct circle is for uniaxial pressure st.
On the figure (dash-dot-dash line), the middle Mohr's Circle represents the maximum allowable stress for an intermediate state of stress.
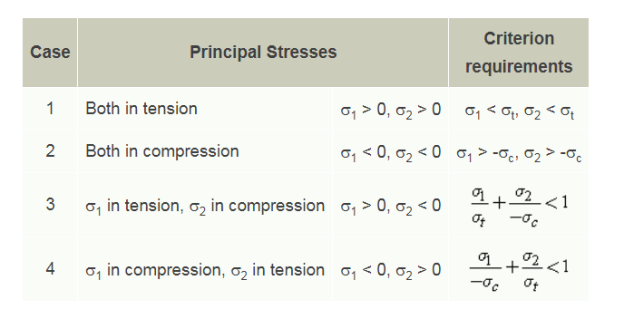
In the following table, all intermediate stress states fall into one of the four categories. In order to avoid failure, each case defines the maximum allowable values for the two principal stresses.
|
Graphically, the theory of Mohr requires that within the green zone shown below, the two main stresses lie,
|
The maximum stress criterion is also shown in the figure (dashed line). This theory is less conservative than the theory of Mohr, since it lies outside the boundaries of Mohr.
Reference:
1. Norris, C.H. and Wilber, J. B. and Utku, S. “Elementary Structural Analysis” Mc Graw
Hill, Tokyo, Japan.
2. Timoshenko, S. and Young, D. H., “Elements of Strength of Materials”, DVNC, New
York, USA.
3. Kazmi, S. M. A., ‘Solid Mechanics” TMH, Delhi, India.
4. Hibbeler, R. C. Mechanics of Materials. 6th ed. East Rutherford, NJ: Pearson
Prentice Hall, 2004
5. Crandall, S. H., N. C. Dahl, and T. J. Lardner. An Introduction to the Mechanics of
Solids. 2nd ed. New York, NY: McGraw Hill, 1979
6. Gere, J. M., and S. P. Timoshenko. Mechanics of Materials. 5th ed. Boston: PWS
Kent Publishing, 1970.
7. Ashby, M. F., and D. R. H. Jones. Engineering Materials, An Introduction to their
Properties and Applications. 2nd ed. Butterworth Heinemann.
8. Collins, J. A. Failure of Materials in Mechanical Design. 2nd ed. John Wiley & Sons,
1993.
9. Courtney, T. H. Mechanical Behavior of Materials. McGraw-Hill, 1990.
10. Hertzberg, R. W. Deformation and Fracture Mechanics of Engineering Materials. 4th
ed.John Wiley & Sons, 1996.
11. Nash, W. A. Strength of Materials. 3d ed. Schaum's Outline Series, McGraw-Hill,
1994.
