Unit -1
Basic Principle and Methodology of Economics
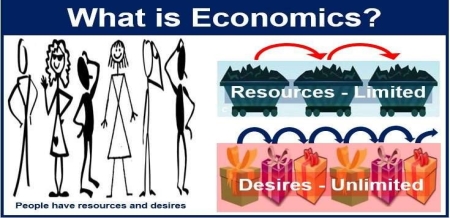
Economic definition: The economy is essentially a study of the use of resources under specific constraints, all linked to the bold hope that the subject under consideration is a rational entity that seeks to improve its overall well-being.
There are two branches of Economics: microeconomics (individual choices) which deals with entities and the interaction between those entities, while macroeconomics (aggregate outcomes) deals with the entire economy as a whole.
The 5 Basic Principles of Economics:
The world's beef supply is limited. The number of cows that farmers can raise each year is very large, but the destination of the beef is completely floating in the air. It can be replaced with minced beef and sold in large quantities at supermarkets. Can be put in slim gym and other beef jerky products.
You can change it to beef broth and can it for Campbell or send it to a local butcher. Due to the large amount of beef, only many of these products can be produced. So how do you decide how much product to turn into beef jerky poetry and turn into soup? The market system (see Supply and Demand) is a simple answer.
2. Marginal Principal Concept-In short, the definition of Marginal utility is very basic and is what we deal with every day when we run a business. Raise the level of activity as long as the marginal profit exceeds the marginal cost. In other words, spending more money than you are taking is not a very wise business decision without a comprehensive plan for profitability. You may spend three years in the start-up cost hole and rely heavily on investors, but no one is willing to invest if you don't see a way to make a profit. Here is an example of a very basic ordinal utility.
Let's say you run a donut shop. Flour, sugar, eggs and butter in a donut costs about $ .10 per donut. Each donut sells for $ 1.50. It's a huge profit, so it may seem that the marginal profit exceeds the cost.
Unfortunately, Yelp in your store has a low rating and few customers. Even if rents start to skyrocket and the donuts themselves are profitable, the marginal profit does not exceed the cost. You will eventually close your business. This is the definition of the limit principle in its most basic form.
Another example of ordinal utility? Stores can choose to continue expanding their business as long as they see an increase in revenue. For example, when stores like Sears and Toys 'R' Us see that their revenues have begun to decline significantly, they either shrink or shut down altogether.
3. Law Of Diminishing Returns-There are several other names for the law of diminishing returns. You may know it simply as a principle of diminishing returns or reduced marginal productivity. This economic principle shows that if one production is increased while the other production is fixed, the production will increase overall, but the rate of increase will gradually decrease.
Let's take a look at this simple example. A factory with a certain number of workers runs the assembly line most smoothly and finds the best number of workers to produce the most products. This magic number gives you the best returns. Adding more workers to the mix may actually show a decline in long-term profits. Regardless of who is the staff, there are so many products that conveyor belts can achieve. If you don't buy more machines, the cost of hiring these workers is actually your overall income if you are at the highest production level possible with the equipment you already have May be reduced to.
The law of diminishing returns is something that every company should consider when launching and planning expansion. This may still be profitable for the same reasons you hear about layoffs and restructuring within your enterprise, but it's not as profitable as you'd expect. The number of units sold should justify raw materials, salaries, and other manufacturing costs.
4. The Principle of Voluntary Returns- The principle of voluntary returns is a principle of economics that promotes a free exchange of goods and services between buyers and sellers in a marketplace. This particular principle is used highly in international trade.
For example, each country has products they specialize in. Taiwan is a huge manufacturer of microchips. American companies buy these chips to make computers. These computers can then be sold back to Taiwanese consumers.
Basically, we import the products we don't specialize in and sell off the ones we do. Sometimes, those things are deeply intertwined. The key part of this principle is that this exchange is voluntary. You get the best rate and both parties are happy with the exchange.
5. Real /Nominal Principle-The real/nominal principle is one of the fundamentals of economics. Basically, it states that people aren't interested in the face (nominal) value of money. They're interested in the actual (real) value of money. The real value is how much goods money can buy and the key to understanding how much money is actually worth in the scheme of real society. This is specifically important when factoring in exchange rates and inflation or the value in regard to other goods.
For example, if a car costs $10,000, that could also pay for a year of rent. If an insurance policy costs $500 per month, that money could also be spent on gas and maintenance.
Demand and Supply
Supply is the amount of goods and services that a company can produce using the resources available. Common resources are employees, machinery and raw materials. For example, automaker resources include assembly line workers, the factories they work in, sheet metal, engine parts, and other items used to make cars. However, keep in mind that these manufacturers have a large number of employees, factories and machines. The task of management is to maximize production from these limited resources.
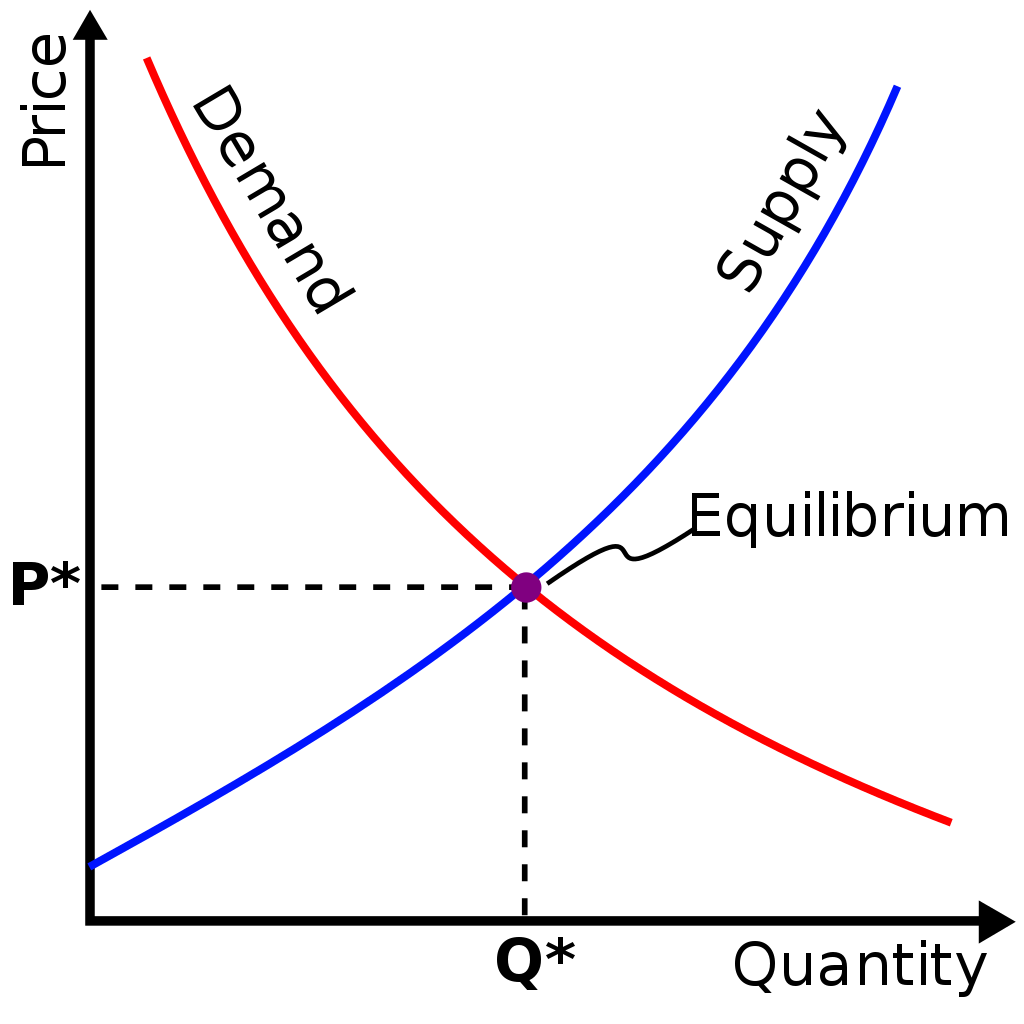
Demand is the amount of goods or services that a consumer is willing to buy at a particular price. If all other factors are equal, the buyer buys (demands) more goods at a lower price than at a higher price. Conversely, if consumers buy it at a higher price, the company will produce (supply) more goods. Reason: Greater profit. If a manufacturer makes little profit on a good, the manufacturer cuts or stops production.
The limit for manufacturers is to find an equilibrium price where the requested quantity is equal to the quantity sold. In other words, if their supply exceeds demand, their scarce resources are wasted overbuilding products. If supply does not meet demand, they will lose potential profits and customers who may seek alternative products.
Government Policies
An important takeaway is that the effects of Government policies depend, in part, on how responsive the quantity demanded or supplied is to changes in price, a concept known as price elasticity.
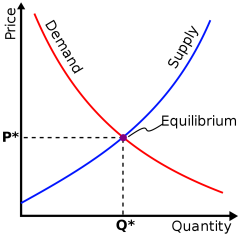
Price Elasticity
In the figure above, the demand curve is relatively flat, while the supply curve appears relatively steep. The slope of these curves reflects how responsive consumers, or firms, are in the quantity they demand, or supply, when prices change. In this overview, we will first see how market equilibrium reacts to shifts when demand/supply are more or less elastic.
Demand is referred to as elastic if the price elasticity of demand is greater than one. In this case it means that the percentage change in quantity demanded changes by more than the percentage change in prices. For example, if a 10% increase in the price of apples leads to a 20% decrease in the quantity demanded of apples, then quantity demanded is very responsive to price changes and demand is described as elastic. In this example, the elasticity is 2.
On the other hand, if the 10% increase in prices decreased quantity demanded by 5%, then the elasticity would be 1/2 and we would say that demand is inelastic. When quantity demanded is less responsive to price changes, the elasticity will be less than one, i.e., inelastic.
Government Policy
When assessing the impact of price controls on the market, it depends on whether price controls are binding. That is, if the market equilibrium wage is above the minimum wage, it is not binding and the law does not affect the market. The company was already above the minimum wage. Similarly, if the market equilibrium rent is below the upper limit, it is not binding and the law has no effect. The landlord had already charged rent below the statutory rent management price.
However, if price controls are binding, there will be surplus or shortage in the market. A binding minimum wage makes a worker's wage higher than a market equilibrium wage. In other words, supply = demand. In this case, the workers are paid higher wages and they try to give the company more time. Conversely, workers are paid higher wages, so according to the demand curve, companies will demand less working hours. This creates a labor surplus, also known as unemployment. The opposite is true for binding rent management, where the lessor wants more home because it is cheaper than the rent management law, but the landlord does not supply that much. This causes a shortage of markets.
2. Sales Tax-Consumption tax is a tax per unit on goods. Economists distinguish between who literally pays taxes to the government and the financial burden of taxes.
Tax Incident: How is the tax burden shared between buyers and sellers?
The main points from this section of the course are:
The tax return does not depend on who actually pays the tax to the government. Incidence depends on the relative elasticity of demand compared to supply.
The logic for this take-out is:
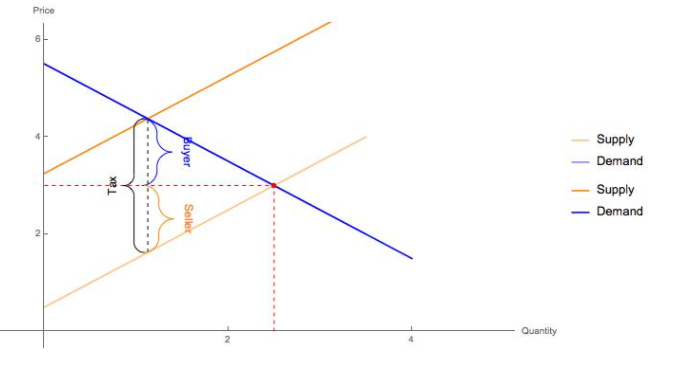
Therefore, the supply curve shifts up by the tax amount (see graph below). This is because we needed prices and taxes to produce the same amount as before.
The tax return for sellers is the difference between the pre-tax equilibrium price (red dot in the graph below) and the post-tax amount they receive. In the graph, this incidence is marked as a "seller."
For buyers, they are now paying higher prices (if the new supply curve intersects the demand curve). The tax return for a buyer is the difference between the equilibrium price after tax and the equilibrium price before tax. In the graph, this incidence is marked as "buyer”
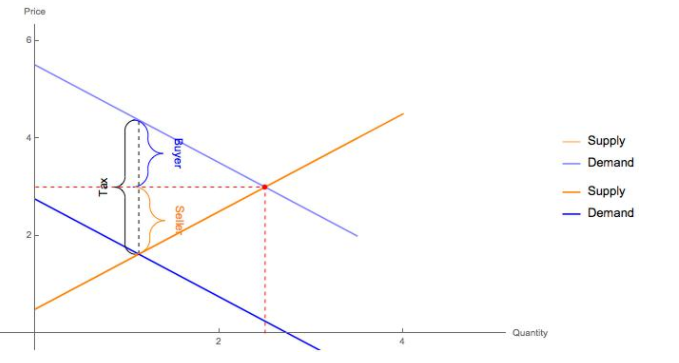
So, what about when the buyer pays the tax? How does this affect incidence?
 The tax return does not depend on whether the buyer or seller physically pays the tax, so when graphing the effect of sales tax, who pays the tax (that is, whether it is a change in demand or supply).) Is generally ignored and focused. About tax return.
What determines the tax return if the financial burden of the tax is shared between the buyer and the seller, regardless of who pays the tax? The answer is the relative elasticity of supply and demand, which puts more strain on the market with a less elastic curve.
For example, if demand is not very elastic compared to supply, it means that demand is less responsive to price. Therefore, when taxes are levied, the price paid by the buyer is significantly higher than that of the seller, which increases the tax burden on the buyer.
Conversely, if supply is not very elastic compared to demand, then supply is less responsive to price. Sales tax makes the price received by the seller much lower than that of the buyer. The seller bears a heavy tax burden.
Key Takeaways:
The theory of the firm consists of a number of economic theories that explain and predict the nature of the firm, company, or corporation, including its existence, behaviour, structure, and relationship to the market.[1]
A firm is an institution that purchases or employs factors of production and organizes them to produce and sell goods and services. A firm is an independent unit that produces the goods and services it sells.
Definition of Market
An arrangement that facilitates the buying and selling of goods, services, factors of production, or future commitments. / A market is a place where buyers and sellers meet and trade.
Definition of Market Structure.
Market structure refers to the number of buyers and sellers and the size of distribution in the market for goods and services. The market structure shows the number of buyers and sellers. Their market share; the degree of product standardization and ease of access to the market. Market structure also refers to a company's specific environment, the characteristics of which influence a company's pricing and production decisions.
There are four types of market structure
Perfect competition refers to a market situation in which there are a large number of buyers and sellers of homogeneous products.
The price of a product is determined by the industry by the forces of supply and demand. For example, if you need a pen, there should be several shops selling pens. Under the conditions of perfect competition, every seller must sell the same quality of the pen at a uniform prevailing price on the market. You can buy a pen from any store at the price Rs. 10. If another shopkeeper charged Rs. 12 for the same quality of the pen, nobody buys from him. But if the shopkeeper charged Rs. 9 all buy pens from that particular store. But both of these situations are unrealistic.
There must be one price dominant throughout the market. Therefore, full competition in the market structure is characterized by a complete lack of competition between individual companies.
Definition:
It is identified by the existence of the many firms; they all sell an identical product an equivalent way. The supplier is the one who accepts the price."- Vilas
Such market gains when the request for product of every producer is totally elastic. Mrs Joan Robinson.
It is a market condition with an outsized number of sellers and buyers, similar products, free entry of enterprises into the industry is ideal knowledge between buyers and sellers of existing market conditions and free mobility of production factors between alternative uses. Lim Chong-ya
Assumption:
The following assumptions for a fully competitive market:
1. A large number of buyers and sellers:
This affects single buyers and sales. When a company enters or leaves the market, there is no impact on the supply. Similarly, if a buyer enters or withdraws from the market, demand will not be affected. Such affects individual buyers and sellers.
2. Homogeneous products:
The second assumption of perfect competition is that all sellers sell homogeneous products. In this situation, the buyer has no reason to prefer the product of one seller to another. This condition exists only if the goods have a clear chemical and physical composition, that is, Substances of the specified grade: salt, tin, wheat, etc.
3. No discrimination:
Under complete competition in the market, sellers and buyers, sellers do freely. It means that buyers and sellers must be willing to deal openly with each other to buy and sell at market prices. This may be true of everything you might want to do so without offering special deals, discounts, or favours to selected individuals.
4. Perfect knowledge:
The competitive market is me (buyers and sellers are in close contact with each other. It means that, on the part of buyers and sellers, there is complete knowledge of the market. This means that many buyers and sellers in the market know exactly how much the price of the goods is in different parts of the market.
In other words, without the knowledge of each buyer and seller of the price at which the transaction is taking place, and the price at which the other buyer and seller are willing to buy or sell.
5. Industry FREE entry and exit:
In the long run, under full competition, the company can enter or exit the enterprise. There is no let or hindrance to the enterprise with regard to its entry into or exit from the market. In other words, the company has no legal or social restrictions. A large number of sellers is possible only if there is a free entry of the enterprise.
6. Perfect mobility:
There must be full mobility of domestic production factors that ensure uniform production costs throughout the economy. That means you are free to seek employment in any industry where different factors in production might like you.
7. Profit maximization:
Under perfect competition, all companies have a common goal of maximizing profits. Thus, there is a lack of social welfare of the general public.
8. No sales cost:
Under perfect competition, there is no sales cost.
9. No transportation costs:
Transportation costs between the sellers should not be. If transportation costs are present buyers are prevented from moving from one seller to another to take advantage of the price difference, which means that transportation costs do not affect the pricing of the product. In other words, these are always prices uniform in the market.
Monopolistic Competition An imperfect competition market that has the characteristics of both a monopoly market and a competitive market. Sellers can compete with each other and differentiate their products in terms of quality and branding to change their appearance. In this type of competition, the seller considers the price charged by the competitor and ignores the impact of his price on the competition.
Comparing short-term and long-term monopoly competition, there are two different aspects observed. In the short term, monopolies maximize profits and enjoy all profits as a monopoly.
Due to high demand, the company initially produces many products. Therefore, its marginal revenue (MR) corresponds to its marginal cost (MC). However, MRs will decline over time, and profits will decline as new companies enter the market where differentiated products affect demand.
The Oligopolistic market is made up of a small number of large companies that sell differentiated or identical products. Due to the small number of players in the market, their competitive strategies are dependent on each other.
For example, if one of the actors decides to lower the price of the product, the action will cause the other actors to lower the price as well. On the other hand, price increases may affect others so that consumers take no action in the hope of choosing their product. Therefore, strategic planning with these types of players is essential.
In situations where companies compete with each other, limiting production can create agreements to share the market and bring extraordinary benefits. This is true if either party respects the Nash equilibrium and neither is tempted to engage in the prisoner's dilemma. In such an agreement, they act like a monopoly. Collusion is called a cartel.
Monopoly Market
In a monopoly market, a single company represents the entire industry. There are no competitors and we are the only product seller in the entire market. This type of market is characterized by factors such as the sole claim to ownership of a resource, patents and copyrights, government-issued licenses, or high initial setup costs.
All of the above features related to monopoly limit other companies from entering the market. Therefore, the company remains the single seller as it has the authority to control the market and set prices for goods.
Difference between perfect competitions, monopoly and imperfect competition. Given below can explain the major differences between the three markets
Perfect competition is a concept in microeconomics that describes a market structure that is completely controlled by market forces. If these forces are not met, the market is said to have incomplete competition. There is no market that clearly defines full competition, but all real-world markets are classed as incomplete. That is, perfect markets are used as a standard that can measure the effectiveness and efficiency of real-world markets.
Perfect competition:
1. An outsized number of buyers and sellers.
2. Perfect competition among sellers.
3. Homogeneous products.
4. Lack of control over the factors of production.
5. Lack of price controls
6. Complete knowledge of the market.
7. One price or an equivalent price prevails everywhere.
Imperfect competition
Incomplete competition occurs in a market when one of the conditions of a fully
Competitive market is left unfulfilled. This type of market is very common. In fact, every industry has some type of incomplete competition. This includes various products and services, prices that are not set by supply and demand, competition for market share, buyers who do not have complete information about products and prices, and high barriers to entry and exit.
Incomplete competition is found in the following types of market structures: monopolies, oligopolies, monopolies, and oligopoly.
In monopolies, there is only one (dominant) seller. The company offers products to markets where there are no substitutes. Monopolies have high barriers to entry and there is a single seller who is a price maker. That means the company sets the price at which the product is sold regardless of supply or demand. Finally, the company can change the price at any time without notifying the consumer.
In oligopolies, there are many buyers, but only a few sellers. Oil companies, grocery stores, mobile phone companies, and tire manufacturers are examples of oligopolies.
As there are few players dominating the market it may block others from entering the industry. Companies with this market structure can do so if they set prices for products and services in bulk or, in the case of cartels, take the lead.
Imperfect competition:
1. Little number of buyers and sellers.
2. Incomplete competition of sellers.
4. Artificial restrictions on production factors.
5. The presence of control.
6. Ignorance of purchase.
7. Price discrimination.
Monopoly:
1. Just one seller.
2. Lack of competition.
3. Artificial restrictions on production factors.
4. Full control of price.
5. Incomplete knowledge of the market.
6. Price discrimination.
Key Takeaways
Introduction:
The term "macro" was first used in economics by Ragnar Frisch in 1933. However, it originated in the 16th and 17th century mercantilists as a methodological approach to economic problems. They were interested in the entire economic system. In the 18th century,
Physiocrats adopted it in the table economy, demonstrating a "wealth cycle" (i.e., net production) among the three classes represented by the peasant, landowner, and barren classes.
Malthus, Sismondi and Marx in the 19th century dealt with macroeconomic issues. Walras, Wicksell and Fisher contributed modernly to the development of pre-Keynes macroeconomic analysis.
Certain economists such as Kassel, Marshall, Pigovian, Robertson, Hayek, and Hortley developed the Quantity Theory of Money and General Price Theory in the decade following World War I. But Keynes, who eventually developed the general theory of income, output, and employment in the wake of the Great Depression, has credit.
Economics is a science that deals with the production, Exchange and consumption of various goods in the economic system. It is a scarce resource that can lessen the abundance of human welfare. The central focus of Economics lies in the choice between resource scarcity and its alternative uses. The word "economics" is derived from two the Greek words oikos (House) and nemein (to manage) mean to manage the household budget "using the limited funds possible.
Scope of Macro Economics
Economics is the subject of dealing with every situation happening all over the world. This subject is used in many stances in our lives. For example, your mom does all the work in your home. From doing all the housework to maintaining a budget for rations to meeting all your needs. Thus, it is one subject that deals with the daily work of our lives. There are two major categories on the same subject: microeconomics and macroeconomics. One deals with individual units of the economy, such as consumers and households. But the latter deals with the whole economy. It deals with research on national income and output. This understanding of science is vast and of varying lengths.
Microeconomics:
As mentioned above, microeconomics is a branch of economics that deals with individual units of the economy. It includes research areas on individual units such as consumers and homes. The subject deals with issues related to determining the price of goods. These direct or indirect factors affect the supply and demand of goods and the procurement of individual satiety levels. The main purpose of microeconomics is to maximize profits and minimize costs incurred. It is used for future generations to be available and balanced.
Difference between Microeconomics and Macroeconomics:
The differences between microeconomics and macroeconomics can be seen in the following points. Microeconomics is the study of the economic activity of individuals and small groups of individuals. This includes specific households, specific companies, specific industries, specific products, and individual prices.
Macroeconomics is also derived from Macross, which means "big" in Greek. The purpose of microeconomics on the demand side is to maximize utility, while on the supply side it is to minimize profits at the lowest cost. On the other hand, the main objectives of macroeconomics are full employment, price stability, economic growth and a good balance of payments.
The basis of microeconomics is a price mechanism that works with the help of the power of supply and demand. These forces help determine the equilibrium price of the market. On the other hand, the basis of macroeconomics is national income, output, and employment, which are determined by aggregate demand and aggregate supply.
Microeconomics is based on various assumptions about the rational behavior of individuals. In addition, the phrase "ceteris paribus" is used to describe economic law. Macroeconomics, on the other hand, makes assumptions based on variables such as the total output of the economy, the extent to which its resources are used, the size of national income, and general price levels.
Microeconomics is based on partial equilibrium analysis that helps explain the equilibrium conditions of individuals, businesses, industries, and factors. Macroeconomics, on the other hand, is based on general equilibrium analysis, which is an extensive study of many economic variables, their interrelationships and their interdependencies, to understand the workings of the entire economic system.
In microeconomics, equilibrium studies are analyzed at specific times. But it does not explain the time element. Therefore, microeconomics is considered static analysis. Macroeconomics, on the other hand, is based on time lags, rate of change, past and expected values of variables. This rough division between microeconomics and macroeconomics is not rigorous, as parts affect the whole and whole influences the parts.
GDP stands for Gross Domestic Product. It refers to the market value of all goods and services produced within an economy in a given period of time. Equivalently, GDP also refers to the total income earned by each household, company, and government within a given period of time. Therefore, GDP measures the flow of personal income and output in an economy.
GDP using the Expenditure Approach:
GDP = Consumer spending on goods and services (C)
+ Business gross fixed investment (I)
+ Change in inventories (I)
+ Government spending on goods and services (G)
+ Government gross fixed investment (G)
+ Exports – Imports (X − M)
+ Statistical discrepancy
Exam tip: The easiest way to remember this formula is the following:
GDP = C + I + G + (X – M)
GDP using the Income Approach:
GDP = National income (see the next section)
+ Capital consumption allowance (portion of GDP due to depreciation)
+ Statistical discrepancy
Note that the statistical discrepancy is equal to gross domestic product less gross domestic income.
NI (National Income)
National income refers to the income received by all factors of production adopted to produce the final product.
It is calculated as follows:
National Income = Compensation of employees
+ Corporate and government enterprise profits before taxes
+ Interest income
+ Unincorporated net income of businesses
+ Rent
+ Indirect business taxes – subsidies.
Net domestic product (NDP) equals the total final output produced within a nation during a year, where output includes net investment or gross investment less depreciation:
NDP = GDP – depreciation
Disposable Income
Disposable income, the portion of an individual's income for which the recipient has full discretion. Providing an accurate general definition of income is not easy. Income includes wages and salaries, interest and dividend payments from financial assets, and rent and net income from businesses. Capital gains on real or financial assets should also be counted as income in most cases, at least as long as they increase purchasing power. Such profits can be counted even if the asset has not actually been sold and the increase in purchasing power has not been exercised. In addition, it may include non-cash receipts (in-kind income).
Disposable income excludes mandatory payments in the form of direct taxes, compulsory payments to the social insurance system, and simple remittances from other people, institutions, or governments such as social security benefits and pensions. Includes further adjustments to include, and alimony. In some cases, the line between voluntary and mandatory payments becomes ambiguous, obscuring the meaning of disposable income. It may also be necessary to distinguish between the transfer income that a person is entitled to and the income that is actually received.
By convention, VAT and other taxes, payroll taxes, and indirect taxes such as employer contributions to social insurance are not deducted from the disposable income calculation. These obviously reduce the purchasing power of individuals in general, but it is difficult to attribute their occurrence to a particular person or family. If family members or members of other units share a "pool" of income, there may be a substantial difference between an individual's nominal disposable income (e.g., recorded in salary) and actual discretionary spending. You should also note that there is power. Therefore, a person whose official statistics appear to have very low income after tax may actually be a part-time worker who contributes to and shares the common resources of the family.
Key Takeaways:
What is a closed economy?
A closed economy has no trading activity with the outside economy. Therefore, a closed economy is completely self-sufficient, meaning that imports do not enter the country and exports do not leave the country. The goal of a closed economy is to provide domestic consumers with everything they need from the border.
Why there is no real closed economy
Maintaining a closed economy is difficult in modern society, as raw materials such as crude oil play an important role as inputs to final goods. Many sovereign states do not commonly have raw materials and are forced to import these resources. The closed economy is an instinctive resistance to contemporary liberal economic theory, which promotes the opening of domestic markets to international markets in order to take advantage of comparative advantage and trade.
By focusing on labour and allocating resources to the most productive and efficient work, businesses and individuals can increase their wealth.
Popularization of open trade
Recent globalization means that economies tend to be more open to take advantage of international trade. Petroleum is a good example of a raw material traded worldwide. For example, in 2017, according to World, & quot; sTopExport.com, an independent research and education company, the five largest oil exporters accounted for more than USD $ 841.1 billion in exports.
Saudi Arabia for $ 13.36 billion
$ 93.3 billion Russia
$ 61.5 billion in Iraq
$ 5.4 billion in Canada
United Arab Emirates is $ 49.3 billion.
According to the Energy Information Administration, even the United States, the world' largest oil producer, imported about 104,000 barrels / day in 2017, most of it from Canada, Saudi Arabia, Mexico, Venezuela and Iraq.
Why closes the economy?
A fully open economy runs the risk of being overly dependent on imports. Domestic producers can also suffer because they cannot compete at low international prices. Therefore, governments can use trade controls such as tariffs, subsidies and quotas to assist domestic companies.
Closed economies are rare, but governments may shut down certain industries from international competition. Some oil-producing countries have a history of banning foreign oil companies from doing business at their borders.
Example of closed economy
In reality, there is no completely closed economy. Brazil is the world' s most closed economy, importing the world' s lowest quantity of goods when measured as part of its gross domestic product (GDP). Brazilian companies face competitive challenges such as rising exchange rates and defensive trade policies. In Brazil, only the largest and most efficient companies with large economies can overcome export barriers.
How real interest rates balance commodity markets
Y = C + I (r) + G
Model Background
This model is closed in the sense that the model has no exports or imports. This model includes government taxes and government spending.
If the model is out of equilibrium, it is the changing real interest rate that brings the model back into equilibrium. Y> C + I (r) + G => Interest rate decreases => I is y = C + I (r) + Y < C +
I (r) + G => Interest rate increases => I is Y It decreases to = C + I (r) + G.
The left side of the commodity market represents supply
The right side represents demand.
Supply Y = C + I(r) + G Demand
Open Economy
As the name implies, an open economy is one that maintains financial and trade relations with other countries. In an open economy, countries trade imports and exports and engage in international trade activities. An open economy also allows businesses to borrow money and allows banks and financial institutions to lend money to foreign entities. The open economy also exchanges technical know-how and expertise.
Open economies are encouraged, and many open economies exist through international trade agreements and economic and political coalitions.
The economic system, called the open economy, is one of the most popular models of the country's development today. The main characteristics of an open economy are related to free trade and other types of economic interactions with other economies. The open economy approach actively engages countries in international economic relations by importing and exporting goods and services, promoting the free flow of capital, and the labor force. The open economy is market oriented. It applies free market policy. Product prices and production levels are determined by the power of the market in economic models. In addition, the open economy industry is primarily owned by separate individuals, not the government. In international trade, free trade policy is the main direction of an open economy.
Difference between Closed and open economy
Therefore, the main difference between an open economy and a closed economy is based on how the economic system develops in terms of international trade and international economic relations. The open economy aims to open the border to economic interactions with other countries and to actively participate in the world economic process. On the contrary, countries with closed economies are less likely to close their borders with other countries, separate from the international economy and participate in global processes.
An important feature is the level of government intervention in economic processes and market development. In an open economy, the impact of government is minimal. The power of the market regulates prices and production levels that support the balance between supply and demand. On the other hand, closed economies are tightly regulated by governmental mechanisms. The market depends on the policies and restrictions implemented by the government. In addition, industry ownership also varies between models. The open economy industry is primarily privately owned. In a closed economy, they are primarily owned by the government.
An open economy is often seen as a system with more benefits for the countries to which it applies. An open economy is more stable, flexible and adjustable than a closed economy. Therefore, although some countries, such as North Korea, still use the closed economy model, they have an advantage over the closed economy system. In summary, the open economy is more market oriented. Therefore, it is more efficient and profitable for the enterprise.
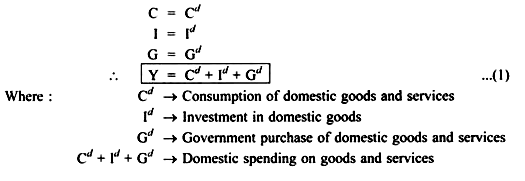
Closed Economy:
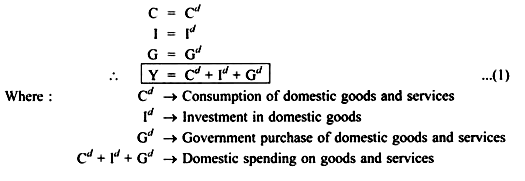
In a closed economy all output is sold domestically.
Therefore, expenditure is divided into 3 components:
(i) Consumption (C)
(ii) Investment (I)
(iii) Government purchases (G)
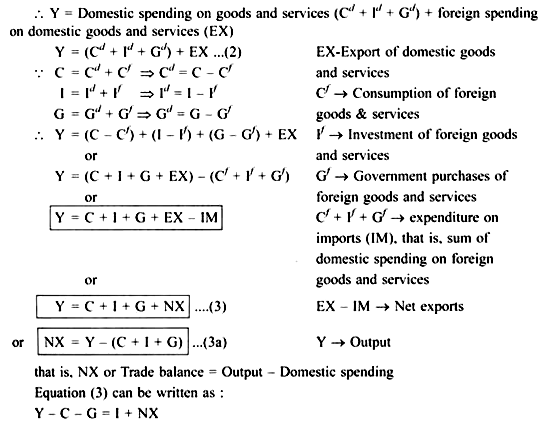
Open Economy:
In open economy:
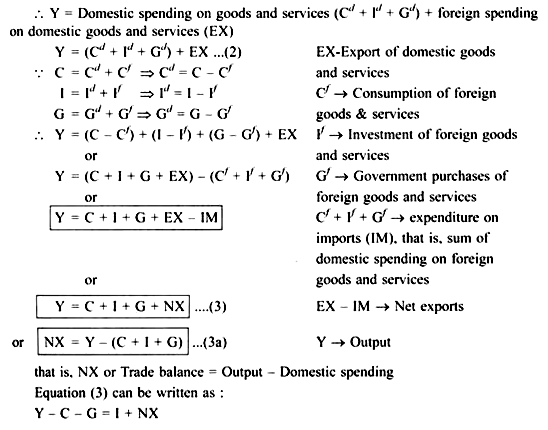
In an open economy some output is sold domestically and so
output is sold abroad, that is, exported
Therefore, expenditure in an open economy is divided into 4 components:
(i) Cd (ii) ld (iii) Gd (iv) EX.
... Y-C-G = S (national saving)
S = I + NX...4
Or S – I = NX.
(i) If output exceeds domestic spending i.e., Y > C + I + G
Key Takeaways:
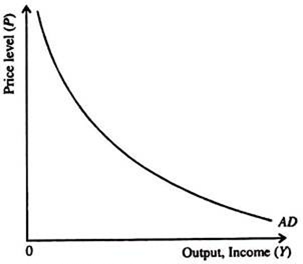
The term Aggregate Demand (AD) is used to describe the inverse relationship between demand and general price levels. The AD curve shows the amount of goods and services people in the country want at existing price levels.
In Fig. the AD curve is drawn for a given value of the money supply M.
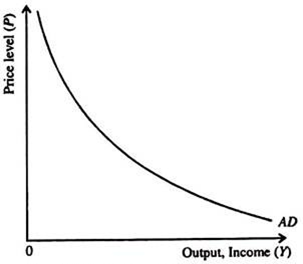
The AD curve is downward sloping for two reasons:
Aggregate Supply
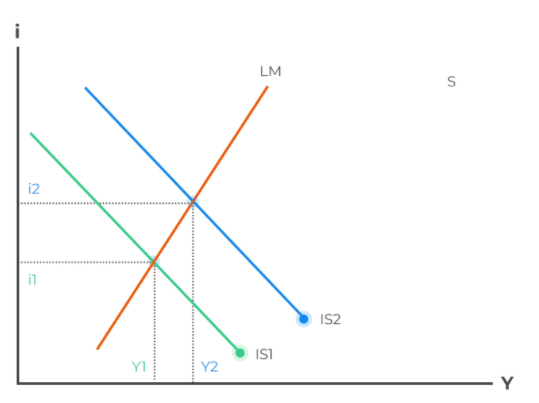
The aggregate supply (AS) is the relationship between the quantity of goods and services supplied and the price level. However, the shape of the AS curve depends on the behaviour of prices which, in its turn, depends on the time horizon under consideration. IS refers to Investment-Saving while LM refers to Liquidity preference-Money supply. These curves are used to model the general equilibrium and have been given two equivalent interpretations. First, the IS-LM model is used to explain the changes that occur in national income with a fixed short-run price level. Secondly, the IS-LM curve explains the causes of a shift in the aggregate demand curve.
The IS-LM Model
The model is represented as a graph consisting of two intersecting lines. On the X-axis we have the real gross domestic product (Y), which is simply the output that the economy produces. On the Y-axis, we have nominal interest rates (i).
The intersection of the IS and LM curves shows the equilibrium point of interest rates and output when money markets and the real economy are in balance. If we move one of the two curves to the right or to the left, the model gives us a new set of economic output and interest rates.
IS Curve
Here, the interest rate is the independent variable while the level of income is the dependent variable. Notably, the curve is downward sloping. The IS also shows the locus point where total income equals total spending:
Y=C(Y−T(Y)) +I(r)+G+NX(Y)Y=C(Y−T(Y)) +I(r)+G+NX(Y)
Where:
YY = income
C(Y−T(Y)) C(Y−T(Y)) = consumer spending as an increasing function of disposable income
l(r)l(r) = investment. A decreasing function of interest rates
GG = government expenditure
NX(Y)NX(Y) = net exports
LM Curve
In this case, the independent variable is income while the independent variable is interest rates. This curve represents the money market equilibrium. Also, it represents the set of points at an equilibrium between liquidity preference (demand for money) and the money supply function.
By using the quantity of money theory, we get a clear relationship between the nominal money supply (M), the price level (P) and the real income/expenditure (Y):
MV=PYMV=PY
Where V is the rate at which the money circulates in the economy (velocity of money). If we assume that V remains constant, then the theory postulates that the money supply determines the nominal value of the output (PY), that is, an increase in the money supply will increase the nominal value of output. However, this equation does not tell us how will this increase will be felt in price and quantity.
LM Curve
Real Money
Key Takeaways:
The Price Index (PI) is a measure of how prices change over a period of time. In other words, it's a way to measure inflation. There are multiple ways to calculate inflation (or deflation). In this guide, we'll look at several ways to do that. Inflation is one of the key indicators monitored by the Fed to set interest rates.
We shall explain two types of price indices:
Wholesale price index (WPI) and Consumer price index (CPI).
Wholesale Price Index (WPI):
The Wholesale Price Index shows the average value of a product group measured as a unit of measure. This is the ratio of the price of a product group for a particular year or the current year to the price of the base year. This is calculated by dividing this year's price by the base year's price.
To get in the form of percentages or percentages, multiply by 100 to get the relative price of each item. This is a simple indicator of wholesale price. The weighted price index is obtained by weighting each relative price and averaging all the items together.
The weight assigned to each item is the percentage of expenditure on each item of the group of commodities in relation to the total expenditure.
Simple Price Index
To construct a simple price index, compute the price relatives and average them. Add the price relatives and divide them by the number of items. Table 1 illustrates the construction of a simple index of wholesale prices.
Table 1: Simple Wholesale Price Index:
N=6 500 Σ R=870
Price relative R= Price in 2000/ Price in 1990x 100 P1/Po x 100
Using arithmetic mean, price index in 2000= ΣR/ N = 870 / 5 = 174
The preceding table shows that 1990 is the base period and 2000 is the year for which the price index has been constructed on the basis of price relatives. The index of wholesale prices in 2000 comes to 174. This means that the price level rose by 74 per cent in 2000 over 1990.
Weighted Price Index
Taking the example of Table 1 already given, we assign high weights to commodities of greater importance to consumers and low weights to commodities of lesser importance, as shown in Table 2.
Table 2: Weighted Wholesale Price Index
Using arithmetic mean, the weighted wholesale price index in 2000 = 4450/24 =181.2.
Using arithmetic mean, the weighted wholesale price index in 2000 = 4450/24 =181.2.
Consumer Price Index
The weighted price index is more accurate than the simple price index. In the example given above, the weighted price index shows an increase of 81.2 per cent in the price level in 2000 over 1990 as against the increase of 74 per cent according to the simple price index.
The wholesale price index does not reflect the impact of price changes on living expenses in various sections of the country. This is because not all individuals consume similar products. People from different layers of society do not buy the same type of goods.
The consumption of goods depends on the socio-economic settings of the people. The low-income group does not consume butter, cheese, eggs, etc. and does not buy coolers, refrigerators, cars, etc., but the middle- and high-income groups do.
Therefore, the consumer price index is based on the commodities consumed in different sections of society.
For example, all Indian consumer price indexes are created for industrial workers, non-manual workers in urban areas, and agricultural workers. They show how a particular consumer group is affected by changes in the prices of different products.
The consumer price indices are constructed for the following purposes:
(i) To measure the purchasing power by the domestic currency i.e., rupee in India.
(ii) To regulate the D.A. of employees in order to compensate them for the rise in prices.
(iii) To estimate the real income of a group for which the index is constructed.
(iv) To determine economic policies relating to pay scales, wages, HRA, taxation, etc.
(v) To compare the cost of living of cities, states and regions of a country
There are a number of methods for constructing CPI. But two standard methods are:
(1) The Laspeyre Price Index:
L = Σp1q0/ Σp0q0 × 100
Where the weights are the quantities of the base period (q0).
(2) The Paasche Price Index:
P = Σp1q1/ Σp0q1 × 100
Where the weights are the quantities of the current period (q1).
We explain them with the help of the following examples.
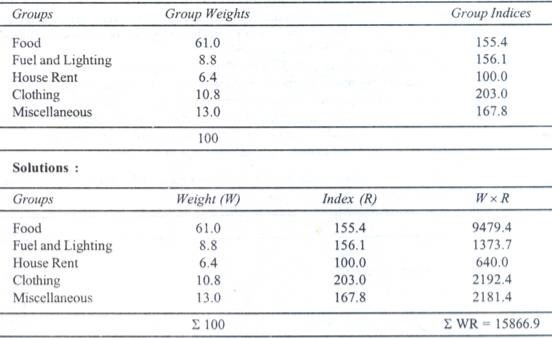
Example 1:
Compute the consumer Price Index from the following data of group weights and group indices pertaining to a certain centre:
Consumer Price Index No. = ΣWR/ ΣW = 15866.9/ 100 = 158.669 = 158.67 app.
Key Takeaways:
Interest rate is the percentage of principal that the lender charges for the use of the money. The principal is the loan amount.
Interest rate is the amount charged by the lender for the use of the asset, expressed as a percentage of the principal. Interest rates are listed on an annual basis, commonly known as the Annual Percentage Rate (APR). Borrowed assets can include cash, consumer goods, or large assets such as vehicles and buildings. Understand interest rates
Interest is essentially a rental or lease fee to the borrower to use the asset. For large assets such as vehicles and buildings, the lease rate can act as an interest rate. If the borrower is considered low risk by the lender, the borrower is usually charged a lower interest rate. If the borrowers are considered high risk, the interest rates they will be charged will be high. Risk is usually assessed when a lender sees a potential borrower's credit score, which is excellent if you want to qualify for the best loan
For loans, the interest rate applies to the principal, which is the amount of the loan. Interest rates are the rate of debt costs for borrowers and returns for credits.
When will interest rates apply?
Interest rates apply to most loan or borrowing transactions. The college tuition fees for the home where you purchased your personal debt, the start or fund business of a fund business, or the payment of your personal debt are as follows: Companies fund capital projects and obtain loans to expand their business by purchasing fixed and long-term assets such as land, buildings and machinery. Borrowed money will be repaid in one lump sum on a pre-determined date or in regular instalments.
The money repaid is usually more than the amount borrowed, as the lender needs compensation for the loss of money use during the loan period. The lender may be investing money during that period rather than offering a loan that would be generating income from the asset. The difference between the total repayment total and the original loan is of interest to be fulfilled. The interest charged will be applied to the principal amount.
Compound interest rate
Some lenders prefer the compound interest rate method, which means the borrower pays more for interest. Interest, also known as compound interest, applies not only to the principal, but also to the cumulative interest of the previous period. The bank assumes that at the end of the first year, the borrower bears the principal and interest of the year. The bank also assumes that at the end of the second year, the borrower bears principal plus first year interest plus first year interest.
The interest paid at the time of compounding is higher than the interest paid using the simple interest method. Interest is charged monthly on the principal, including accrued interest from the previous month. For short time frames, the calculation of interest is similar in both ways. However, as lending time increases, the gap between the two types of interest rate calculations increases.
Compound interest=p× [(1+interest rate) n−1] where: p=principaln=number of
Compounding periods
How Interest Rate Differentials
The Forex market is the largest and most liquid market with nearly $ 5 trillion day traders. There are many drivers for a particular currency pair. The most attractive is the interest rate differential. The difference in short-term or long-term interest rates of the countries that make up a currency pair is used to create a forward rate and, in the long run, helps drive the direction of the currency pair. Most professional traders find that with the bond market. While keenly aware of how it affects the currency market, many novice traders are wondering how interest rates make up the forward curve of currency market dynamic interest rates.
When you buy or sell a currency pair, you buy one currency and sell another at the same time. Most of the global currency transactions are in the spot market. Spot market transactions will be settled within 2 business days. If you are interested in holding currency trading longer than 2 business days, you need to trade futures trading. Forward contracts add forward points to currency pairs that are traded for three days or more.
To calculate the forward rate, currency traders use the rate of interest differential. This is the difference in short-term interest rates for every of the countries that structure a currency pair. For example, if you buy a US dollar / yen currency pair, you will receive a US dollar interest rate and you will have to pay the Japanese short-term interest rate.
Certain things are added or subtracted from it. First, you need to determine which rate is higher. Currently, US dollar interest rates are above Japanese interest rates. Using the USD / JPY purchase example, you would deduct the forward points from the rate that offers the new rate that incorporates the forward points.
How will it affect interest rate differentials?
There are several factors that drive interest rate differentials. Clearly, changes in monetary policy are key to changing national interest rate levels. Changes in economic data are also an important factor as market power raises interest rate levels. This allows you to follow the economic calendar to determine if there are any specific events that will drive future rate directions. In addition to economic events and policy changes, political conflicts can also raise interest rate levels. If there is uncertainty in a country, the market will demand more from the country to lend them money.
Bond markets in most developed countries move in parallel with each other. Most developed bond markets move in tandem when certain events have plenty of opportunities to change the course of interest rates in a country, but when there is little new information available. Historically, the US bond market has been the driving force behind most of the global rate movements.
How will interest rate differentials affect currency pairs?
Interest rate differentials can be profitable or deterrent when you decide to buy or sell a currency pair. For example, if you plan to buy or sell dollars / yen for two years, you will receive 2.68% for buying dollars or 2.68% for buying yen and selling dollars. This is because the US 2-year yield is 2.50% and Japan's 2-year yield is -0.18%. If you buy dollars and nothing happens for 2 years, you will get 2.68%. If you buy Japanese Yen and sell Dollars and nothing happens for 2 years, you will lose 2.68%
Chart interest rate differentials
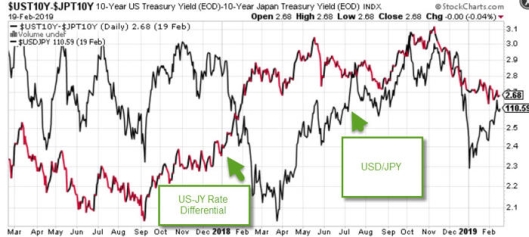
One of the best ways to follow interest rate differentials is to graph it. Each currency pair reacts differently to changes in interest rate differentials. It's important to remember that the diff works in tandem with the currency pair, so we're trying to see what the future interest rate diff will be.
From the US 10-year yield and Japanese 10-year government bond yield charts, you can see that the interest rate differential is traded in conjunction with the US dollar / yen currency pair. There are times when two assets diverge, but over time they move in parallel with each other.
Many people are asking the question, do rate differences drive currency pairs, or currency pairs drive interest rate differences? The answer is both, as the interest rate differential constitutes the forward rate. What you want to evaluate as a trader is whether the currency pair is moving in one direction and whether the interest rate differential is moving in the other direction.
Overview
Interest rate differentials are the fundamental driving force behind the movement of currency pairs. Interest rate differentials make up the currency forward curve and are therefore an integral part of currency trading. Monetary policy, economic events, and political conflicts are key factors driving interest rates. To get a gauge of where the interest rate differential is relative to a currency pair, you can graph the two. What you are looking for is a divergent interest rate differential and currency pair path that may give you a clue as to the future direction of the currency pair.
Key Takeaways:
TYPES OF TAXES
Prevalence of a number sorts of taxes is found in India. Taxes in India can be both direct and indirect.
However, the kinds of taxes even depend on whether a precise tax is being levied by the central or the kingdom authorities or any other municipalities. Following is some of the predominant Indian taxes:
Direct Taxes
It is names so because it is directly paid to the Union Government of India. As per a survey, the Republic of India has witnessed a steady upward jab in the collection of such taxes over a period of previous years. The seen growth in these tax collections as well as the rate of taxes displays a healthful within your budget boom of India. Besides that, it even portrays the compliance of high tax alongside with higher administration of taxation. To title a few of the direct taxes, which are imposed with the aid of the Indian Government are:
• Banking Cash Transaction Tax
•Corporate Tax
• Capital Gains Tax
• Double Tax Avoidance Treaty
• Fringe Benefit Tax
• Securities Transaction Tax
• Personal Income Tax
• Tax Incentives
Indirect Taxes
As hostile to the direct taxes, such a tax in the nation is normally levied on some specific services or some unique goods. An indirect tax is no longer levied on any specific organization or an individual. Almost all the activities, which fall within the periphery of the indirect taxation, are protected in the range beginning from manufacturing items and transport of offerings to those that are supposed for consumption.
Apart from these, the different things to do and services, which are associated to import buying and selling etc. are even covered inside this range.
This large range results in the involvement as well as implementation of some or other oblique tax in all lines of business.
Usually, the oblique taxation in the Indian Republic is a complicated process that involves legal guidelines and regulations, which are interconnected to every other.
These taxation guidelines even consist of some laws that are specific to some of the states of the country.
The regime of indirect taxation encompasses distinctive sorts of taxes.
The groups provide offerings in all or most of the associated fields, some of which are as follows:
• Anti-Dumping Duty
• Custom Duty
• Excise Duty
• Sales Tax
• Service Tax
• Value Added Tax or V. A. T.
Taxation Types:
(i) Proportional taxes,
(ii) Progressive taxes,
(iii) Regressive taxes and
(iv) Digressive taxes
Proportional Taxes:
Taxes in which the price of tax stays constant, even though the tax base changes, are called proportional taxes.
Here, the tax base may also be income, cash cost of property, wealth, or items etc. Income is, however, viewed as the fundamental tax base, because it is the determinant of taxable capability of a person.
In a proportional tax system, thus, taxes fluctuate in direct share to the change in income. If earnings are doubled, the tax quantity is additionally doubled. Thus, a proportional tax extracts a regular share of rising income.
Progressive Taxes:
Taxes in which the price of tax increases are known as innovative taxes. Thus, in an innovative tax, the quantity of tax paid will increase at a greater price than the amplify in tax base or income, for the taxation quantity is the product of multiplying the base through the charge and both these expand in a revolutionary tax.
Regressive Taxes:
When the charge of tax decreases as the tax base increases, the taxes are known as regressive taxes.
It must be referred to that in regressive taxation, although the whole quantity of tax increase on greater earnings in the absolute sense, in the relative sense, the tax rate declines on a greater income.
As such, highly a heavier burden (sacrifice involved) falls upon the negative than on the rich. Generally, taxes on necessaries are regressive as they take away a higher percentage of lower incomes as compared to greater incomes.
Thus, regressive taxation is unjust and inequitable. It does no longer comply with the canon of equity.
It tends to accentuate inequalities of earnings in the community.
Digressive Taxes:
Taxes which are mildly progressive, consequently now not very steep, so that excessive earnings earners do not make a due sacrifice on the foundation of equity, are known as digressive.
In digressive taxation, thus, the tax payable increases solely at a diminishing rate.
Diagrammatically, differences in progressive, proportional, regressive and digressive taxation are shown in Fig.
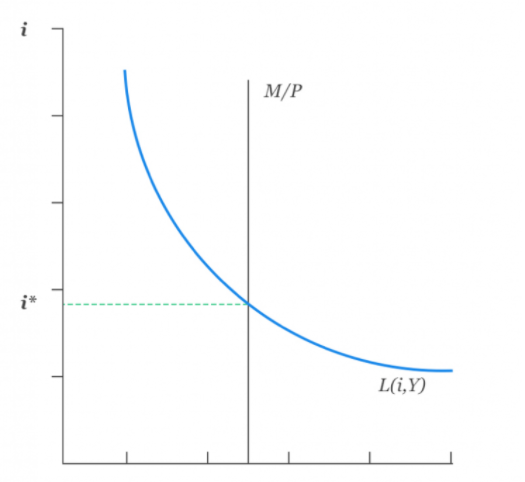
Fig. depicts the percentage of profits taken away in taxation under special tax rates. Tax line a represents a revolutionary tax rate, tax line b represents a proportional tax rate, tax line с suggests a regressive tax rate and tax line denotes a digressive tax rate.
The proportional tax charge has a regular slope, graphically, whilst the revolutionary tax rate has a rising fine slope.
The steeper the slope of the tax line, the modern the tax regime. The regressive tax charge line has a declining negative slope. The steeper the negative slope of the tax line, the more regressive the taxation. The digressive tax price line has a rising slope initially, but it turns into constant after a point.
Key Takeaways:
References:
1. Mankiw Gregory N. (2002), Principles of Economics, Thompson Asia
2. V. Mote, S. Paul, G. Gupta(2004), Managerial Economics, Tata McGraw Hill
3. Misra, S.K. and Puri (2009), Indian Economy, Himalaya
4. Pareek Saroj (2003), Textbook of Business Economics, Sunrise Publishers
5. M Chakravarty, Estimating, Costing Specifications & Valuation
