Unit-2
Shear strength
Mohr’s circle is a graphical representation of the different stresses in the form of a circle.
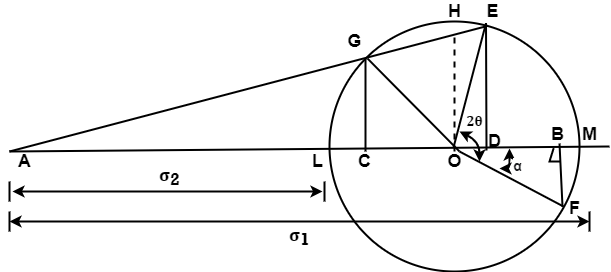
Mohr’s circle for mutually perpendicular stresses accompanied by simple shear
Here, another factor adds up where shear stress is also applied over the object with the two mutually perpendicular stresses.
σ1 = Major tensile stress
σ2 = Minor tensile stress
𝜏 = Shear stress
θ = Angle of the oblique plane made with the axis of minor principal stress
The procedure for drawing this Mohr’s circle is also the same and can be figured out easily by analyzing the diagram above.
Here,
AE = Resultant stress on the oblique plane
AD = Normal stress on the oblique plane
ED = Shear stress on the oblique plane
Value of Normal and Shear Stresses:
Maximum value of normal stress is given by,
 Max. Normal Stress
Minimum value of normal stress is given by,
 Min. Normal Stress
Maximum value of shear stress is given by,
 Max. Shear Stress
With the formulae given above, you can find the required data that will help solve structural problems
Mohr’s circle for 3 different cases which are as follows,
- Mohr’s Circle for Principal
- Tensile Stresses:(major stresses)

For mutually perpendicular tensile stresses
The figure shown above is the Mohr’s circle for a body which is subjected to 2 mutually perpendicular principal tensile stresses. Both the stresses are of unequal intensities.
Here,
σ1 = Major principal stress
σ2 = Minor principal stress
θ = Angle of the oblique plane made with the axis of minor principal stress
With these 3 quantities we can draw a Mohr’s circle. First of all, we would draw a horizontal line of the magnitude of ‘Major principal stress’ (here AB). We would mark a point (here C) so that the minor principal stress is shown on the same line.
Then a circle is drawn such that AB becomes the diameter of the circle. A line is drawn further from the center of the circle which is equal to its radius and makes an angle of 2θ with the horizontal line (here OE).
Drop a perpendicular from E as shown. With this done, AD and ED represent the normal and tangential stresses on the oblique plane respectively. Also, the length of AE will represent the magnitude of the resultant stress on the oblique plane.

Mohr’s circle for tensile and compressive stresses combined
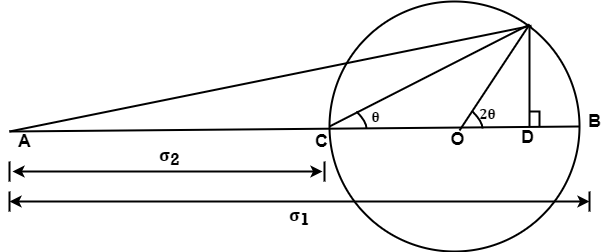
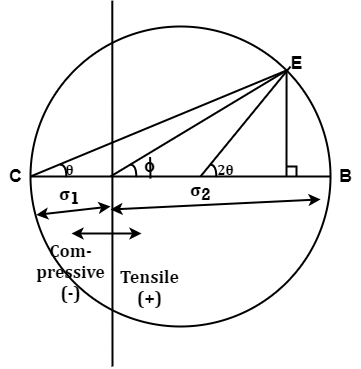
Here the stresses with being perpendicular are also unlike. One of the stresses is tensile while the other is compressive.
σ1 = Major principal stress (tensile)
σ2 = Minor principal stress (compressive)
θ = Angle of the oblique plane made with the axis of minor principal stress
First of all point A is taken and a horizontal line is drawn. Point B and C are located on this horizontal line such that AB and AC represent the tensile (σ1) and compressive (σ2) stresses respectively. The midpoint of BC would represent the center of the Mohr’s circle.
Point E is located at the intersection of the line drawn from point C at an angle of θ (the angle made by the oblique plane) and the circumference of the Mohr’s circle.
A perpendicular from the point E on BC at point D is drawn. AD and ED represent ‘Normal stress’ and ‘Shear stress’ on the oblique plane respectively
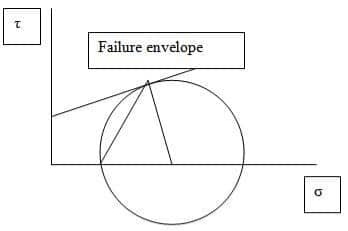
The soil is a particulate material. The shear failure in soils is by slippage of particles due to shear stresses. According to Mohr, the failure is caused by a critical combination of normal and shear stresses. The soil fails when the shear stress on the failure plane at failure is a unique function of the normal stress acting on that plane.
Since the shear stress of the failure plane is defined as the shear strength (s) the equation for that can be written as
S= f (![clip_image010[1]](https://glossaread-contain.s3.ap-south-1.amazonaws.com/epub/1642796112_608489.jpeg) )
)
The Mohr theory is concerned with the shear stress at failure plane at failure. A plot can be made between the shear stresses and the normal stress at failure. The curve defined by this is known as the failure envelope.
The shear strength of a soil at a point on a particular plane was expressed by Coulomb as a linear function of the normal stress on that plane as,

In this C is equal to the intercept on Y axis and phi is the angle which the envelope makes with X axis
The following tests are used to measure the shear strength of the soil
Depending upon the drainage conditions, there are three types of tests
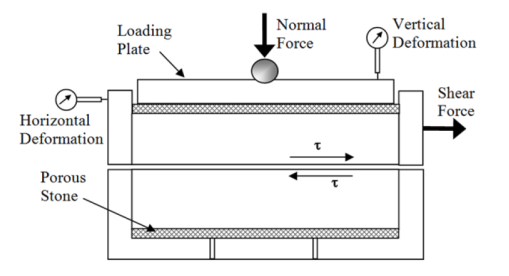
Apparatus
The test is conducted in a soil specimen in a shear box which is split into two halves along the horizontal plane at its middle. The size of the shear box is 60 x 60 x 50 mm. the box is divided horizontally such that the dividing plane passes through the centre.
The two halves are held together by locking pins the box is also provided with gripper plates plain or perforated according to the testing conditions
Test
A soil specimen of size 60 x 60 x 25 mm is taken. It is placed in the direct shear box and compacted. The upper grid plate, porous stone and pressure pad is placed on the specimen. Normal load and shear load is be applied till failure
Presentation of results
Merits
It is used for the determination of shear characteristics of all types of soils under different drainage conditions. In this a cylindrical specimen is stressed under conditions of axial symmetry. In the first stage of the test, the specimen is subjected to an all-round confining pressure on the sides, top and bottom.
This stage is known as the consolidation stage. In the second stage of the test called shearing stage, an additional axial stress and deviator stress is applied on the top of the specimen through a ram. Thus, the total stress in the axial direction at the time of shearing is equal to the confining stress plus the deviator stress.
The vertical sides of the specimen are principal planes. The confining pressure is the minor principal stress. The sum of the confining stress and deviator stress is the major principal stress. Triaxial apparatus consists of a circular base with a central pedestal. The specimen is placed on the pedestal.

The pedestal has one or two holes which are used in the drainage function or pore pressure measurement. A triaxial cell is placed to the base plate. It is a Perspex cylinder. There are three tie rods which support the cell. A central ram is there for applying axial stress. An air release valve and an oil release valve are attached to the cell.
The apparatus also has special features like,
Triaxial test on cohesive soil
CU, UU and CD tests can be conducted on soil specimen. The specimen is placed in the pedestal inside a rubber membrane. The confining pressure and axial pressure is applied till failure.
Triaxial test on cohesion less soil
The procedure is same as that in the cohesive soil only the sample preparation is different. A metal former, a membrane and a funnel are used for the sample preparation.
Unconfined Compression Test on Soil
The unconfined compression test is a special form of triaxial test in which the confining pressure is zero. The test can be conducted only on clayey soils which can stand without confinement. There are two types of UCC machines machine with a spring and machine with a proving ring
A compressive force is applied to the specimen till failure. The compressive load can be measured using a proving ring.
Presentation of results
In this test the minor principal stress is zero. The major principal stress is equal to the deviator stress. The Mohr circle can be drawn for stress conditions at failure.
Merits
For the UU test, the specimens (assumed to be saturated prior to test) are subjected to a confining fluid pressure in a triaxial chamber. Once the specimen is inside the triaxial cell, the cell pressure is increased to a predetermined value by rotating the knob of the constant pressure unit, and the specimen is brought to failure by increasing the vertical stress by applying a constant rate of axial strain. Since saturation and consolidation do not exist in this method, original structure and water content of sample is untouched. Pore and back pressures are not measured during this test and therefore the results can only be interpreted in terms of total stress over a confinement pressure (stress).
These tests are generally carried out on three specimens of the same sample subjected to different confining stresses.
Since all specimens are supposedly saturated the shear strength are similar for all tests.
The results of the test are plotted as curves of principal stress difference against strain. For conditions of maximum principal stress difference (taken as failure) Mohr circles are plotted in terms of total stress. The average undrained shear strength is recorded, and the failure (Mohr) envelope is drawn tangential to the Mohr circles in order to find the “undrained cohesion intercept” and undrained “angle of shearing resistance”
Once consolidation is complete, the specimen is to be isolated from the back pressure and the rate of vertical movement of the compression machine platen set according to result of consolidation. During the shear stage the vertical stress is increased by the loading ram, and measurements are made at regular intervals of deformation, ram load and pore pressure. These are converted to graphs of principal stress difference (σ1- σ3) and pore pressure as a function of strain, and failure is normally taken as the point of maximum principal stress difference. The effective stress Mohr circles are plotted for the failure conditions of the three specimens which has been subjected to different consolidation level, and the gradient and intercept of a straight line drawn tangential to these circles defines the effective strength parameters c' and φ'.
The consolidated drained triaxial compression test, with volume change measurement during shear is carried out in a similar sequence to the consolidated undrained test, but during shear the back pressure remains connected to the specimen which is loaded sufficiently slowly to avoid the development of excess pore pressures.
The shear stage of a drained triaxial test can be expected to take between 7 and 15 times longer than that of an undrained test with pore pressure measurement.
Once shearing is complete, the results are presented as graphs of principal stress difference and volume change as a function of strain, and the failure Mohr circles are plotted to give the drained failure envelope defined by the parameters cd' and φd' .
Triaxial CD-CU-UU equipment is computer controlled, test values can be transferred to computer and data processing can be made with Triaxial software on Windows operating system. All data can be used on Excel programs.
The load data and axial displacement data are transferred and recorded through U-Touch PRO Control Unit to the software.
Three pressure data (cell pressure, back pressure and pore pressure) from triaxial cell and volume change data transferred and recorded through the interface unit with 4 channels for data acquisition (UTCU-0320) to the software.
Pore pressure parameters under undrained loading Soils in nature are at equilibrium under their overburden pressure. If the same soil is subjected to an instantaneous additional loading, there will be development of pore pressure if drainage is delayed under the loading. The magnitude of the pore pressure depends upon the permeability of the soil, the manner of application of load, the stress history of the soil, and possibly many other factors. If a load is applied slowly and drainage takes place with the application of load, there will practically be no increase of pore pressure
Pore pressure is the pressure exerted by the fluids within a rock’s pore space. Pore pressure can be calculated via a variety of methods from either well logs or seismic velocities. The gradient is called PPG or pore pressure gradient. Pore pressure gradient can be determined either from well logs (Resistivity log and Sonic log) or from seismic interval velocity.
There are several pore pressure techniques already in use, but one of the most popular methods was designed by Ben Eaton. These pore pressure equations can be converted from using either well logs or interval velocity as input.
 For sonic log data, Eaton’s method is expressed as:
where:

 = pore pressure gradient (psi/ft)

 = overburden gradient (psi/ft)

 = hydrostatic gradient (psi/ft)

 = normal sonic log value (us/ft)

 = observed sonic log value (us/ft)

 = exponent value which is dependent on formation properties
 For seismic velocity data, Eaton's method is expressed as:
where:

 = pore pressure gradient (psi/ft)

 = overburden gradient (psi/ft)

 = hydrostatic gradient (psi/ft)

 = observed interval velocity (ft/s)

 = interval velocity from normal compaction trend (ft/s)

 = exponent value which is dependent on formation properties
Overpressure and Effective Stress
From the above pressures we can derive overpressure and effective stress. Overpressure is defined as the difference between the internal fluid pressures of a rock's pore space and the hydrostatic or normal pressure.
High overpressures can be particularly dangerous and is one of the reasons why pore pressure analysis is necessary in order to protect the well-being of bystanders and to avoid drilling catastrophes.
The effective stress is defined as the difference between the pressure caused by the overburden material and the internal fluid pressures of a rock's pore space.
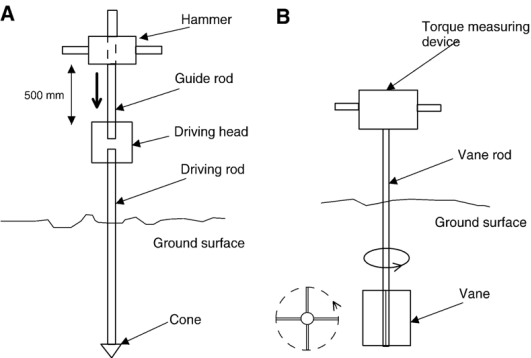
The undrained strength of soft clays can be determined in a laboratory by vane shear test. The test can also be conducted in the field on the soil at the bottom of bore hole. The apparatus consists of a vertical steel rod having four thin stainless-steel blades or vanes fixed at its bottom end.
Height of the vane should be equal to twice the diameter. For conducting test in a laboratory, a specimen of diameter 38mm and height 75mm is prepared and fixed to the base of the apparatus.
The vane is slowly lowered into the specimen till the top of the vane is at a depth of 10 to 20 mm below the top of the specimen. The readings of the strain indicator and torque indicator are taken
Shear strength S

Where T =Torque applied
D = Diameter of vane
H1= Height of vane
Merits
Demerits
References:
1. Soil Mechanics by Craig R.F., Chapman & Hall
2. Fundamentals of Soil Engineering by Taylor, John Wiley & Sons
3. An Introduction to Geotechnical Engineering, by Holtz R.D. and Kovacs, W.D., Prentice Hall, NJ
4. Principles of Geotechnical Engineering, by Braja M. Das, Cengage Learning
5. Principles of Foundation Engineering, by Braja M. Das, Cengage Learning
6. Essentials of Soil Mechanics and Foundations: Basic Geotechnics by David F. McCarthy
7. Soil Mechanics in Engineering Practice by Karl Terzaghi, Ralph B. Peck, and Gholamreza Mesri.
8. Geotechnical Engineering: Principles and Practices of Soil Mechanics and Foundation
Engineering (Civil and Environmental Engineering) by V.N.S. Murthy