Unit – 6
Overview of Computer Graphics
Graphic communication as the name suggests
Is communication using graphic elements. These elements include symbols such as glyphs and icons, images such as drawings and photographs, and can include the passive contributions of substrate, color and surroundings. It is the process of creating, producing, and distributing material incorporating words and images to convey data, concepts, and emotions.
The field of graphic communications encompasses all phases of the graphic communications processes from origination of the idea (design, layout, and typography) through reproduction, finishing and distribution of two- or three-dimensional products or electronic transmission.
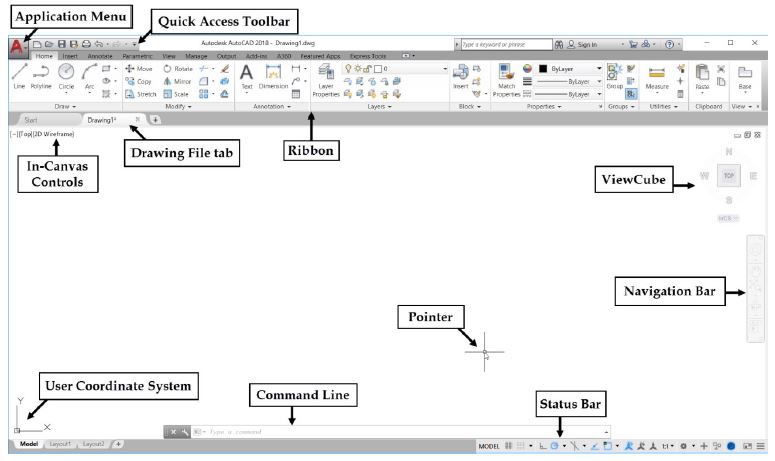
On the Initial Screen, click Start Drawing to open a new drawing file. The drawing file consists of a graphics window, ribbon, menu bar, toolbars, command line, and other screen components, depending on the workspace that you have selected.
Workspaces in AutoCAD
There are three workspaces available in AutoCAD: Drafting & Annotation, 3D Basics, and 3D Modeling. By default, the Drafting & Annotation workspace is activated. You can create 2D drawings in this workspace. You can also activate other workspaces by using the Workspace drop-down on the top-left corner or the Workspace Switching menu on the lower-right corner of the window.
Drafting & Annotation Workspace
This workspace has all the tools to create a 2D drawing. It has a ribbon located at the top of the screen. The ribbon is arranged in a hierarchy of tabs, panels, and tools. Panels such as Draw, Modify, and Layers consist of tools which are grouped based on their usage. Panels in turn are grouped into various tabs. For example, the panels such as Draw, Modify, and Layers are located in the Home tab.

Application Menu
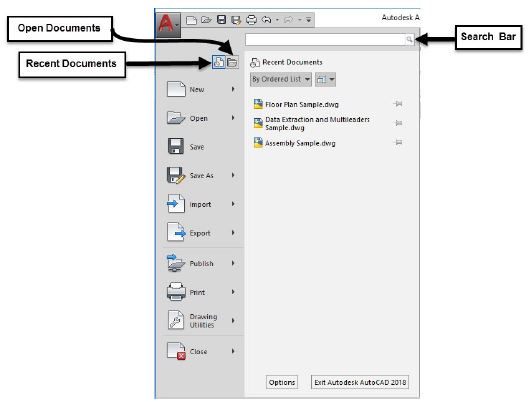
The Application Menu appears when you click on the icon located at the top left corner of the window. The Application Menu consists of a list of self-explanatory menus. You can see a list of recently opened documents or a list of currently opened documents by clicking the Recent Documents and Open Documents buttons, respectively. The Search Bar is used to search for any command. You can type any keyword in the search bar and find a list of commands related to it.
Quick Access Toolbar
This is located at the top left corner of the window and helps you to access commands, quickly. It consists of commonly used commands such as New, Save, Open, Save As, and so on.

Navigation Bar
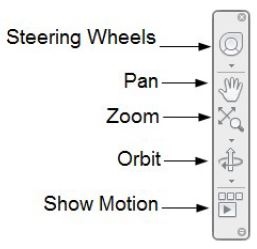
The Navigation Bar contains navigation tools such as Steering wheel, Pan, Zoom, Orbit, and Show Motion.
Setting Grid and Snap
Grid is the basic drawing setting. It makes the graphics window appear like a graph paper. You can turn ON the grid display by clicking the Grid icon on the status bar or just pressing F7 on the keyboard.
Snap is used for drawing objects by using the intersection points of the grid lines. When you turn the Snap Mode ON, you will be able to select only grid points. In the following example, you will learn to set the grid and snap settings.
Setting the Limits of a drawing
You can set the limits of a drawing by defining its lower-left and top-right corners. By setting Limits of a drawing, you will define the size of the drawing area. In AutoCAD, limits are set to some default values. However, you can redefine the limits to change the drawing area as per your requirement.
Type Limits at the command line and press ENTER.

Type 0,0 and press ENTER to define the lower limit.
Now, you need to define the upper limit.
Type 80,50 and press ENTER key.
On the Navigate Bar, click Zoom > Zoom All; the graphics window will be zoomed to the limits.
Setting the Lineweight
Line weight is the thickness of the objects that you draw. In AutoCAD, there is a default lineweight assigned to objects. However, you can set a new lineweight. The method to set the lineweight is explained below.
On the Status bar, click the Customization  option, and then select LineWeight from the flyout. This shows the LineWeight icon on the status bar.
Activate the Show/Hide Lineweight  icon located on the status bar.
Right click on the Show/Hide Lineweight icon, and then select Lineweight Settings. The Lineweight Settings dialog appears.
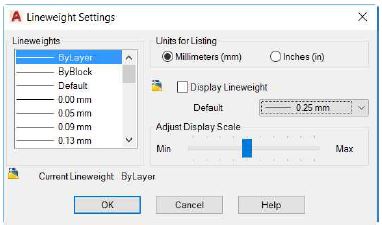
On the Lineweight Settings dialog, select 0.40 mm from the Default drop-down.
Click OK.
Type L in the command line and press ENTER.
Type 10,10 and press ENTER to define the first point.
Move the pointer horizontally toward right and click on the sixth grid point from the first point.
Move the pointer vertically upwards and select the third grid point from the second point.
Move the pointer horizontally toward left and select the second grid point from the previous point.
Using Ortho mode and Polar Tracking
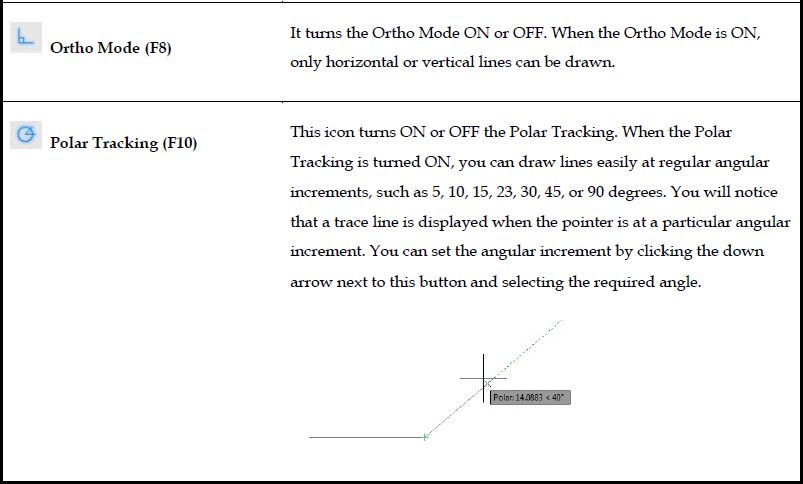
Ortho mode is used to draw orthogonal (horizontal or vertical) lines. Polar Tracking is used to constrain the lines to angular increments. In the following example, you will create a drawing with the help of Ortho Mode and Polar Tracking.
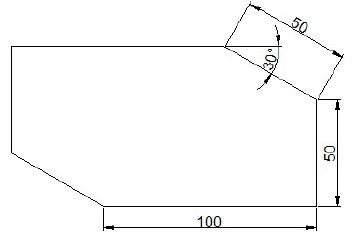
Open a new AutoCAD file.
Deactivate the Grid Display and Snap Mode icons on the status bar.
Click the Ortho Mode icon on the status bar.
Click Zoom All on the Navigation Bar.
Click the Line button on the Draw panel.
Select an arbitrary point to define the starting point.
Move the pointer toward right, type 100 and press ENTER; you will notice that a horizontal line is created.
Move the pointer upwards, type 50 and press ENTER; you will notice that a vertical line is created.
Click the Polar Tracking icon on the status bar.
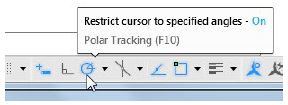
Click the down arrow next to the Polar tracking icon and select 30 from the menu.
Using Object Snaps
Object Snaps are important settings that improve your performance and accuracy while creating a drawing. They allow you to select key points of objects while creating a drawing. You can activate the required Object Snap by using the Object snap shortcut menu. Press and hold the SHIFT key and right-click to display this shortcut menu. Note that the object snaps can be used only when a drawing command is active.
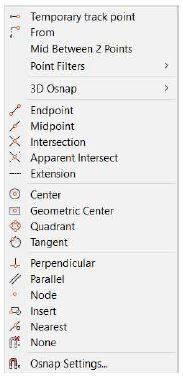
The functions of various Object Snaps are explained next.
Endpoint: Snaps to the endpoints of lines and arcs.
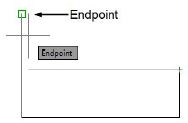
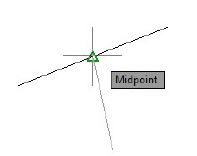
Midpoint: Snaps to the midpoint of a line.
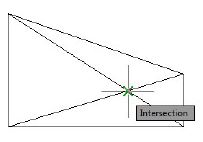
Intersection: Snaps to the intersections of objects.
Extension: Creates a temporary extension line when the pointer passes through the endpoints of a line or an arc. You can pick points along the temporary extension lines.

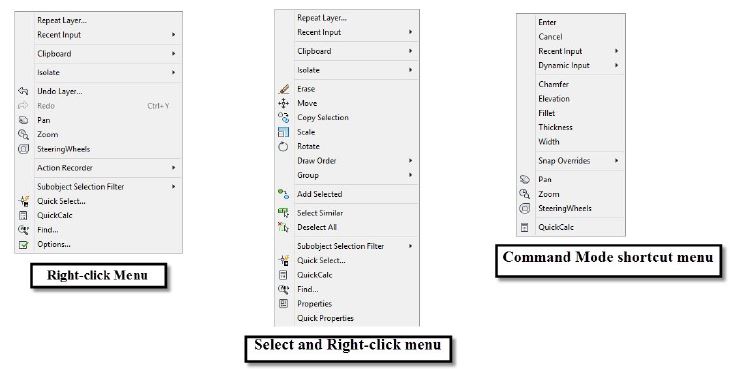
Shortcut Menus appear when you right-click in the graphics window. AutoCAD provides various shortcut menus in order to help you access tools and options very easily and quickly. There are various types of shortcut menus available in AutoCAD. Some of them are discussed next.
Right-click Menu
This shortcut menu appears whenever you right-click in the graphics window without activating any command or selecting any object.
Select and Right-click menu
This shortcut menu appears when you select an object from the graphics window and right-click. It consists of editing and selection options.
Command Mode shortcut menu
This shortcut menu appears when you activate a command and right-click. It shows options depending upon the active command. The shortcut menu below shows the options related to the RECTANGLE command.
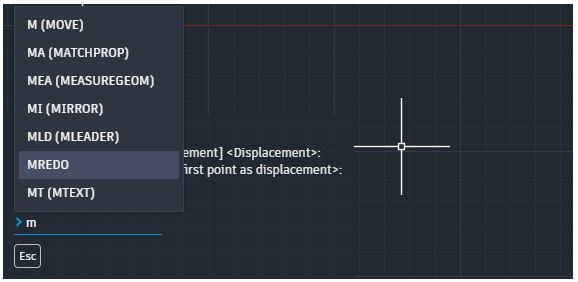
The command line is docked in the bottom left of the drawing area and displays prompts, options, and messages. The command line is used to input commands, typically by using a keyboard, as an alternative to using the command palette that is in the bottom of the left-side panel.

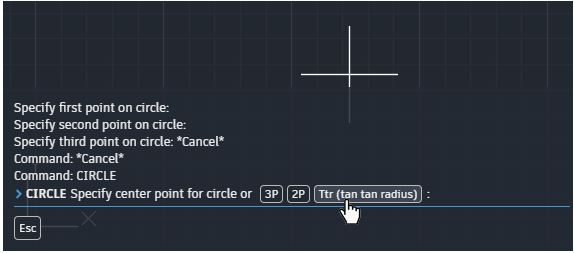
Notice that as you start to type a command, you'll see command suggestions. When several possibilities are available such as in the example below, you can make your choice by clicking the desired option, or by using the arrow keys and then pressing Enter.
When a command is in progress, or "active," you might see prompts or options within the command. For instance, in the example below, if the CIRCLE command is active, and you want to switch the specification style for a circle to 3-point, 2-point, or tangent-tangent-radius, you can use the command line.
Status Bar
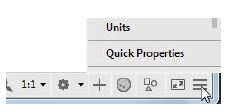
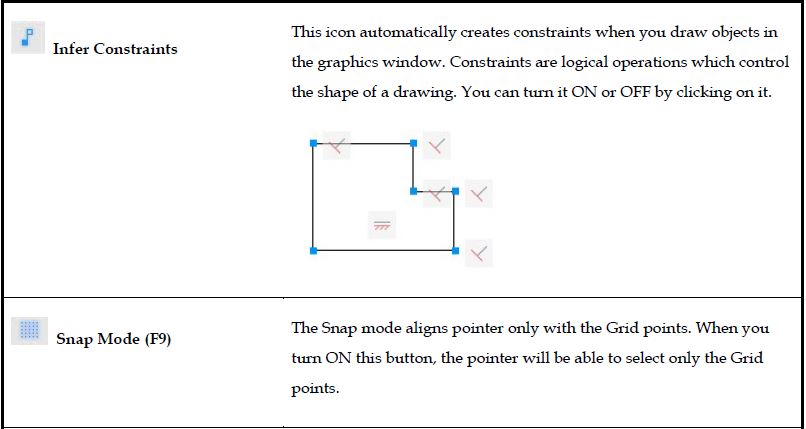
Status Bar is located at the bottom of the AutoCAD window. It contains many buttons which help you to create a drawing very easily. You can turn ON or OFF these buttons just by clicking on them. Some buttons are hidden by default. You can display more buttons on the status bar by clicking the Customization button at the bottom right corner and selecting the options from the menu. The buttons available on the status bar are briefly discussed in the following section.
Using Zoom tools
Using the zoom tools, you can magnify or reduce a drawing. You can use these tools to view the minute details of an overly complicated drawing. The Zoom tools can be accessed from the Navigation Bar, Command line, and Menu Bar.


Zooming with the Mouse Wheel
Zooming using the mouse wheel is one of the easiest methods.
Roll the mouse wheel forward to zoom into a drawing.
Roll the mouse wheel backwards to zoom out of the drawing.
Press the mouse wheel and drag the mouse to pan the drawing.
Using Zoom Extents
Using the Zoom Extents tool, you can zoom to the extents of the largest object in a drawing.
Click Zoom Extents on the Navigation Bar.
You can also double-click on the mouse wheel to zoom to extents.
Using Zoom-Window
Using the Zoom-Window tool, you can define the area to be magnified by selecting two points representing a rectangle.
Click Zoom > Zoom Window on the Navigation Bar.
Specify the first point of the zoom window, as shown.
Move the pointer diagonally toward right, and then specify the second point, as shown.
The area inside the window will be magnified.
Using Zoom-Previous
After magnifying a small area of the drawing, you can use the Zoom-Previous tool to return to the previous display.
Click Zoom > Zoom Previous on the Navigation Bar.

Erase: This command deletes the selected entities. A record of entities erased is always maintained. The most recent entity can be unerased by OOPS command.
The three lines CB, CD and CG meeting at the point C and making 120° angles with each other are termed isometric axes. The lines parallel to these axes are called isometric lines. The planes representing the faces of the cube as well as other planes parallel to these planes are called isometric planes.
Isometric scale:
As all the edges of the cube are equally foreshortened, the square faces are rhombuses. The rhombus ABCD (fig. 2) shows the isometric projection of the top square face of the cube in which BO is the true length of the diagonal.
Construct a square BQDP around BO as a diagonal. Then BP shows the true length of BA.
In triangle ABO, 
In triangle PBO, 

The ratio,  .
.
Thus, the isometric projection is reduced in the ratio  , i.e., the isometric lengths are 0.815 of the true lengths.
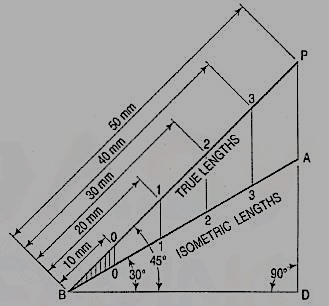
Therefore, while drawing an isometric projection, it is necessary to convert true lengths into isometric lengths for measuring and marking the sizes. This is conveniently done by constructing and making use of an isometric scale as shown below.
a) Draw a horizontal line BO of any length (fig.). At the end B, draw lines BA and BP, such that L OBA = 30° and L OBP = 45°.Mark divisions of true length on the line BP and from each division-point, draw verticals to BO meeting BA at respective points. The divisions thus obtained on BA give lengths on isometric scale.
(b) The same scale may also be drawn with divisions of natural scale on a horizontal line AB (fig.). At the ends A and B, draw lines AC and BC making 15° and 45° angles with AB respectively, and intersecting each other at C.
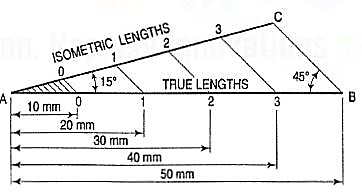
From division-points of true lengths on AB, draw lines parallel to BC and meeting AC at respective points. The divisions along AC give lengths to isometric scale.
The lines BO and AC (fig) represent equal diagonals of a square face of the cube, but are not equally shortened in isometric projection. BO retains its true length, while AC is considerably shortened. Thus, it is seen that lines which are not parallel to the isometric axes are not reduced according to any fixed ratio. Such lines are called non-isometric lines. The measurements should, therefore, be made on isometric axes and isometric lines only. The non-isometric lines are drawn by locating positions of their ends on isometric planes and then joining them.
References:
1 Bhatt N.D., Panchal V.M. & Ingle P.R., (2014), Engineering Drawing, Charotar Publishing House
2 Shah, M.B. &Rana B.C. (2008), Engineering Drawing And Computer Graphics, Pearson Education
3 Agrawal B. & Agrawal C. M. (2012), Engineering Graphics, Tmh Publication
4 Narayana, K.L. & P Kannaiah (2008), Text Book On Engineering Drawing, Scitech publishers
5 (Corresponding Set Of) Cad Software Theory And User Manuals