Unit – 1
Introduction
Expert systems called as knowledge-based systems, are systems that integrates the knowledge and analytical skills of human experts .Turban defines such system as:”a computer program that simulates the judgment, and behaviour of a human or an organization that has expert knowledge, and experience in a particular field” [Tur92].
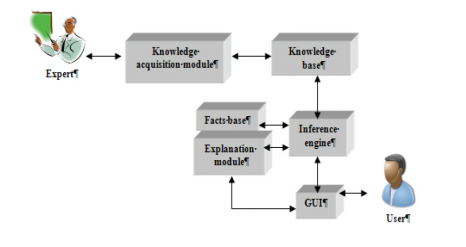
An expert system includes the following components:
- Knowledge base contains the knowledge obtained from human experts of a specific area.
- Facts base embodies data from a problem to be resolved as well as the facts, resulted from the reasoning made by inference engine over the knowledge base
- Inference engine that is the module that performs the transformation
- Explanation module presents the justification of the reasoning made by the inference engine in accessible forms
- Knowledge acquisition module converts the human expert’s knowledge in the appropriate form for the system use and the graphic user interface (GUI), through which users can access the expert system.

It starts from facts, activates the correspondent knowledge from the knowledge base, and builds the reasoning which leads to new facts. Majorly used technique for knowledge representation is rule-based. A rule based system has the form “IF condition THEN action”. For rule-based expert system, the domain knowledge is given as sets of certain rules that are checked over a large number of facts or knowledge about the current situation. In case IF section of a rule is satisfied by the facts, the action specified by the THEN section is performed. The IF section of a rule is compared or matched with the facts, and rules whose IF section matches the facts are executed. These actions may modify the set of facts in the knowledge base. The biggest problem in development of an efficient expert system is to build a good knowledge base. A knowledge base should be complete, consistent, coherent and non-redundant. In order to do that, knowledge acquisition is one of the main problems. Obviously each domain provide several sources of knowledge, as specialized literature or human experts, but the modern achievements in data processing area could offer new possibilities to enrich a knowledge base. Data mining is one of the modern achievements in data processing .
Identifying the data mining operations
- Classification – Classification classifies data into different buckets/classes based on constraints or rules. Classification categorizes large data sets into a category of class labels o training data sets .Classification can be used to select medical treatment based on diagnosis of patient’s medical condition, classifying individuals in different credit groups based on their financial data and segregating individual loan applicants in different credit risk parameters. Most used classification algorithms are:
- Naive Bayes
- SVM (Support Vector Machines)
- k-nearest neighbour classifier
- ANN (Artificial Neural Network)
2. Regression – The basic difference between regression and classification is that output is categorized in classification and is numeric output in regression although both of them are used in prediction. Regression is helpful in predicting the real value variable. Traditional data models are developed using statistical methods like linear and logistics regression.
Some examples for regression operation are:
a) Evaluating the crime rate of a city based on various parameters
b) Factors like location, floor area, etc. helping in calculation of property value
c) Insured scoring systems (like in auto insurance) to predict likelihood of an insured meeting with an accident, etc.
Generalized Linear Models (GLM) can be used for linear and Support Vector Machines (SVM) for both linear and nonlinear regression.
3. Segmentation – Here clusters of records are identified, which can be mutually exclusive and exhaustive and can have hierarchical categories, with same behaviours. It is commonly used in marketing to discover homogenous groups of customers and segment them according to their lifestyle, geography etc.
4. Link Analysis – Link analysis is used to evaluate connections or relationships between nodes/records. It is used in marketing product affinity, where the seller tries to make association to what all things could be sold together. This technique is used in insurance to detect fraud by identifying the claims patterns through network visualization. Link analysis is used in combination with segmentation analysis in most of the cases.
5. Deviation – This technique helps to know any deviations or outliers or any unusual patterns in the data due to anomalies or exceptions over a period of fixed time series.
Data mining is highly effective, so long as it draws upon one or more of these techniques:
1. Tracking patterns. One of the most basic techniques in data mining is learning to recognize patterns in your data sets. This is usually recognition of some aberration in your data happening at regular intervals, or an ebb and flow of a certain variable over time. For example, you might see that your sales of a certain product seem to spike just before the holidays, or notice that warmer weather drives more people to your website
.
2. Classification. Classification is a more complex data mining technique that forces you to collect various attributes together into discernable categories, which you can then use to draw further conclusions, or serve some function. For example, if you’re evaluating data on individual customers’ financial backgrounds and purchase histories, you might be able to classify them as “low,” “medium,” or “high” credit risks. You could then use these classifications to learn even more about those customers.
3. Association. Association is related to tracking patterns, but is more specific to dependently linked variables. In this case, you’ll look for specific events or attributes that are highly correlated with another event or attribute; for example, you might notice that when your customers buy a specific item, they also often buy a second, related item. This is usually what’s used to populate “people also bought” sections of online stores.
4. Outlier detection. In many cases, simply recognizing the overarching pattern can’t give you a clear understanding of your data set. You also need to be able to identify anomalies, or outliers in your data. For example, if your purchasers are almost exclusively male, but during one strange week in July, there’s a huge spike in female purchasers, you’ll want to investigate the spike and see what drove it, so you can either replicate it or better understand your audience in the process.
5. Clustering. Clustering is very similar to classification, but involves grouping chunks of data together based on their similarities. For example, you might choose to cluster different demographics of your audience into different packets based on how much disposable income they have, or how often they tend to shop at your store.
6. Regression. Regression, used primarily as a form of planning and modeling, is used to identify the likelihood of a certain variable, given the presence of other variables. For example, you could use it to project a certain price, based on other factors like availability, consumer demand, and competition. More specifically, regression’s main focus is to help you uncover the exact relationship between two (or more) variables in a given data set.
7. Prediction. Prediction is one of the most valuable data mining techniques, since it’s used to project the types of data you’ll see in the future. In many cases, just recognizing and understanding historical trends is enough to chart a somewhat accurate prediction of what will happen in the future. For example, you might review consumers’ credit histories and past purchases to predict whether they’ll be a credit risk in the future.

Reference Books
1 Data Mining : Next Generation Challenges and Future Direction by Kargupta, et al, PHI.
2 Data Warehousing, Data Mining & OLAP by Alex Berson Stephen J.Smith.