Unit 4
Introduction to Controller Design
A system is said to be stable, if its output is under control. Otherwise, it is said to be unstable. A stable system produces a bounded output for a given bounded input.
Absolutely Stable System
If the system is stable for all the range of system component values, then it is known as the absolutely stable system. The open loop control system is absolutely stable if all the poles of the open loop transfer function present in left half of ‘s’ plane. Similarly, the closed loop control system is absolutely stable if all the poles of the closed loop transfer function present in the left half of the ‘s’ plane.
Conditionally Stable System
If the system is stable for a certain range of system component values, then it is known as conditionally stable system.
Marginally Stable System
If the system is stable by producing an output signal with constant amplitude and constant frequency of oscillations for bounded input, then it is known as marginally stable system. The open loop control system is marginally stable if any two poles of the open loop transfer function is present on the imaginary axis. Similarly, the closed loop control system is marginally stable if any two poles of the closed loop transfer function is present on the imaginary axis
The deviation of the output of control system from desired response during steady state is known as steady state error from which we get steady state accuracy. It is represented as ess. We can find steady state error using the final value theorem as follows.

E(s) is the Laplace transform of the error signal, e(t)
Steady State Errors for Unity Feedback Systems
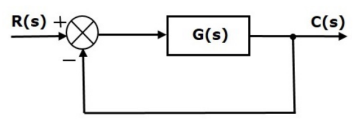
We know the transfer function of the unity negative feedback closed loop control system as


The output of the summing point is –

Substitute C(s) value in the above equation


Substitute E(s) value in the steady state error formula

The following table shows the steady state errors and the error constants for standard input signals like unit step, unit ramp & unit parabolic signals.
Input Signal | Steady state error | Error constant |
Unit step signal |  |  |
Unit ramp signal |  |  |
Unit parabolic signal |  |  |
Where, Kp, Kv and Ka are position error constant, velocity error constant and acceleration error constant respectively.
Steady State Errors for Non-Unity Feedback Systems
Consider the following block diagram of closed loop control system, which is having nonunity negative feedback.
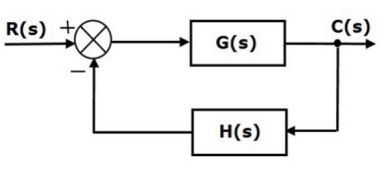
We can find the steady state errors only for the unity feedback systems. So, we have to convert the non-unity feedback system into unity feedback system. For this, include one unity positive feedback path and one unity negative feedback path in the above block diagram. The new block diagram looks like as shown below.
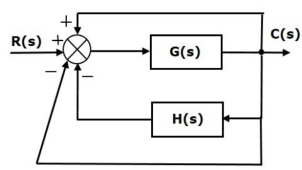
Simplify the above block diagram by keeping the unity negative feedback as it is. The following is the simplified block diagram.
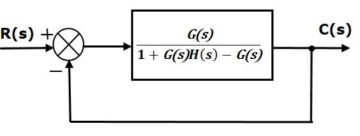
This block diagram resembles the block diagram of the unity negative feedback closed loop control system. Here, the single block is having the transfer function
 instead of G(s). You can now calculate the steady state errors
By using steady state error formula given for the unity negative feedback systems.
Transient response of control system means changing so, this occurs mainly after two conditions and these two conditions are written as follows-
- Condition one: Just after switching ‘on’ the system that means at the time of application of an input signal to the system.
- Condition second: Just after any abnormal conditions. Abnormal conditions may include sudden change in the load, short circuiting etc.
The most important effect of feedback in a control system is the control and partial elimination of the effects of disturbance signals. A feedback control system with a disturbance input is shown in figure. Ns) is plant transfer function from the disturbance input w(t) to output y(t).
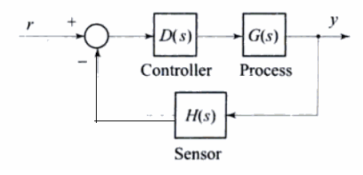

With R(s)=0 the system output becomes

For the open loop system,

It can readily be seen that feedback reduces the effect of feedback on control system. Thus, to reject disturbances, the loop gain must be increased in manner such that disturbance input from the system output is not increased.
Robustness is the ability of the closed loop system to be insensitive to component variations. It is one of the most useful properties of feedback. Robustness is also what makes it possible to design feedback system based on strongly simplified models.
The system said to be robust if it works well under high-gain feedback to reject the disturbance gained by the system and eliminate the effect the system parameter uncertainty.
An important point of all feedback control synthesis methods is the control engineer’s awareness of inherent trade–offs: increasing the robustness will generally make the controller “less aggressive”, and will there by decrease system performance. Robust control allows to specify more or less directly the plant uncertainty, and allows to predict the possible trade–offs between robustness and closed–loop performance.
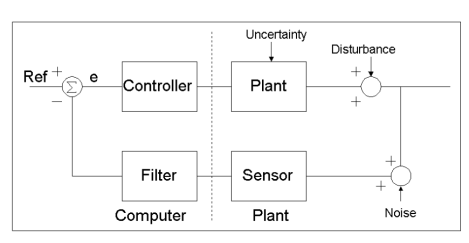
Figure shows an expanded view of the simple control loop. Uncertainty is shown entering the system in three places. There is uncertainty in the model of the plant.
There are disturbances that occur in the plant system. Also, there is noise which is read on the sensor inputs. Each of these uncertainties can have an additive or multiplicative component. Robust methods aim to achieve robust performance and/or stability in the presence of small modelling error.
Root locus analysis is a graphical method for examining how the roots of a system change with variation of a certain system parameter, commonly a gain within a feedback system.
By using this method, the designer can predict the effects on the location of the closed-loop poles of varying the gain value OR adding open-loop poles and/or open-loop zeros.
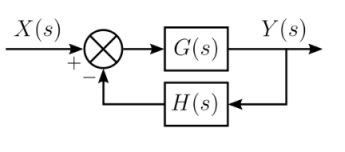
For this system, the closed-loop transfer function is given by

Thus, the closed-loop poles of the closed-loop transfer function are the roots of the characteristic equation 1+G(S)H(S). The roots of this equation may be found wherever G(S)H(S)= -1 .
In systems without pure delay, the product G(S)H (S is a rational polynomial function and may be expressed as

Typically, a root locus diagram will indicate the transfer function's pole locations for varying values of the parameter K. A root locus plot will be all those points in the s-plane where G(S)H(S)= -1 for any value of K.
Sketching root locus
Using a few basic rules, the root locus method can plot the overall shape of the path (locus) traversed by the roots as the value of K varies. The plot of the root locus then gives an idea of the stability and dynamics of this feedback system for different values of K.
- Mark open-loop poles and zeros
- Mark real axis portion to the left of an odd number of poles and zeros
- Find asymptotes
- The asymptotes intersect the real axis at α (which is called the centroid) and depart at angle φ given by


Where  is the sum of all the locations of the poles, and
  is the sum of the locations of the explicit zeroes?
- Phase condition on test point to find angle of departure
- Compute breakaway/break-in points
The breakaway points are located at the roots of the following equation:

Once you solve for z, the real roots give you the breakaway/re-entry points. Complex roots correspond to a lack of breakaway/re-entry.
Consider the transfer function of the second order closed loop control system as


Let,  substitute this value in the above equation

Magnitude of  is: -
is: -

Phase of  is: -
is: -

The frequency domain specifications are resonant peak, resonant frequency and bandwidth
Resonant Frequency
It is the frequency at which the magnitude of the frequency response has peak value for the first time. It is denoted by ωr . At ω=ωr, the first derivate of the magnitude of T(jω) is zero.
Differentiate M with respect to u


Substitute  and
and  in the above equation

Substitute  in the above equation


Resonant Peak
It is the peak (maximum) value of the magnitude of T(jω). It is denoted by Mr.
At  , the magnitude of T(jω) is-

Substitute, and 1-
 in the above equation


Resonant peak in frequency response corresponds to the peak overshoot in the time domain transient response for certain values of damping ratio δ. So, the resonant peak and peak overshoot are correlated to each other.
Bandwidth
It is the range of frequencies over which, the magnitude of T(jω) drops to 70.7% from its zero-frequency value.

Bandwidth ωb in the frequency response is inversely proportional to the rise time tr in the time domain transient response.
In the frequency-response approach, we specify the transient-response performance in an indirect manner. That is, the transient-response performance is specified in terms of the phase margin, gain margin, resonant peak magnitude, the gain crossover frequency, resonant frequency, band width (they give a rough estimate of the speed of transient response); and static error constants (they give the steady-state accuracy).
Although the correlation between the transient response and frequency response is indirect, the frequency domain specifications can be conveniently met in the Bode diagram approach.
After the open loop has been designed by the frequency-response method, the closed-loop poles and zeros can be determined. The transient-response character must be checked to see whether the designed system satisfies the requirements in the time domain. If it does not, then the compensator must be modified and the analysis repeated until a satisfactory result is obtained.
The frequency-response plot indicates clearly the manner in which the system should be modified.
There are basically two approaches in the frequency-domain design. One is the polar plot approach and the other is the Bode diagram approach.
When a compensator is added, the polar plot does not retain the original shape, and, therefore, we need to draw a new polar plot, which will take time and is thus inconvenient.
On the other hand, a Bode diagram of the compensator can be simply added to the original Bode diagram, and thus plotting the complete Bode diagram is a simple matter. Also, if the open-loop gain is varied, the magnitude curve is shifted up or down without changing the slope of the curve, and the phase curve remains the same. For design purposes, therefore, it is best to work with the Bode diagram.
A controller is a mechanism that seeks to minimize the difference between the actual value of a system (i.e. the process variable) and the desired value of the system (i.e. the setpoint).
The important uses of the controllers include:
- Controllers improve the steady-state accuracy by decreasing the steady state error.
- As the steady-state accuracy improves, the stability also improves.
- Controllers also help in reducing the unwanted offsets produced by the system.
- Controllers can control the maximum overshoot of the system.
- Controllers can help in reducing the noise signals produced by the system.
- Controllers can help to speed up the slow response of an overdamped system
Proportional Controllers
A very important application of proportional controller with fixed bias or offset id the zero-load process. It means the dynamic characteristics of process will not get any disturbance even if there is no flow through the controller for small duration. This introduces the proportional controller can be used for temperature control of any material or fluid.
For a proportional controller, there are two conditions and these are written below:
- The deviation should not be large; i.e. there should not be a large deviation between the input and output.
- The deviation should not be sudden.
In a proportional controller the output (also called the actuating signal) is directly proportional to the error signal

Removing the sign of proportionality, we have,

Where Kp is proportional constant also known as controller gain.
It is recommended that Kp should be kept greater than unity. If the value of Kp is greater than unity (>1), then it will amplify the error signal and thus the amplified error signal can be detected easily.
Integral Controllers
As the name suggests in integral controllers the output (also called the actuating signal) is directly proportional to the integral of the error signal

Removing the sign of proportionality, we have

Where Ki is an integral constant also known as controller gain. The integral controller is also known as reset controller.
Derivative Controllers
We never use derivative controllers alone. It should be used in combinations with other modes of controllers because of its few disadvantages which are written below:
- It never improves the steady-state error.
- It produces saturation effects and also amplifies the noise signals produced in the system.
Now, as the name suggests in a derivative controller the output (also called the actuating signal) is directly proportional to the derivative of the error signal.

Removing the sign of proportionality, we have,

Where, Kd is proportional constant also known as controller gain. The derivative controller is also known as the rate controller.
The major advantage of a derivative controller is that it improves the transient response of the system.
Phase Lead Compensation
A system which has one pole and one dominating zero (the zero which is closer to the origin than all over zeros is known as dominating zero.) is known as lead network.
If we want to add a dominating zero for compensation in control system then we have to select lead compensation network.
The basic requirement of the phase lead network is that all poles and zeros of the transfer function of the network must lie on (-) ve real axis interlacing each other with a zero located at the origin of nearest origin.
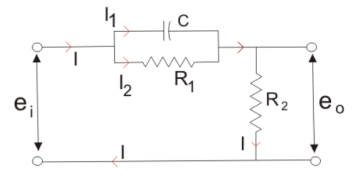
Given below is the circuit diagram for the phase lead compensation network.
 \
\
Transfer function ,
α = (R1 +R2)/ R2 and T = {(R1R2) / (R1 +R2)}
The above network can be visualized as an amplifier with a gain of 1/α. Let us draw the pole zero plot for the above transfer function.
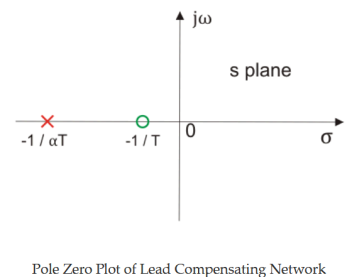
Clearly, we have -1/T (which is a zero of the transfer function) is closer to origin than the -1/(αT) (which is the pole of the transfer function). Thus, we can say in the lead compensator zero is more dominating than the pole and because of this lead network introduces positive phase angle to the system when connected in series.
Let us substitute s = jω in the above transfer function and also, we have α< 1. On finding the phase angle function for the transfer function we have

Now in order to find put the maximum phase lead occurs at a frequency let us differentiate this phase function and equate it to zero. On solving the above equation, we get

Where, θm is the maximum phase lead angle. And the corresponding magnitude of the transfer function at maximum θm is 1/a.
Effect of Phase Lead Compensation
- The velocity constant Kv increases.
- The slope of the magnitude plot reduces at the gain crossover frequency so that relative stability improves and error decrease due to error is directly proportional to the slope.
- Phase margin increases.
- Response becomes faster.
Advantages of Phase Lead Compensation
Let us discuss some of the advantages of the phase lead compensation-
- Due to the presence of phase lead network the speed of the system increases because it shifts gain crossover frequency to a higher value.
- Due to the presence of phase lead compensation maximum overshoot of the system decreases.
Disadvantages of Phase Lead Compensation
Some of the disadvantages of the phase lead compensation –
- Steady state error is not improved
Phase Lag Compensation
A system which has one zero and one dominating pole (the pole which is closer to origin that all other poles is known as dominating pole) is known as lag network.
If we want to add a dominating pole for compensation in control system then, we have to select a lag compensation network.
The basic requirement of the phase lag network is that all poles and zeros of the transfer function of the network must lie in (-) ve real axis interlacing each other with a pole located or on the nearest to the origin.
Given below is the circuit diagram for the phase lag compensation network.
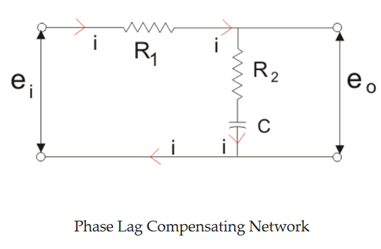
Transfer function,

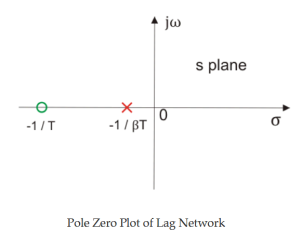
Clearly, we have -1/T (which is a zero of the transfer function) is far to origin than the -1 / (βT) (which is the pole of the transfer function). Thus, we can say in the lag compensator pole is more dominating than the zero and because of this lag network introduces negative phase angle to the system when connected in series.
Let us substitute s = jω in the above transfer function and also, we have a < 1. On finding the phase angle function for the transfer function we have

Now in order to find put the maximum phase lag occurs at a frequency let us differentiate this phase function and equate it to zero. On solving the above equation, we get

Where, θm is the maximum phase lead angle. Remember β is generally chosen to be greater than 10.
Effect of Phase Lag Compensation
- Gain crossover frequency increases.
- Bandwidth decreases.
- Phase margin will be increase.
- Response will be slower before due to decreasing bandwidth, the rise time and the settling time become larger.
Advantages of Phase Lag Compensation
Let us discuss some of the advantages of phase lag compensation –
- Phase lag network allows low frequencies and high frequencies are attenuated.
- Due to the presence of phase lag compensation the steady state accuracy increases.
Disadvantages of Phase Lag Compensation
Some of the disadvantages of the phase lag compensation –
- Due to the presence of phase lag compensation the speed of the system decreases