The true value of quantity to be measured may be defined as the average of an infinite number of measured values when the average deviation due to various contributing factors tend to zero. Such an ideal situation is impossible to realise in practice and hence it is not possible to determine the True Value of a quantity by experimental means. The reason for this is that the positive deviations from true value do not equal the negative deviations and hence do not cancel each other.
True Value refers to a value that would be obtained if the quantity under consideration were measured by an Exampler Method that is a method agreed upon by experts as being sufficiently accurate for the purpose to which data will ultimately be used.
Key Takeaways:
True value may be defined as the average value of an infinite number of measured values when average deviation due to various contributing factor will approach to zero.
Accuracy : It is the closeness with which the instrument reading approaches the true value of the quantity being measured. Thus, accuracy of measurement means conformity to truth.
An example might be given as ±1.0 millivolt (mV) offset error, regardless of the range or gain settings. In contrast, gain errors do depend on the magnitude of the input signal and are expressed as a percentage of the reading, such as ±0.1%. Total accuracy is therefore equal to the sum of the two: ±(0.1% of input +1.0 mV). An example of this is illustrated in Table 1.
|
Key Takeaways:
Accuracy of a measured value refers to how close a measurement is to the correct value.
Precision: It is a measure of reproducibility of the measurements that is given a fixed value of quantity precision is a measure of degree of agreement within a group of measurements. The term precise means clearly or sharply defined.
Key Takeaways:
The precision of a measurement system is refers to how close the agreement is between repeated measurements
If the input is slowly increased from some arbitrary input value it will again be found that output does not change at all until a certain increment is exceeded. This increment is called resolution or discrimination of the instrument. Thus, the smallest increment in input which can be detected with certainty by an instrument is its resolution or discrimination. So, resolution defines the smallest measurable input change while the threshold defines the smallest measurable input.
Key Take Aways:
Resolution is a measure of the distance in amplitude at which we can distinguish between two points on a waveform.
Example:
A moving coil voltmeter has a uniform scale with 100 divisions the full scale reading is 200V and 1/10 of scale division can be estimated with fair degree of certainty. Determine the resolution of the instrument in volt.
Solution:
1 scale division = 200/100 = 2V
Resolution = 1/10 scale division = 1/10 x 2 =0.2 V
Drift is undesirable quality in industrial instruments because it is rarely apparent and cannot be easily compensated for. Thus, it must be carefully guarded against by continuous prevention, inspection, and maintenance. For example, stray electrostatic and electromagnetic fields can be prevented from affecting the measurements by proper shielding. Effect of mechanical vibrations can be minimized by proper mountings. Temperature changes during the measurement process should be preferably avoided or otherwise be properly compensated for.
Key Takeaways:
Drift is the gradual shift in the indication or record of the instrument over an extended period of time, during which the true value of the variable does not change.
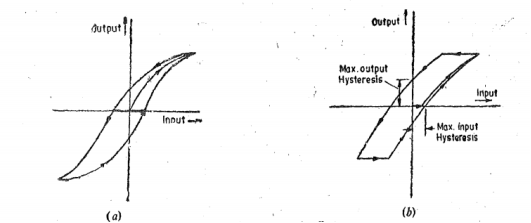
Hysteresis is a phenomenon which depicts different output effects when loading and unloading whether it is a mechanical system or electrical system for that matter any system. Hysteresis is non-incidence of loading and unloading curves. Hysteresis in a system arises due to the fact that all the energy put into stressed parts when loading is not recoverable upon loading. This is shown in fig(a) . In mechanical parts of the system there may be internal friction , external sliding friction and coulomb friction. There may be free play or looseness in the mechanism. In a given instrument a number of causes are combined to give overall effect which results in output-input relationship as shown in fig(b).
|
Figure 1. Hysteresis Effects
Key Takeaways:
Hysteresis is a phenomenon under which the measuring instrument shows different output effects during loading and unloading.
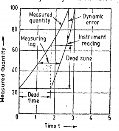
It is defined as the largest change of input quantity for which there is no output of the instrument. For example, the applied input to the instrument may not be sufficient to overcome the friction and will in that case will not move at all.
It will only move when the input is such that it produces a driving force which can overcome friction forces.
The term dead zone is used interchangeably with the term hysteresis. It may be defined as the total range of input values possible for a given output and may thus be numerically twice the hysteresis defined in fig (b)
|
Figure 2. Dead Zone
Problem:
The dead zone in a certain pyrometer is 0.125 percent of span. The calibration is 400 o C to 1000 o C . What temperature change might occur before it is detected.
Solution:
Span = 1000 – 400 = 600
Dead Zone = 0.125/100 x 600 = 0.75 o C
A change of 0.75 o C must occur before it is detected.
Key Take Aways:
Dead zone is defined as the largest change of input quantity for which there is no output of the instrument.
Sensitivity is an absolute quantity, the smallest absolute amount of change that can be detected by a measurement.
Consider a measurement device that has a ±1.0 volt input range and ±4 counts of noise, if the A/D converter resolution is 212 the peak-to-peak sensitivity will be ±4 counts × (2 ÷ 4096) or ±1.9 mV p-p. This will dictate how the sensor responds.
For example, take a sensor that is rated for 1000 units with an output voltage of 0-1 volts (V). This means that at 1 volt the equivalent measurement is 1000 units, or 1 mV equals one unit. However, the sensitivity is 1.9 mV p-p so it will take two units before the input detects a change.
Key Takeaways:
The sensitivity of an instrument is the change of output divided by the change of the measurand (the quantity being measured).
References:
- Biomedical Instrumentation Book by R. S Khandpur and Raghbir Khandpur
- Biomedical Instrumentation and Measurements by Cromwell
- Biomedical Instrumentation And Measurements by Peter and Joseph
- INTRODUCTION TO BIOMEDICAL INSTRUMENTATION by Mandeep Singh


