Unit - 2
Errors in Measurement
2.1.1 Mean
The most probable value of measured variable is the arithmetic mean of the number of readings taken. The best approximation is made when the number of readings of the same quantity are very large. Theoretically an infinite number of readings would give the best result although in practice only a finite number of measurements can be made.
The arithmetic mean is given by
Where
x1,x2……xn = readings or variates or samples n = number or readings |
Key Take Aways:
Arithmetic Mean represents a number that is obtained by dividing the sum
2.1.2 Standard Deviation
The standard deviation of an infinite number of data is defined as the square root of the sum of the individual deviations squared, divided by the number of readings.
Thus, the standard deviation is
S.D = |
In practice however the number of observations is finite. When the number of observations is greater than 20 S.D is denoted by symbol  while if it less than 20 the symbol used is s. The Standard deviation of finite number of data is given by:
s = √d1 2 + d2 2 + d3 2 + ………………… + dn2 / n-1 = √ d2 / n-1 |
Problem:
A set of independent current measurements were taken by six observers and were recorded as 12A, 12.2 A 12.5 A 13.1A and 12.9 A and 12.4 A.
Calculate:
(a) Arithmetic mean
(b) Deviation from mean
(c) Average deviation
(d) Standard deviation
ANS:
(a) Arithmetic mean
(b) Deviations : d1 = x1 - d2 = x2 - d3 = x3 - d4 = x4 – d5 = x5 - d6 = x6 - ( c ) Average deviation = D = 0.283 A ( d ) Standard deviation S = √ S=0.399 A |
Key Take Away:
Standard deviation is the square root of the variance. The variance helps determine the data's spread size when compared to the mean value.
2.1.3 Six Sigma Estimation
|
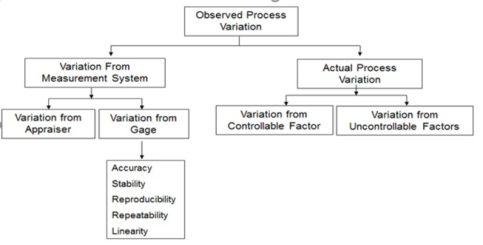
Figure 1. Six Sigma Components of Variation
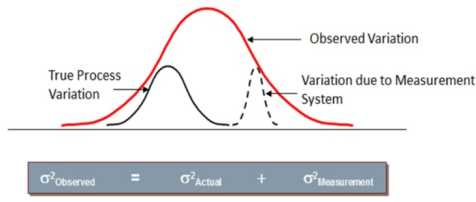
The variation in process can result due to the Actual Process Variation and the Variation from Measurement System. The Actual Process Variation is resulted because of Controllable Factors and/or Uncontrollable Factors.
Figure 2. Six Sigma Process Variation
Figure 3. Observed Variation vs True Variation |
Measurement System Analysis:
Measurement system errors can be due to
Accuracy – The difference between the average of observed values and the standard
Repeatability – Variation in measurement when a person measures the same unit repeatedly with the same measuring gage (or tool)
Reproducibility - Variation in measurement when two or more persons measure the same unit using the same measuring gage (or tool)
Stability - Variation in measurement when the same person measures the same unit using the same measuring gage (or tool) over an extended period of time.
Linearity – The consistency of the measurement across the entire range of the measuring gage.
Key Take Away:
Measurement System Analysis (MSA) is an experimental and mathematical method of determining how much the variation within the measurement process contributes to overall process variability.
2.1.4 Cp and Cpk
Cp= Process Capability. A simple and straightforward indicator of process capability.
Cpk= Process Capability Index. Adjustment of Cp for the effect of non-centered distribution.
Cpk is an index which measures how close a process is running to its specification limits, relative to the natural variability of the process. The larger the index, the less likely it is that any item will be outside the specs.”
Cpk measures how close you are to your target and how consistent you are to around your average performance. A person may be performing with minimum variation, but he can be away from his target towards one of the specification limit, which indicates lower Cpk, whereas Cp will be high. On the other hand, a person may be on average exactly at the target, but the variation in performance is high. In such case also Cpk will be lower, but Cp will be high. Cpk will be higher only when your meeting the target consistently with minimum variation
Key Take Aways:
Cp and Cpk, commonly referred to as process capability indices, are used to define the ability of a process to produce a product that meets requirements
References :
- Biomedical Instrumentation Book by R. S Khandpur and Raghbir Khandpur
- Biomedical Instrumentation and Measurements by Cromwell
- Biomedical Instrumentation And Measurements by Peter and Joseph
- INTRODUCTION TO BIOMEDICAL INSTRUMENTATION by Mandeep Singh


