Bioelectric potentials are generated at a cellular level and the source of these potentials is ionic in nature. A cell consists of an ionic conductor separated from the outside environment by a semipermeable membrane which acts as a selective ionic filter to the ions.
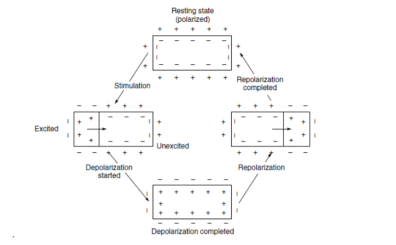
The unequal charge distribution is a result of certain electrochemical reactions and processes occurring within the living cell and the potential measured is called the resting potential.
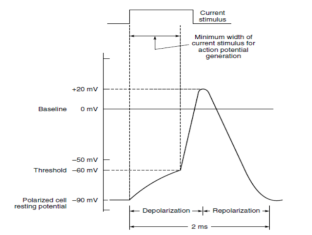
A decrease in this resting membrane potential difference is called depolarization.
|
Figure 1. Potential Waveform
Repolarization then takes place a short time later when the cell regains its normal state in which the inside of the membrane is again negative with respect to the outside. Repolarization is necessary in order to re-establish the resting potential.
A typical cell potential waveform so recorded is shown in Figure.
|
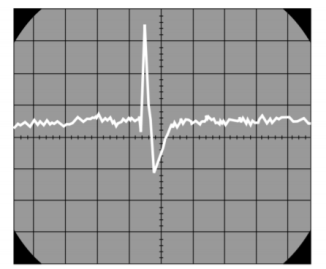
Figure2 . Electrical activity associated with one contraction in a muscle
The wave of excitation while propagating in the muscle causes its contraction. The contraction wave always follows the excitation wave because of its lower velocity. This phenomenon is found with the skeletal muscles, the heart muscle and the smooth muscles.
The cell action potential, therefore, shows a finite rise time and fall time. It may be noted that a cell may be caused to depolarize and then repolarize by subjecting the cell membrane to an ionic current. However, unless a stimulus above a certain minimum value is applied, the cell will not be depolarized and no action potential is generated. This value is known as the stimulus threshold. After a cell is stimulated, a finite period of time is required for the cell to return to its pre-stimulus state. This is because the energy associated with the action potential is developed from metabolic processes within the cell which take time for completion. This period is known as refractory period.
Key Takeaways:
The interface of metallic ion solution with their associated metal results in an electrode potential.
A transducer is a device that converts a quantity from the measured object into an electrical signal. Biomedical transducers are transducers with specific uses in biomedical applications: physiological measurement, patient monitoring, health care. Measurement quantities: physical and chemical quantities that reflect the physiological functions in a living body. Examples: blood composition - determined from a sample extracted from the body real-time and continuous measurements - transducer is attached to the body.
Key Takeaways
The transducers convert the ionic potential to electric voltages. These natural signals can be measured, monitored & aid the physician in diagnosis & treatment of various diseases.
In Bio Medical Instrumentation the transducer is a component which has a non- electrical variable as its input and an electrical signal as its output. To function properly one parameters of the electrical output signal in the form of voltages current frequency or pulse width must be non -ambiguous function of the non- electrical variables at the input. The relationship between input and output must be linear. A linear relationship is not possible always but the relationship between input and output should follow some rules like logarithmic function or square law. As long as the transduction function is non-ambiguous it is possible to determine the magnitude of the input variable from the electrical output signal.
There are two different principles used to convert nonelectrical variables into electrical signals. One of these is energy conversion transducer called active transducer. The other principle involves control of an excitation voltage or modulations of carrier signal. Transducers based on this principle are called passive transducers.
Key Takeaways:
The earliest recording instruments used were various forms of mechanical chart recorders. Whilst many of these remain in use, most modern forms of chart recorder exist in hybrid forms in which microprocessors are incorporated to improve performance.
Patient care Patient care is the focus of many clinical disciplines— medicine, nursing, pharmacy, nutrition, therapies such as respiratory, physical, and occupational, and others. Although the work of the various disciplines sometimes overlaps, each has its own primary focus, emphasis, and methods of care delivery. Each discipline’s work is complex, and collaboration among disciplines adds another level of complexity.
In all disciplines, the quality of clinical decisions depends in part on the quality of information available to the decision-maker.
The process of care begins with collecting data and assessing the patient’s current status in comparison to criteria or expectations of normality. Through cognitive processes specific to the discipline, diagnostic labels are applied, therapeutic goals are identified with timelines for evaluation, and therapeutic interventions are selected and implemented. At specified intervals, the patient is reassessed, the effectiveness of care is evaluated, and therapeutic goals and interventions are continued or adjusted as needed. If the reassessment shows that the patient no longer needs care, services are terminated.
Key Takeaways:
A patient monitor may not only alert caregivers to potentially life-threatening events; many also provide physiologic input data used to control directly connected life support devices
Blood pressure assessment is an integral part of clinical practice. Routinely, a patient’s blood pressure is obtained at every physical examination, including outpatient visits, at least daily when patients are hospitalized, and before medical procedures.
Blood pressure measurements are obtained for a wide variety of reasons, including screening for hypertension, assessing a person’s suitability for a sport or certain occupations, estimating cardiovascular risk and determining risk for various medical procedures.
Blood pressure measurements are obtained routinely following hypertensive patient to assist with tailoring of medications and treatment of hypertension. Finally, blood pressure measurements are crucial for identifying if a patient is in potential or actual clinical deterioration.
8.5.1 Blood flow
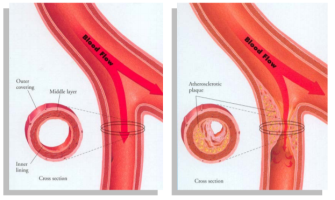
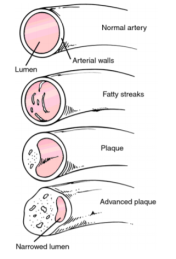
Some of the primary measurements are the concentration of O2 and other nutrients in the cells. Blood flow helps to understand basic physiological processes and example the dissolution of a medicine into the body. These are normally so difficult to measure therefore we force to use the second-class measurements of blood flow and changes in blood. If blood flow is difficult to measure the third-class measurement of blood pressure is used .If blood pressure cannot be measured, the physician may fall back on the fourth-class measurement of the ECG. Usually, the blood flow measurements are more invasive than blood pressure measurements. It also helps to understand many pathological conditions, since many diseases alter the blood flow. Also, the blood clots in the arterial system can be detected.
|
|
| |
Figure 3. Blood Flow
8.5.2 Cardiac output
The Fick method measures cardiac output relies on the observation that the total uptake of oxygen by the body is equal to the product of the cardiac output and the arterial-venous oxygen content difference. Logically, that principle is called the Fick principle.
Rearranging the equation:
CO = V O 2 / (Ca - CV ) |
Where:
- VO2 is the total oxygen consumption, as a volume per unit time (eg. L/min)
- CO is the cardiac output, also as volume per unit time (L/min)
- Ca and Cv are the arterial and venous oxygen content (eg. ml/L)
It will suffice to say that the proper application of this method requires the cumbersome measurement of total inhaled and exhaled oxygen as well as the simultaneous measurements of arterial and mixed venous blood. "Indirect" options also exist, where one of the more inconvenient measurements is replaced by some sort of estimated value, eg. where you use an age/weight/sex-based nomogram to estimate the VO2. Obviously, the use of estimates introduces an element of error into a measurement which is already not particularly precise.
Method:
- The oxygen consumption (VO2) is measured by comparing the amount of inhaled oxygen and exhaled oxygen, usually by means of a collection bag and/or flowmeter
- The mixed venous oxygen content and the arterial oxygen content are measured directly, from the bloodstream
- Alternatively, for the indirect method, estimates can be made:
- VO2 can be estimated from nomograms
- Mixed venous oxygen content can be assumed on the basis of normal values, or estimated from central venous samples
- Arterial oxygen content can be estimated from pulse oximetry
8.5.3 Heart Sounds
Heart sounds are generated by blood flowing in and out of the heart’s chambers through the valves as they open and close. Listening to the heart sounds through a stethoscope (auscultation) is one of the first steps a physician takes in evaluating a patient’s medical condition.
The heart is a muscular organ and has four chambers that receive and pump blood:
- The left atrium receives oxygenated blood from the lungs and pumps it into the left ventricle.
- The left ventricle pumps the oxygen-rich blood to the rest of the body through a network of arteries.
- The right atrium receives the oxygen-depleted blood from the body through veins and pumps it into the right ventricle.
- The right ventricle pumps the blood to the lungs for oxygenation.
The left ventricle’s contractions while pumping out blood create the systolic blood pressure in the arteries. A web of nerve tissue runs through the heart to send electric signals to the heart muscle to initiate the heart’s contraction.
These two phases constitute the heartbeat.
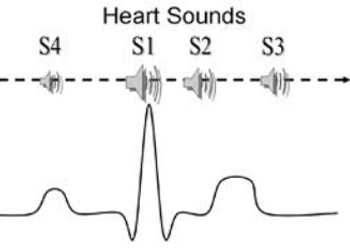
In a healthy adult, the heart makes two sounds, commonly described as ‘lub’ and ‘dub.’
The third and fourth sounds may be heard in some healthy people, but can indicate impairment of the heart function. S1 and S2 are high-pitched and S3 and S4 are low-pitched sounds.
First sound
When the two ventricles contract and pump out blood into the aorta and pulmonary artery the mitral and tricuspid valves close to prevent the blood flowing back into the atria. The first sound S1 is generated by vibrations created by the closing of these two valves.
Normally the mitral valve closes just before the tricuspid valve, and when the two different sounds are detectable, it is called a “split S1.” A split S1 may be indicative of certain conditions affecting the heart.
Second sound
After pumping the blood, the ventricles relax to receive blood from the atria, and the diastole phase starts. The aortic and pulmonic valves close and cause vibrations, giving rise to the second heart sound, S2. The increase in intensity of this sound may indicate certain conditions.
When the aortic valve closes just before the pulmonic valve, it may generate a split S2. This may indicate impairment in the heart function.
Third sound
The third heart sound is a low-pitched sound audible with the rapid rush of blood from the atrium into the ventricle as it starts relaxing. This may be a normal sound in some people but in people with heart conditions, S3 may indicate heart failure.
Fourth sound
The fourth is a low-intensity sound heard just before S1 in the cardiac cycle. The sudden slowing of blood flow by the ventricle as the atrium contracts causes this sound, which may be a sign of heart disease.
|
Figure 4. Heart Sounds
Key Takeaways:
Heart rate is the simplest form of cardiovascular measurement and is the number of times the heart beats per minute (BPM). A normal adult resting heart rate ranges between 60 and 100 BMP. However, endurance athletes can have resting heart rates well below 60 BPM due to high levels of cardiovascular conditioning.
Respiration is the act of inhaling and exhaling air in order to exchange oxygen for carbon dioxide. It is synonymous with breathing and ventilation.
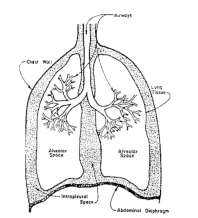
The lungs are where the gas exchange takes place. The lungs consist of a series of tubes which repeatedly fork into smaller tubes.
Eventually these tubes terminate in tiny sacks called the alveoli. There are 300 million alveoli in the adult lung.
|
Figure5. Respiratory system
The alveoli have very thin walls. Small blood vessels (capillaries) are very close to the air in the alveoli, allowing gas exchange to take place.
A surface area of approximately 75m2 is provided for the exchange of gas.
The total volume of air in the lungs varies with inhalation and exhalation.
Nervous System:
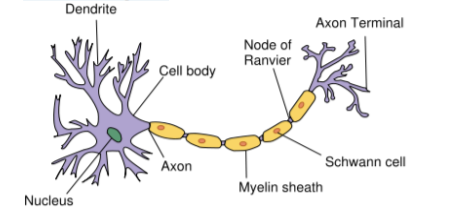
The nervous system is one which is responsible for the task of controlling the various functions of the body & coordinating them into integrated living organisms. The basic unit of nervous system is the neuron. The neuron is the single cell with a cell body, sometimes called as soma, one or more input fibres called dendrites & a long transmitting fibre called as axon. The axon branches near its ending into two or more terminals
|
Figure6. Nervous System
The portion of the axon immediately adjacent to the cell body is called axon hillock. This is the point at which the action potentials are usually generated. Branches that leave the main axon are often called collaterals. The axons & dendrites are coated with a fatty insulating substance called as myelin. The coating is called as myelin sheath. In some cases, the myelin sheath is interrupted at rather intervals by the nodes of Ranvier, which helps the speed of transmission of information along the nerves. Outside of the central nervous system, the myelin sheath is surrounded by an insulating layer called as neurilemma. This layer is thinner than the myelin sheath & continuous over the nodes of Ranvier, is made up of thin cells called Schwann cells. Both axons & dendrites are called as nerve fibres & a bundle of individual nerve fibber is called as nerve. Nerves that carry information from various parts of the body to the brain is called afferent nerves & that from brain to various parts of the body is called efferent nerves.
Key Takeaways:
From the engineering point of view; the circulation is a high resistance circuit with a large pressure gradient between the arteries and veins. The exchange of any gases in any biological process is termed as respiration.
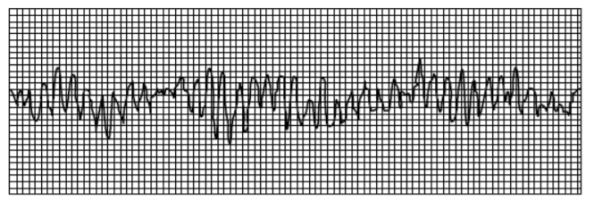
The brain generates rhythmical potentials which originate in the individual neurons of the brain. These potentials get summated as millions of cell discharge synchronously and appear as a surface waveform, the recording of which is known as the electroencephalogram (Figure).
The neurons, like the other cells of the body, are electrically polarized at rest. The interior of the neuron is at a potential of about –70 mV relative to the exterior. When a neuron is exposed to a stimulus above a certain threshold, a nerve impulse, seen as a change in membrane potential, is generated which spreads in the cell resulting in the depolarization of the cell. Shortly afterwards, repolarization occurs.
|
Figure7.EEG waveform
The EEG signal can be picked up with electrodes either from the scalp or directly from the cerebral cortex. The peak-to-peak amplitude of the waves that can be picked up from the scalp is normally 100 µV or less while that on the exposed brain, is about 1 mV. The frequency varies greatly with different behavioural states.
The normal EEG frequency content ranges from 0.5 to 50 Hz. The nature of the wave varies over the different parts of the scalp. The variations in EEG signals both in terms of amplitude and frequency are of diagnostic value. Frequency information is particularly significant since the basic frequency of the EEG range is classified into the following five bands for purposes of EEG analysis:
Delta (d) 0.5–4 Hz Theta (q) 4–8 Hz Alpha (a) 8–13 Hz Beta (b) 13–22 Hz Gamma (g) 22–30 Hz |
8.5.1 ECG
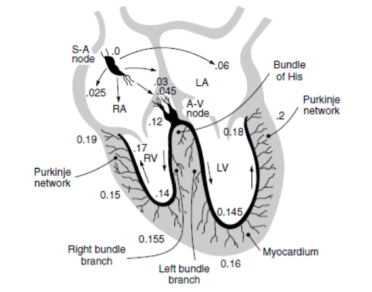
The recording of the electrical activity associated with the functioning of the heart is known as electrocardiogram. ECG is a quasi-periodical, rhythmically repeating signal synchronized by the function of the heart, which acts as a generator of bioelectric events. This generated signal is described by means of a simple electric dipole. The dipole generates a field vector, changing nearly periodically in time and space and its effects are measured on the surface.
The waveforms recorded are standardized in terms of amplitude and phase relationships and any deviation from this would reflect the presence of an abnormality. Hence, it is important to understand the electrical activity and the associated mechanical sequences performed by the heart in providing the driving force for the circulation of blood. The heart has its own system for generating and conducting action potentials through a complex change of ionic concentration across the cell membrane. Located in the top right atrium near the entry of the vena cava, are a group of cells known as the sino-atrial node (SA node) that initiate the heart activity and act as the primary pace maker of the heart Figure. The SA node is 25 to 30 mm in length and 2 to 5 mm thick. It generates impulses at the normal rate of the heart.
|
Figure8. The position of the Sino-atrial node in the heart from where the impulse responsible for the electrical activity of the heart originates
8.5.2 EMG
The contraction of the skeletal muscle results in the generation of action potentials in the individual muscle fibres, a record of which is known as electromyogram. The activity is similar to that observed in the cardiac muscle, but in the skeletal muscle, repolarization takes place much more rapidly, the action potential lasting only a few milliseconds. Since most EMG measurements are made to obtain an indication of the amount of activity of a given muscle, or a group of muscles, rather than of an individual muscle fibre, the EMG pattern is usually a summation of the individual action potentials from the fibres constituting the muscle or muscles being studied. The electrical activity of the underlying muscle mass can be observed by means of surface electrodes on the skin. However, it is usually preferred to record the action potentials from individual motor units for better diagnostic information using needle electrodes. In voluntary contraction of the skeletal muscle, the muscle potentials range from 50 mV to 5 mV and the duration from 2 to 15 m sec. The values vary with the anatomic position of the muscle and the size and location of the electrode. In a relaxed muscle, there are normally no action potentials. A typical EMG signal is shown in Figure.
|
Figure9. Waveform of EMG signal
8.5.3 EOG
Electro-oculography is the recording of the bio-potentials generated by the movement of the eye- ball. The EOG potentials are picked up by small surface electrodes placed on the skin near the eye. One pair of electrodes is placed above and below the eye to pick up voltages corresponding to vertical movements of the eye- ball. Another pair of electrodes is positioned to the left and right of the eye to measure horizontal movement. The recording pen is centred on the recording paper, corresponding to the voltage changes accompanying it. EOG has applications mostly for research and is not widely used for clinical purposes.
8.5.4 Actional Potentials
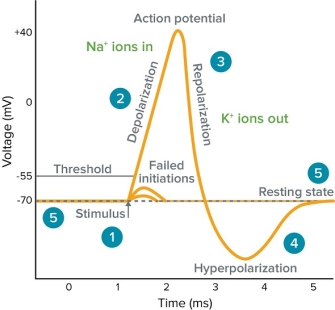
An action potential is a rapid rise and subsequent fall in voltage or membrane potential across a cellular membrane with a characteristic pattern. Sufficient current is required to initiate a voltage response in a cell membrane; if the current is insufficient to depolarize the membrane to the threshold level, an action potential will not fire. Examples of cells that signal via action potentials are neurons and muscle cells.
|
Figure 10. Action Potential
- Stimulus starts the rapid change in voltage or action potential. In patch-clamp mode, sufficient current must be administered to the cell in order to raise the voltage above the threshold voltage to start membrane depolarization.
- Depolarization is caused by a rapid rise in membrane potential opening of sodium channels in the cellular membrane, resulting in a large influx of sodium ions.
- Membrane Repolarization results from rapid sodium channel inactivation as well as a large efflux of potassium ions resulting from activated potassium channels.
- Hyperpolarization is a lowered membrane potential caused by the efflux of potassium ions and closing of the potassium channels.
- Resting state is when membrane potential returns to the resting voltage that occurred before the stimulus occurred.
Key Takeaways:
In the nervous system, a synapse is a structure that permits a neuron (or nerve cell) to pass an electrical or chemical signal to another cell.
8.5.5 Non-invasive Diagnostic Measurements
8.5.5.1 Temperature
To evaluate this potential, a temperature probe was designed with rapid response (< 1 s), high accuracy and reproducibility (± 0.1°C), good transducer thermal isolation and physical dimensions approximating those of a conventional periodontal probe. To compensate for subject‐to‐subject variations in core temperature, site temperatures were measured and expressed as differences relative to the sublingual temperature. A cross sectional study was conducted using this instrument in which pocket temperatures of 14 subjects with advanced adult periodontitis were measured and compared with the sulcus temperatures of 11 healthy subjects.
The results suggest that site temperature is a diagnostic of inflammatory activity associated with periodontal disease. The specifically designed instrument detected significant disease‐related departures from normality.
8.5.5.2 Ultrasonic Diagnosis
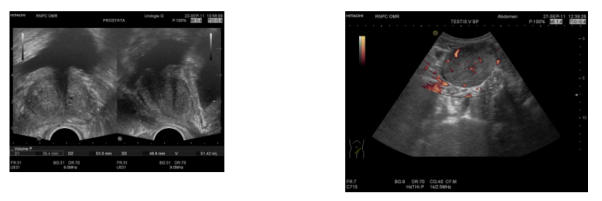
Ultrasonic diagnosis is a non-invasive study of the body or the inner structure of various objects and processes ongoing in them, by means of ultrasound waves.
Its main advantages are the absence of contraindications and significant adverse effect on the organ or object under investigation. This modality is used for primary and subsequent diagnosis of diseases, assessment of the disease course, detection of recurrence at early stages, determining the magnitude of surgical intervention and diagnosis of possible complications of the treatment.
|
Figure11. Ultrasonic diagnosis
These instruments transmit short trains of 1.5- to 10-megahertz sound. Echoes reflected from tissue are converted to electrical signals, which are presented on a display device to outline the contour of tissues and organs within the body. The physical resolution of the system is dependent on several design factors in addition to the transmitted sound frequencies. A resolution volume of approximately 1.5 by 3 by 4 millimetres is achieved optimally with commercially available systems operating at 2.25 megahertz. The various instrument designs are described in the context of clinical usage. Because the sound is diffracted, refracted, and reflected, the imaging considerations are different from those of x-ray imaging. Diagnostic devices based on the Doppler principle are distinguished from pulsed-reflected ultrasonic instruments.
8.5.5.3 CAT scan techniques
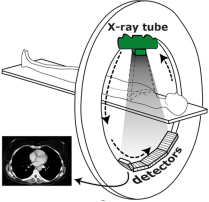
CT stands for computer tomography and like conventional x-rays uses x-ray beams. The CT scan is a test where the interior of the human body is imaged in three dimensions.
The x-ray beam passes through the human body in a thin axial slice, which is repeated in various directions
|
Figure12. General technique of a CT scanner.
The detectors on the opposite side measure the radiation transmission through the patient. This enables the computer to determine the degree of absorption in very small volume elements, the so-called voxels. When interpreting a CT scan, you should picture yourself standing at the patient's feet looking at his or her head; top is the side of the abdomen, bottom the side of the back and left & right have been inverted.
8.5.5.4 Sensory Measurements
Sensory system instrumentation refers to the application of engineering techniques and analysis using sensory system which is part of the peripheral nervous system to design devices that can be used for detection, measurement and monitoring of physiological signals
|
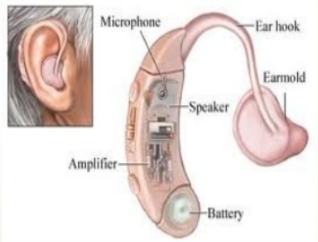
Figure13. Hearing Aid
This is electroacoustic device designed to amplify sound for wearer. It receives sound through a microphone which converts the sound waves to electrical signals and sends them to an amplifier. The amplifier increases the power of the signals and sends them to the ear through a speaker.
8.5.5.6 Motor Response
The fact the motor response is so well defined is one of the distinguishing features between operant and classical conditioning. The actual motor response in eye blink conditioning involves sensations of the air puff from receptors on the cornea and the region of the face around the eye. This sensation involves the trigeminal nerve and its projections to the trigeminal nuclei.
Key Takeaways:
Non-invasive measurement sites, including the axilla, oral cavity, and forehead, reflect has been the traditional method for non-invasive diagnosis of CAD.
References:
- Biomedical Instrumentation Book by R. S Khandpur and Raghbir Khandpur
- Biomedical Instrumentation and Measurements by Cromwell
- Biomedical Instrumentation And Measurements by Peter and Joseph
- INTRODUCTION TO BIOMEDICAL INSTRUMENTATION by Mandeep Singh
