UNIT-4
Current and Potential Transformer
4.1. Current and Potential Transformer
4.1.1 Construction of Current Transformer
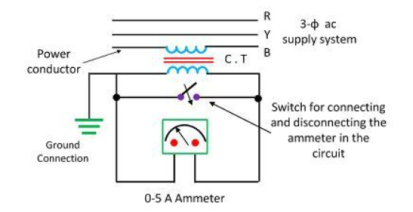
The core of the current transformer is made of lamination of silicon steel. For high degree of accuracy, the Permalloy or Mumetal is used for making cores. The primary windings of the current transformers carry the current, which is to be measured, connected to the main circuit. The secondary windings of the transformer carry the current proportional to the current to be measured, connected to the current windings of the meters or the instruments.
The primary and the secondary windings are insulated from the cores and each other. The primary winding is a single turn winding called bar primary and carries the full load current. The secondary winding of the transformers has many turns.
|
Figure 1. Current Transformer Construction
4.1.2 Construction of Potential Transformer
|
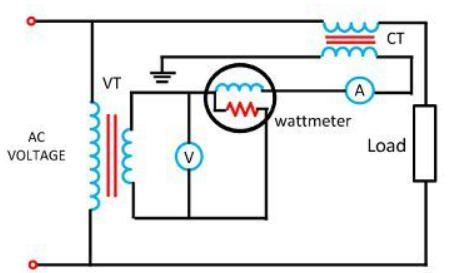
Figure 2. Potential Transformer Construction
The potential transformer is connected in parallel with the circuit. The primary windings of the potential transformer are directly connected to the power circuit where voltage is measured. The secondary terminals of the potential transformer are connected to the measuring instrument like the voltmeter, wattmeter, etc.
The secondary windings of the potential transformer are magnetically coupled through the magnetic circuit of the primary windings.The primary terminal of the transformer is rated for 400V to several thousand volts, and the secondary terminal is always rated for 400V. The ratio of the primary voltage to the secondary voltage is termed as transformation ratio or turn ratio.
4.1.3 Theory, Characteristics and Testing of Current Transformer
|
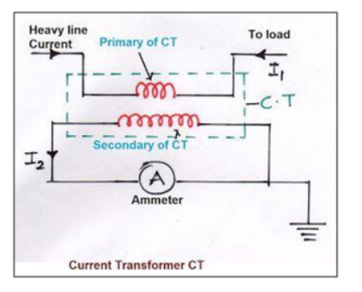
Figure 3. Current Transformer Working
Whenever an alternating current flow through the primary winding, alternating magnetic flux is produced, and induces a proportional Alternating Current in the secondary winding.
CT generally consists of very few turns as its primary winding. It could just be a bar, or a conductor placed through a hole. The secondary has large number of turns wound on a laminated core of low-loss magnetic material.
The primary current is controlled by an independent external load and the secondary current has ratings of 1A or 5A which are conducive to measuring instruments.
- Characteristics
|
Figure 4. Current ratio
Current Ratio – known as the Turns Ratio is the ratio of the primary current to the secondary current. It is equal to the ratio of number of turns in the primary and secondary coils.
Is = Ip(Np/Ns)
Ip= Secondary current. Np=Primary coil turns Ip: Primary current Ns: Seondary coil turns
Polarity – The polarity of a CT is determined by the direction of coil winding around the core of the CT either clockwise or counter-clockwise and by the way the leads, if any, are brought out of the transformer case. All current transformers have subtractive polarity.
Accuracy Class – Accuracy Class describes the performance characteristics of a Current Transformer and the maximum burden that can be allowed on its secondary circuit
Metering accuracy CT can deliver high accuracy current measurement over short ranges of current.
- Testing
The methods for CT are:
- Insulation Resistance test.
- CT Resistance, Excitation curve, Ratio & Polarity test.
- Current Transformer Loop test.
- Primary Injection Test.
4.1.4 Theory, Characteristics and Testing of Potential Transformer
Theory:
The working of a potential transformer is that it steps down the high voltage and provide the power according to the reading of a measuring instrument which is installed for the measurement of voltage or power. So, its main purpose is to provide voltage according to the measuring instrument so that the power is controlled according to its rating.
|
Figure 5. Equivalent circuit of potential transformer
Vp = primary voltage
Ep = induced voltage in primary winding
Vs = secondary voltage
Es = induced voltage in secondary winding
Ip = primary current
Is = secondary current
I0 = no load current
Ic = core loss component of current
Im = magnetizing component of current
Rp = resistance of primary winding
Xp = reactance of primary winding
Rs = secondary winding resistance
Xs = secondary winding reactance
Rc = imaginary resistance / core loss
Xm = magnetizing reactance
Re = resistance of external load
Xe = reactance of external load
Np = primary winding turns
Ns = secondary winding turns
N = turn ratio
Φ = flux of potential transformer
δ = Phase angle between secondary winding voltage and secondary winding
β = Phase angle between primary current and Secondary current
α = Phase angle between no-load current I0 and flux φ
|
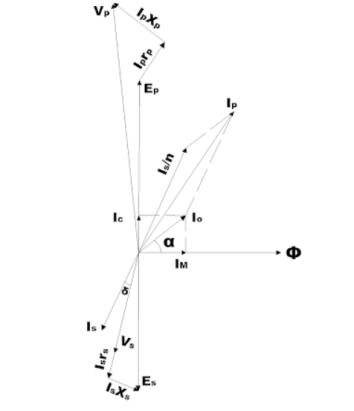
Figure 6. Phasor Diagram of PT
The flux is conspired along the x axis. Im is in phase with flux. Ic leads by Im 900. The sum of Ic and Im produces no load current Io. Ep is in the phase with the core loss component of current Ic. Es is 180o out of phase with the primary winding voltage Ep. Secondary voltage Vs are obtained by subtracting the IsRs and IsXs from secondary voltage.
Testing of PT :
- Visual and Mechanical Inspections
- Compare equipment nameplate data with drawings and specifications.
- Inspect physical and mechanical condition.
- Verify that all grounding connections provide contact.
- Verify correct operation of transformer withdrawal mechanism and grounding operation.
- Verify correct primary and secondary fuse sizes.
- Electrical Tests
- Perform insulation resistance tests winding to winding and each winding to ground. ‘
- Perform a polarity test on each transformer.
- Perform a turn’s ratio test on all tap positions if possible.
Key Take Aways:
The primary winding of the current transformer carries the current which is to be measured whereas the primary of the potential transformer carries the voltage.
4.2.1 Amplified DC Meters
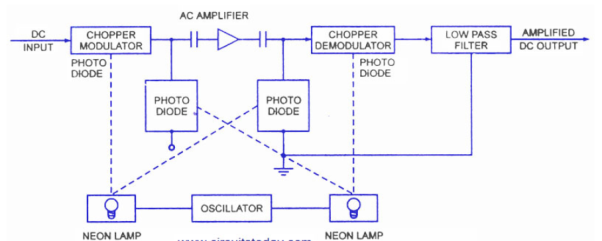
Chopper type dc amplifier is used highly in sensitive dc electronic voltmeters. Its block diagram is shown in figure.
- Firstly, dc input voltage is converted into ac voltage by chopper modulator and then it is supplied to an ac amplifier.
- Then the output of amplifier is then demodulated to a dc voltage proportional to the original input voltage.
- Modulator chopper and demodulator chopper act in anti-synchronism.
- Chopper system may be either mechanical or electronic.
Key Take Aways:
The DC voltmeter is a device which measures the DC voltage applied to it, by moving the pointer against the perfectly calibrated scale.
|
Figure7. Chopper Type Dc amplifier voltmeter
4.2.2 AC Voltmeters using Rectifiers
The rectifier is used to convert a.c. voltage to be measured, to d.c. This d.c., if required is amplified and then given to the PMMC movement.
The r.m.s means root-mean square i.e. squaring, finding the mean i.e. average and finally root. If the waveform is continuous then instead of squaring and calculating mean, the integration is used. Mathematically the r.m.s. value of the continuous a.c. voltage having time period T is given by,
Vrms =  1/T
1/T  2 dt -------------------------------------(1)
Here 1/T term indicates the mean value or average value.
For purely sinusoidal quantity
Vrms = 0.707 Vm where Vm= peak value of the sinusoidal quantity.
Vav = 2/T  dt
dt
The interval T/2 indicates the average over half a cycle.
For purely sinusoidal quantity
Vav = 2/ π Vm = 0.636 Vm
Where Vm = Peak value of sinusoidal quantity.
The form factor is given by
Kf = r.m.s value/ average value = form factor.
Key Take Aways:
Rectifier type instruments generally use a PMMC movement along with a rectifier arrangement. Silicon diodes are preferred because of their low reverse current and high forward current ratings.
4.2.3 True RMS Voltmeter
|
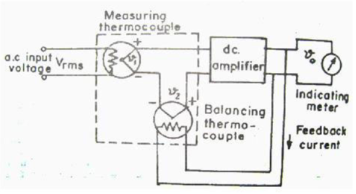
Figure8. True RMS Voltmeter
There are two thermocouples namely measuring thermocouple and balancing thermocouple. They form part of bridge at the input of DC amplifier. The same non- linearity effect takes place in both the thermocouple, so this effect is compensated.
An input AC voltage to be measured is first amplified by using AC amplifier, thus the smaller input voltages can be measured. Coupling capacitor is used at input to avoid any DC component in the measurement. The output of AC amplifier is connected to the heating element of measuring thermocouple.
This will generate the heating wave at this thermocouple. Now this thermocouple will generate the voltage proportional to the heating wave. This voltage generated by measuring thermocouple makes the bridge unbalanced. This voltage is amplified by the DC amplifier.
The output current form DC amplifier is acting as a feedback current. This creates heating of balancing thermocouple. The balancing thermocouple gives the voltages proportional to the heating wave.
A stage will be reached at which output of measuring thermocouple becomes equal to the output of balancing thermocouple. At this point, the balancing of bridge circuit takes place. So, the feedback current becomes equal to an input current. This current is now used to cause the movement of indicating meter.
Key Take Aways:
Complex waveform is most accurately measured with an rms voltmeter. This instrument produces a meter indication by sensing waveform heating power, which is proportional to the square of the rms value of the voltage.
4.2.4 Considerations for choosing an Analog Voltmeter
The considerations in choosing an Analog Voltmeter are :
Input Impedance
The input impedance or resistance of the voltmeter should be as high as possible. It should always be higher than the impedance of the circuit under measurement to avoid the loading effect.
Voltage Ranges
The voltage ranges on the meter scale may be in a 1-3-10 sequence with 10 db separation or a 1.5-5-15 sequence or in a single scale calibrated in decibels. In any case, the scale division should be compatible with the accuracy of the instrument.
Decibels
For measurements covering a wide range of voltages, the use of the decibel scale can be highly effective, for example in the frequency response curve of an amplifier, the output voltage is measured as a function of the frequency of the applied input voltage.
Sensitivity v/s Bandwidth
Noise consists of unwanted frequencies. Since noise is a function of the bandwidth, a voltmeter with a narrow bandwidth picks up less noise than a large bandwidth voltmeter.
Battery Operation
A voltmeter (VTVM) powered by an internal battery is essential for field work.
Key Take Aways:
The input impedance or resistance of the voltmeter should be as high as possible. It should always be higher than the impedance of the circuit under measurement to avoid the loading effect.
4.2.5 Digital Voltmeter
|
Figure 9. Digital Voltmeter Block Diagram
From the above block diagram, the voltage to be measured is given to the input signal. This signal is processed onto the pulse generator which generates a train of rectangular pulses by using analog and digital techniques.
The digital circuitry present inside the pulse generator will control the width and frequency while analog circuitry will control the amplitude, rise time and fall time of the pulse generator. When AND gate is fed with train pulse and rectangular pulse, it will give train pulses with the same duration of that of the rectangular pulse.
Figure 10 . Train Pulse
The display screen will count duration and number of pulses and displays it on the screen. Digital voltmeters are used for analog to digital conversion.
Key Take Aways:
DVM is an instrument used to measure the electrical potential difference between two points in a circuit.
4.3.1 Q-meter Oscilloscope Block Diagram
A device that is used to measure the QF or storage factor or quality factor of the circuit at radio frequencies is called the Q-meter.
|
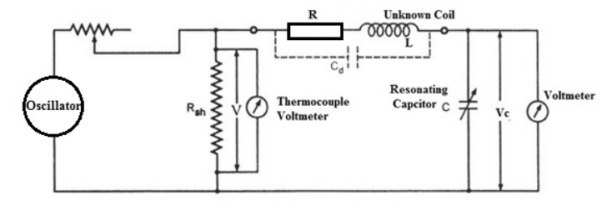
Figure11. Q-meter Oscilloscope
In the circuit, the energy of the oscillator can be supplied to the tank circuit. This circuit may be adjusted for the resonance through unstable ‘C’ until the voltmeter reads the utmost value.
The o/p voltage of resonance is ‘E’, equivalent to ‘Ec’ is
E = Q X e and Q = E/e. Because ‘e’ is known so the voltmeter is adjusted to read ‘Q’ value directly.
The coil is connected to the two test terminals of the instrument to determine the coil’s inductance
This circuit is adjusted to resonance through changing the oscillator frequency otherwise the capacitance. Once the capacitance is changed, then the frequency of the oscillator can be adjusted to a specified frequency & resonance is attained.
If the value of capacitance is already fixed to a preferred value, then the frequency of the oscillator will be changed until resonance takes place.
The reading of ‘Q’ on the o/p meter is multiplied through the setting of an index to get the actual ‘Q’ value. The coil’s inductance is calculated from known values of the coil frequency as well as the resonating capacitor.
Key Take Aways:
The working principle of Q meter is series resonant because the resonant exists within the circuit once the reactance of capacitance & reactance is of the same magnitude.
4.3.2 Delay Line
|
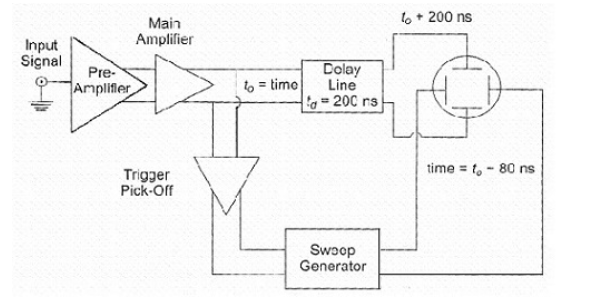
Figure12 . Delay Line in Oscilloscope
A delay is caused by the circuit in transmitting the sweep signal to the horizontal deflecting plates. The delay that is caused by the horizontal deflecting circuits is about 80 ns. To present the leading edge of the signal under observation, the signal to the vertical deflecting plates must be delayed by the same time at least. The delay line provides the required delay to the vertical deflecting voltage.
Delay line can theoretically be inserted at any place in the vertical deflecting system.
There are two types of delay lines used with CROs. The lumped parameter delay line and the distributed parameter delay line.
Key Take Aways:
A delay line is used in an oscilloscope to view the leading edge of the trigger event.
4.3.3 Multiple trace
In this method, the same electron beam is used to generate two traces which can be deflected from two independent vertical sources. They are used to generate two independent traces which the alternate sweep method and other is chop method.
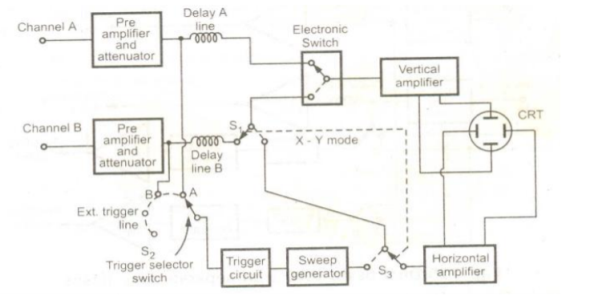
The block diagram of dual trace oscilloscope is shown in the Figure. There are two separate vertical input channels A and B.
A separate preamplifier and - attenuator stage exists for each channel. Hence amplitude of each input can be individually controlled. After preamplifier stage, both the signals are fed to an electronic switch. The switch has an ability to pass one channel at a time via delay line to the vertical amplifier.
The time base circuit uses a trigger selector switch 52 which allows the circuit to be triggered on either A or B channel, on- line frequency or on an external signal. The horizontal amplifier is fed from the sweep generator or the B channel via switch 5! and 51. The XY mode means, the oscilloscope operates from channel A as the vertical signal and the channel B as the horizontal signal. Thus, in this mode accurate X-Y measurements can be done.
|
Figure13. Multiple trace Oscilloscope
Key Take Aways:
Dual trace oscilloscope provides two traces by making use of a single electron beam.
4.3.4 Oscilloscope Probes
When oscilloscope probe is connected to the signal the oscilloscope probe becomes part of your circuit. The signal on screen is the signal plus the effect of the probe. Oscilloscope probes are specifically designed to limit interference or loading in order to avoid influencing your measurement. .
The circuitry inside the probe is mainly the attenuator designed to counteract this interference. The passive probe has a rating such as 10:1 or 1:1. This means the probe has an attenuation factor of 10-to-1 or 1-to-1, respectively.
Probes come in a variety of forms, with different attenuation factors, tip styles, and ground lead lengths.
4.3.5 Oscilloscope Techniques
There are various ways of taking measurements using the oscilloscope. One of the most basic oscilloscope measurement techniques is voltage measurement. Voltage refers to the sum of electrical potential found between two points within a circuit. One of these two points is usually ground zero volt. It can be measured from peak-to-peak, starting from the signal’s maximum point to the signal’s minimum point.
Since the oscilloscope is basically a voltage-measuring device, once users makes necessary voltage measurements, the other quantities are just a matter of simple calculation.
Key Take Aways:
A probe must provide a connection of adequate convenience and quality between the signal source and the oscilloscope input.
4.3.6 Introduction to Analog and Digital Storage Oscilloscopes
|
Figure 14. Digital Storage Oscilloscope
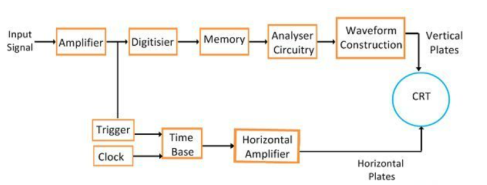
The digital oscilloscope digitises and stores the input signal. This is done using CRT and digital memory. The block diagram digital oscilloscope is shown in the figure below. The digitisation is made by taking the sample input signals at periodic waveforms.
The maximum frequency of the signal is measured by the digital oscilloscope depending on the two factors. They are
- Sampling rate
- Nature of converter.
Sampling Rate – The sampling theory states that the sampling rate of the signal must be twice as fast as the highest frequency of the input signal. The sampling rate means analogue to digital converter has a high fast conversion rate.
Converter – The converter uses the expensive flash whose resolution decreases with the increases of a sampling rate. Because of the sampling rate, the bandwidth and resolution of the oscilloscope are limited.
The need of the analogue to digital signal converters can also be overcome by using the shift register.
Analog Storage Oscilloscope
The conventional cathode ray tube has the persistence of the phosphor ranging from a Few millisecond to several seconds. But sometimes it is necessary to retain the image for much 'longer periods, upto several hours. It requires storing of a waveform for a certain duration,' independent of phosphor persistence. Such a retention property helps to display the waveforms of very low frequency. Mainly two types of storage techniques are used in cathode ray tubes which are: i) Mesh storage and ii) Phosphor storage.
Key Take Aways:
The difference between an analog oscilloscope and a digital oscilloscope is that in an analog device the waveform is shown in the original form, while a digital oscilloscope converts the original analog waveform by sampling it and converts them into digital numbers and then stores them in digital format.
4.3.7 Measurement of frequency
- Increase the vertical sensitivity to obtain the clear picture of the wave on the screen without chopping any of its amplitude off.
- Adjust the sweep rate in such a way that screen displays more than one but less than two complete cycles of the wave.
- Now count the number of divisions of one complete cycle on the graticule from start to end.
- Take horizontal sweep rate and multiply it with the number of units that you counted for a cycle. It will give you the period of the wave. The period is the number of seconds each repeating waveform takes. With the help of period, we can calculate the frequency in cycles per second (Hertz).
4.3.8 Phase Angle
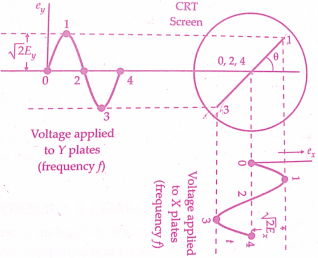
When two sinusoidal voltages of equal frequency are in phase with each other are applied to the horizontal and vertical deflection plates, the pattern appearing on the screen is a straight line as is clear from the below figure.
|
Figure15 . Lissajous pattern with equal frequency voltages and zero phase shift.
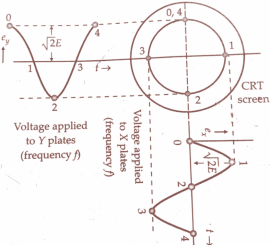
Thus, when two equal voltages of equal frequency but with 90° phase displacement are applied to CRO, the trace on the screen is a circle. This is shown in the below figure.
|
Figure16 . Equal voltages with 90 phase shift
When two equal voltages of equal frequency but with a phase shift (I) are applied to a CRO we obtain an ellipse as shown in the below figure. An ellipse is also obtained when unequal voltages of the same frequency are applied to the CRO.
4.3.9 Time Delay using Oscilloscope
Basically, an oscilloscope is a graphing device. It shows the voltage waveform (or whatever quantity the voltage represents if attached to sensors) on the vertical scale vs time on the horizontal scale.
You arrange the controls and trigger to get the start event and the secondary event on the screen. Then time will be a linear measure base on the sweep speed in the screen is time divisions per millisecond or other time units.
You measure the number of divisions on the screen using the etched or displayed scale and can directly determine the delay time from first event to second event.
Key Take Aways:
A simple method of determining the frequency of a signal is to estimate its periodic time from the trace on the screen of a CRT.
References:
- Elements of Electronic Instrumentation and Measurement – by Carr
- Basic Electrical, Electronics and Measurement Engineering Paperback – 1 January 2019 by U.A Bakshi and A.P Godse.
- Electrical and Electronic Measurement and Instrument Paperback R.K Rajput
- Electrical & Electronic Measurements B. P. Patil, Pooja Mogre (Bisen)
- Electronic Measurements and Instrumentation By A.K. Sawhney
