UNIT 3
Frequency-Response Analysis
There are approximate relations between speciation’s the time and frequency domain.
Let G(s) be the transfer function from set point to output. In the time domain their response speed can be characterized by the rise time Tr, the average residence time Tar or the settling time Ts.
In the frequency domain the response time can be characterized by the closed loop bandwidth, the gain crossover frequency, the sensitivity frequency. The product of bandwidth and rise time is approximately constant. The overshoot of the step response is related to the peak Mp of the frequency response in the sense that a larger peak normally implies large overshoot.
Unfortunately, there are no simple relations because the overshoot also depends on how quickly the frequency response decays.
For Mp<1:2 the overshoot in the step response is oftenclosetoMp°1.
For larger values of Mp the overshoot is typicallylessthanMp°1.
These relations do not hold for all systems, there are systems with Mp= 1 that have a positive overshoot. These systems have a transfer functions that decay rapidly around the bandwidth. To avoid overshoots in systems with error feedback it is advisable to require that the maximum of the complementary sensitivity function is small, say Mt= 1:1°1:2.
It depicts the frequency response characteristics over the entire frequency range in a single plot. There is single graph to represent both phase and magnitude, unlike in Bode plot.
Polar plot is a plot which can be drawn between magnitude and phase. Here, the magnitudes are represented by normal values only.
The pollar form of 

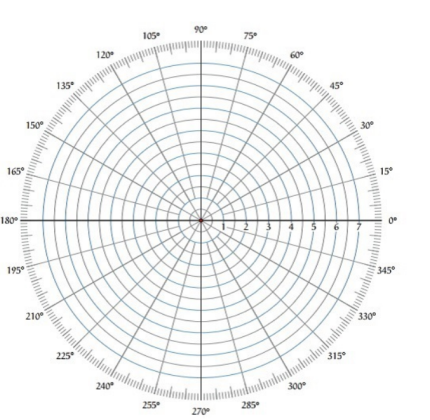
The Polar plot is a plot, which can be drawn between the magnitude and the phase angle of G(jω) H(jω) by varying ω from 0 to ∞. The polar graph sheet is shown in the following figure.

This graph sheet consists of concentric circles and radial lines. The concentric circles and the radial lines represent the magnitudes and phase angles respectively. These angles are represented by positive values in anti-clock wise direction. Similarly, we can represent angles with negative values in clockwise direction. For example, the angle 2700 in anti-clock wise direction is equal to the angle −900 in clockwise direction.
Rules for Drawing Polar Plots
Follow these rules for plotting the polar plots.
- Substitute, s=jω in the open loop transfer function
- Write the expressions for magnitude and the phase of G(jω) H(jω)
- Find the starting magnitude and the phase of G(jω) H(jω) by substituting ω=0. So, the polar plot starts with this magnitude and the phase angle.
- Find the ending magnitude and the phase of G(jω) H(jω) by substituting ω=∞. So, the polar plot ends with this magnitude and the phase angle.
- Check whether the polar plot intersects the real axis, by making the imaginary term of G(jω) H(jω) equal to zero and find the value(s) of ω
- Check whether the polar plot intersects the imaginary axis, by making real term of G(jω) H(jω) equal to zero and find the value(s) of ω
- For drawing polar plot more clearly, find the magnitude and phase of G(jω) H(jω) by considering the other value(s) of ω.
The plot can be used to interpret how the input affects the output in both magnitude and phase over frequency.
The Bode plot or the Bode diagram consists of two plots −
- Magnitude plot
- Phase plot
In both the plots, x-axis represents angular frequency (logarithmic scale). Whereas, y-axis represents the magnitude (linear scale) of open loop transfer function in the magnitude plot and the phase angle (linear scale) of the open loop transfer function in the phase plot.
The magnitude of the open loop transfer function in dB is –

The phase angle of the open loop transfer function in degrees is

Steps for drawing bode plot
- Determine the Transfer Function of the system.

2. Rewrite it by factoring both the numerator and denominator into the standard form.

3. Replace s with j. Then find the Magnitude of the Transfer Function

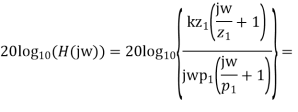
If we take the log10 of this magnitude and multiply it by 20 it takes on the form of


Each of these individual terms is very easy to show on a logarithmic plot. The entire Bode log magnitude plot is the result of the superposition of all the straight-line terms. This means with a little practice; we can quickly sketch the effect of each term and quickly find the overall effect. To do this we have to understand the effect of the different types of terms.
These included:- 1. Constant term K
2. Poles and zeroes at the origin 
3. Poles and zeroes not at the origin 
Effect of Constant Terms: Constant terms such as K contribute a straight horizontal line of magnitude 20 log10(K)

Effect of Individual Zeros and Poles at the origin: A zero at the origin occurs when there is an s or j multiplying the numerator. Each occurrence of this causes a positively sloped line passing through sj= 1 with a rise of 20 db over a decade

A pole at the origin occurs when there are s or j multiplying the denominator. Each occurrence of this causes a negatively sloped line passing through sj = 1 with a drop of 20 db over a decade

Effect of Individual Zeros and Poles Not at the Origin: Zeros and Poles not at the origin are indicated by the (1+js/zi) and (1+js/pi). The values zi and pi in each of these expressions is called a critical frequency (or break frequency). Below their critical frequency these terms do not contribute to the log magnitude of the overall plot. Above the critical frequency, they represent a ramp function of 20 db per decade. Zeros give a positive slope. Poles produce a negative slope.

To complete the log magnitude vs. Frequency plot of a Bode diagram, we superposition all the lines of the different terms on the same plot.
Nyquist plots are the continuation of polar plots for finding the stability of the closed loop control systems by varying ω from −∞ to ∞. That means, Nyquist plots are used to draw the complete frequency response of the open loop transfer function.
The Nyquist stability criterion works on the principle of argument. It states that if there are P poles and Z zeros are enclosed by the ‘s’ plane closed path, then the corresponding G(s)H(s) plane must encircle the origin P−Z times. So, we can write the number of encirclements N as,
N=P-Z
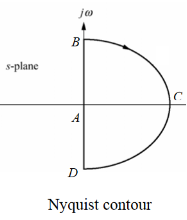
Nyquist Contour: is the contour in the s-plane that includes the entire right half plane. Now, let’s consider  and the contour in the s-plane is the Nyquist contour (i.e., the entire right half plane).
Applying the Cauchy’s Principle of Argument, we should have
The number of rotations about the origin of the mapping through 
N = The number of zeros of 1+ G(s) (H) in the right half plane, Z - The number of
poles of 1+ G(s) (H) in the right half plane, P
Please note
™The mapping through G(s) (H) is virtually the same as the one through 1+ G(s) (H)
except that the contour is shifted one unit to the left. Thus, we can count rotations
about -1 instead of rotations about the origin in the above statement.
™The zeros of 1+ G(s) (H) = the closed-loop poles.
™The poles of 1+ G(s) (H) = the open-loop poles or the poles of 1+ G(s) (H)
Therefore
The number of rotations about -1 of the mapping through 1+ G(s) (H),
N = The number of closed-loop poles in the right half plane, Z - The number of open-loop poles in the right half plane, P
The above relationship is called the Nyquist Criterion; and the mapping through G(S)H(S) is called the Nyquist Diagram of G(S)H(S)
For a system to be stable, Z must be zero.
Sketching the Nyquist Diagram
Suppose the open-loop transfer function 
Sketch its Nyquist diagram
| | GH | |  |
 | 1 | 0 |
 | o |  |
Cross re:   | See above | See above |
Cross re:   | See above | See above |
 | 0.707 | -45  |

Sketching the Nyquist diagram includes two steps:
(1) Sketch the mapping of Point A to Point B, which is the same as the polar plot of frequency response for G(S)H(S).
Note that the semicircle with an infinite radius, i.e., B-C-D, is mapped to the origin if the order the denominator of G(S)H(S) is greater than the order the numerator of G(S)H(S).
(2) Sketch the mapping of Point A to Point D, which is the mirror image about the real axis of the mapping of Point A to Point B.
Gain Margin
The gain margin GM is equal to the reciprocal of the magnitude of the Nyquist plot at the phase cross over frequency.

Where, Mpc is the magnitude in normal scale at the phase cross over frequency.
Phase Margin
The phase margin PM is equal to the sum of 1800 and the phase angle at the gain cross over frequency.

Where, ϕgc is the phase angle at the gain cross over frequency.
The stability of the control system based on the relation between the gain margin and the phase margin is listed below.
- If the gain margin GM is greater than one and the phase margin PM is positive, then the control system is stable.
- If the gain margin GM is equal to one and the phase margin PM is zero degrees, then the control system is marginally stable.
- If the gain margin GM is less than one and / or the phase margin PM is negative, then the control system is unstable.
The closed-loop frequency response reveals important information about the relative stability and the speed of response in the time-domain. For unity-gain feedback configuration (H(s)=1), the closed-loop frequency response is computed as

To proceed further, use rectangular form for the open loop frequency response:


The above relation represents the equation of a circle with centre at 
And radius;  these are described as constant M circles on the
Frequency response plot.
Further, as M→1, X=−1/2, which is a vertical line that separates the circles for M<1 from those with M>1.
The phase relationship similarly reveals an equation for constant phase circles:

Where N = tan  . The constant phase circle iscentred at X =-
 , Y=
, Y=  , and have radius
Resonance Peak
The resonance peak in the frequency response occurs at ω=ωr for ζ<0.7. For a prototype second-order system, we have
Resonant frequency= 
Reasonant peak = 
When the polar plot of the loop gain, KGH(jω), is superimposed onto the constant M and constant N contours, it reveals the magnitude peak Mr in T(jω).
The magnitude peak represents a measure of relative stability, while the resonant frequency associated with it is a measure of speed of response in the time-domain. A value of Mr=1.3 (or 2.5dB) is considered a good compromise between speed and stability.