Unit - 1
Power Flow Analysis
An electric power system is usually understood as a very large network that links power plants (large or small) to loads, by means of an electric grid that may span a whole continent. A power system thus typically extends from a power plant right up to the sockets inside customers’ premises. These are sometimes referred to as full power systems as they are autonomous. Smaller power systems could be made of part or sections of a larger, full system. Figure 1 shows several elements that operate together and are connected to a power supplying network.
Power systems that are supplied by an external electricity source or that produce (by conversion from other sources) electricity and convey it to a larger grid are called partial power systems. The power systems that are of interest for our purposes are the large scale, full power systems that span large distances and have been deployed over decades by power companies.
Generation is the production of electricity at power stations or generating units where a form of primary energy is converted into electricity. Transmission is the network that moves power from one part of a country or a region to another. It is usually a well-interconnected infrastructure in which multiple power lines link different substations, which change voltage levels, offering enhanced redundancy.
Distribution finally delivers the power (we could say locally when compared to the transmission system) to the final loads (a majority of which are supplied at low voltage) via intermediate steps at which the voltage is converted down (transformed) to lower levels.

1.1.1 Power Generation
Power plants convert the energy stored in the fuel (mainly coal, oil, natural gas, enriched uranium) or renewable energies (water, wind, solar) into electric energy. Conventional modern generators produce electricity at a frequency that is a multiple of the rotation speed of the machine. Voltage is usually no more than 6 to 40 kV. The power output is determined by the amount of steam driving the turbine, which depends mainly on the boiler. The voltage of that power is determined by the current in the rotating winding (i.e., the rotor) of the synchronous generator. The output is taken from the fixed winding (i.e., the stator). The voltage is stepped up by a transformer, normally to a much higher voltage. At that high voltage, the generator connects to the grid in a substation.
Traditional power plants generate ac power from synchronous generators that provide three-phase electric power, such that the voltage source is actually a combination of three ac voltage sources derived from the generator with their respective voltage phasors separated by phase angles of 120°. Wind turbines and mini hydro units normally employ asynchronous generators, in which the waveform of the generated voltage is not necessarily synchronized with the rotation of the generator. DG refers to generation that connects into the distribution system, as opposed to conventional centralized power generation systems.
1.1.2 Transmission System
Power from generation plants is carried first through transmission systems, which consist of transmission lines that carry electric power at various voltage levels. A transmission system corresponds to a networked, meshed topology infrastructure, connecting generation and substations together into a grid that usually is defined at 100 kV or more. The electricity flows over high-voltage (HV) transmission lines to a series of substations where the voltage is stepped down by transformers to levels appropriate for distribution systems. Medium voltage (MV) as a concept is not used in some countries (e.g., United Kingdom and Australia), it is “any set of voltage levels lying between low and high voltage” and the problem to define it is that the actual boundary between MV and HV levels depends on local practices. Transmission lines are deployed with three wires along with a ground wire. Virtually all ac transmission systems are three-phase transmission systems.
1.1.3 Distribution Systems
Distribution segment is widely recognized as the most challenging part of the smart grid due to its ubiquity. Voltage levels of 132 kV or 66 kV are usual HV levels that can be found in distribution networks. Voltages below that (e.g., 30, 20, 10 kV) are commonly found in MV distribution networks. The grid topologies can be classified in three groups-
(a) Radial Topology
Radial lines are used to connect primary substations (PSs) with secondary substations (SSs), and the SSs among them. These MV lines or “feeders” can be used exclusively for one SS or can be used to reach several of them. Radial systems keep central control of all the SSs.

(b) Ring Topology
This is a fault-tolerant topology to overcome the weakness of radial topology when there is a disconnection of one element of the MV line that interrupts electricity service (outage) in the rest of the connected substations. A ring topology is an improved evolution of the radial topology, connecting substations to other MV lines to create redundancy. Independently of the physical configuration, the grid is operated radially, but on the event of a failure in a feeder, other elements are maneuvered to reconfigure the grid in such a way that outages are avoided.
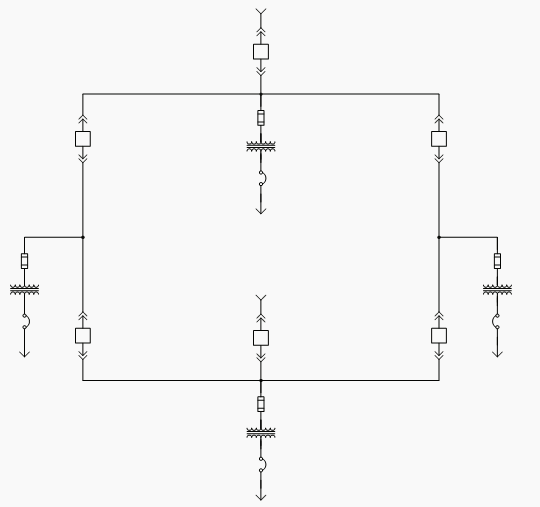
(c) Network Topology
Networked topology consists of primary and secondary substations connected through multiple MV lines to provide a variety of distribution alternatives. Thus, the reconfiguration options to overcome faults are multiple, and in the event of failure, alternative solutions may be found to reroute electricity. LV grids present more complex and heterogeneous topologies than MV grids. The exact topology of LV systems depends on the extension and specific features of the service area, the type, number and density of points of supply (loads), country-specific and utility-specific operating procedures, and range of options in international standards.
An SS typically supplies electricity to one or several LV lines, with one or multiple MV-to-LV transformers at the same site. LV topology is typically radial, having multiple branches that connect to extended feeders, but there are also cases of networked grids and even ring or dual-fed configurations in LV networks.LV lines are typically shorter than MV lines, and their characteristics are different depending on the service area.

Key Takeaway
This topic covers the structure of the Power System where distribution network is defined and how the power is distributed through different channels.
(a) Synchronous Generators
The synchronous generators used in generating stations are revolving field type owing to its inherent advantages. The synchronous generators, based on the type of prime movers to which they are mechanically coupled, may be classified as:
(i) Hydro-generators
(ii) Turbo-generators, and
(iii) Diesel engine driven generators.
(b) Power Transformers
Power transformers are used for stepping-up the voltage for transmission at generating stations and for stepping-down voltage for further distribution at main step-down transformer substations. Usually naturally cooled, oil immersed, known as ON type, two winding, three-phase transformers, are used up to the rating of 10 MVA. The transformers of rating higher than 10 MVA are usually air blast cooled. For very high rating, the forced oil, water cooling and air blast cooling may be used. For regulating the voltage, the transformers used are provided with on load tap changer. They are put in operation during load hours and disconnected during light load hours i.e., they are usually operated at approximately full load. This is possible because they are arranged in banks and can be thrown in parallel with other units or disconnected at will. So, power transformers are designed to have maximum efficiency at or near full load (i.e., with iron loss to full-load copper loss ratio of 1: 1).
Power transformers are designed to have considerable leakage reactance than is permissible in distribution transformers because in power transformers inherent voltage regulation is not as much important as current limiting effect of the higher leakage reactance. Power transformers usually make use of flux density of 1.5 to 1.77; have percentage impedance ranging from 6-18% and regulation 6-10%.
(c) Switch Gear
A switch is used for opening and closing of an electric circuit while a fuse is used for over-current protection. Every electric circuit needs a switching device and protective device. Switching and protective devices have been developed in different forms. Switchgear is a general term covering a wide range of equipment concerned with switching and protection. In a power system switchgear serves two basic purposes- (i) Switching during normal operating conditions for the purpose of operation and maintenance. (ii) Switching during abnormal conditions such as short-circuits and interrupting the fault currents.
(d) Bus-Bars
Bus-bar (or bus in short) term is used for a main bar or conductor carrying an electric current to which many connections may be made. Bus-bars are merely convenient means of connecting switches and other equipment into various arrangements. The usual arrangement of connections in most of the substations permits working on almost any piece of equipment without interruption to incoming or outgoing feeders. In some arrangements two buses are provided to which the incoming or outgoing feeders and the principal equipment may be connected. One bus is usually called the “main” bus and the other “auxiliary” or “transfer” bus. The main bus may have a more elaborate system of measuring instruments, relays etc. associated with it. The switches used for connecting feeders or equipment to one bus or the other are called “selector” or “transfer” switches.
Bus-bars may be of copper, aluminium or steel. Copper has a comparatively low resistivity and also the advantage of relatively high mechanical strength; this makes it economical to use copper bus-bars in installations of very large capacity where the currents are particularly heavy.
(e) Lightning Arrestors
The lightning arrester is a surge diverter and is used for the protection of power system against the high voltage surges. It is connected between the line and earth and so diverts the incoming high voltage wave to the earth. Lightning arresters act as safety valves designed to discharge electric surges resulting from lightning strokes, switching or other disturbances, which would otherwise flash-over insulators or puncture insulation, resulting in a line outage end possible failure of equipment.
They are designed to absorb enough transient energy to prevent dangerous reflections and to cut off the flow of power-frequency follow (or dynamic) current at the first current zero after the discharge of the transient. They include one or more sets of gaps to establish the breakdown voltage, aid in interrupting the power follow current, and prevent any flow of current under normal conditions (except that gap shunting resistors, when used to assure equal distribution of voltage across the gaps, permits a very small leakage current). Either resistance (valve) elements to limit the power follow current to values the gaps can interrupt, or an additional arc extinguishing chamber to interrupt the power follow current are connected in series with gaps. Arresters have a short time lag of breakdown compared with the insulation of apparatus, the breakdown voltage being nearly independent of the steepness of the wave front.
Key Takeaway
This topic covers the different components of a power system and how power is delivered through different modes like Radial Topology, Ring Topology & Network Topology
In a power system, power is injected into a bus from generators, while the loads are tapped from it. There may be some buses with only generators and there may be other only with loads. Some buses have generators and loads while some other may have static capacitors for reactive power compensation. The surplus power at some of the buses is transported through transmission lines to the bus deficient in power. Single line diagram of a simple 4-bus system with generators and load at each bus is shown in the figure. Let SGi denote the 3-phase complex generator power flowing into the ith bus and SDi denotes the 3-phase complex power demand at the ith bus. Let SGi and SDi may be represented as-
SGi = PGi + jQGi
SDi = PDi + jQGi
Net complex power injected into the bus is given as
Si= Pi + jQi = (PGi – PDi) + j (QGi – QDi)
The real & reactive power injected into the ith bus is then,
Pi = PGi - PDi
Qi = QGi - QDi
Where i = 1, 2, 3, 4…n
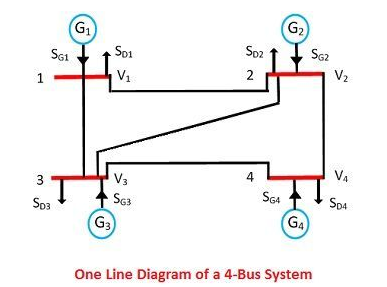
A network model of the given power system worked out on the above line is shown below in the figure. S1, S2, S3, S4 denote the net 3-phase complex power flowing into the buses and I1, I2, I3, I4 denotes the current flowing into the buses. Each transmission line is represented by a π-circuit.
The equivalent circuit of 4-bus system is shown in the figure below. All the sources of the bus system connected to the common reference at ground potential and the shunt admittance at the busses have been lumped. Besides the ground node, it has four other nodes or buses at which the current from the source is injected into the network. The line admittance between nodes i and k is represented by yik = yki. Further, the mutual admittance between lines is assumed to be zero.

Applications of Kirchhoff’s current law to the four nodes gives the following equation.
I1 = V1y10 + (V1-V2) y12 + (V1-V2)
I2 = V2y20 + (V2-V1) y12 + (V2-V3) y23 + (V2-V4) y24
I3 = V3y30 + (V3-V1) y13 + (V3-V2) y23 + (V3-V4) y34
I4 = V4y40 + (V4-V2) y24 + (V4-V3) y34
The above equation can be arranged & written in matrix form as below
 =
= 

The self-admittance matrix is given as


The mutual admittances for the matrix are given as


Matrix is written in terms of self-bus admittance  and mutual-bus admittance
  as follows: -
[
 is known as self-admittance (or driving point admittance) of the ith node and is equal to the sum of the admittance connected to the ith node. Each off-diagonal term Yik is known as mutual admittance (or transfer admittance) between ith and kth node and is equal to the negative of the sum of all the admittances connected directly between ith and kth node.
The equation can be written in compact form as

where [ I] is the n-bus matrix, [ V] is the n-bus voltage matrix and, [ Ybus] is called bus admittance matrix and is written as


and is called the bus admittance matrix and V and I are the n-element node voltage matrix and current node matrix respectively.
Key Takeaway
Diagonal elements are dominating. Off diagonal elements are symmetric. The diagonal element of each node is the sum of the admittances connected to it. The off-diagonal element is negated admittance
The admittance matrix of a power system is an abstract mathematical model of the system. It consists of admittance values of both lines and buses. The Y-bus is a square matrix with dimensions equal to the number of buses. This matrix is symmetrical along the diagonal-
 The values of diagonal elements
  are equal to the sum of the admittances connected to bus ‘
 ’. The off-diagonal elements
  are equal to the negative of the admittance connecting the two busses
  &
& , Y-bus is parse matrix-


The net injected power at any bus can be calculated using the bus voltage ( ), neighboring bus voltages (
 ), and admittances between the bus and its neighboring buses (
 ) as shown in the figure below-


Rearranging the elements as a function of voltages, the current equation becomes as follows:
Ii=Vi(yi0+yi1+yi2+...+yij)−V1yi1−V2yi2−…−VjyijIi=Viyi0+yi1+yi2+..+yij−V1yi1−V2yi2−…−Vjyij
Ii=Vi∑j=0j≠iyij−∑j=1j≠iyijVj=ViYii+∑j=1j≠iYijVj
The power equation at any bus can be written as follows:
 Or
Or 
Substituting the expression on the current in  equation results in the following formula-

Real & Reactive Power can be calculated from the following equations-


OR


Key Takeaway
This topic derives the real & reactive power consumed or delivered in a bus matrix.
A bus in a power system is defined as the vertical line at which the several components of the power system like generators, loads, and feeders, etc., are connected. The buses in a power system are associated with four quantities. These quantities are the magnitude of the voltage, the phase angle of the voltage, active or true power and the reactive power.
In the load flow studies, two variables are known, and two are to be determined. Depends on the quantity to be specified the buses are classified into three categories generation bus, load bus and slack bus.
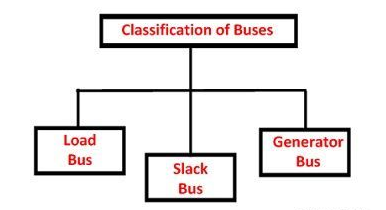
The table shown below shows the types of buses and the associated known and unknown value.

Generation Bus or Voltage control bus
This bus is also called the P-V bus, and on this bus, the voltage magnitude corresponding to generate voltage and true or active power P corresponding to its rating are specified. Voltage magnitude is maintained constant at a specified value by injection of reactive power. The reactive power generation Q and phase angle δ of the voltage are to be computed.
Load Bus
This is also called the P-Q bus and at this bus, the active and reactive power is injected into the network. Magnitude and phase angle of the voltage are to be computed. Here the active power P and reactive power Q are specified, and the load bus voltage can be permitted within a tolerable value, i.e., 5 %. The phase angle of the voltage, i.e., δ is not very important for the load.
Slack, Swing or Reference Bus
Slack bus in a power system absorbs or emit the active or reactive power from the power system. The slack bus does not carry any load. At this bus, the magnitude and phase angle of the voltage are specified. The phase angle of the voltage is usually set equal to zero. The active and reactive power of this bus is usually determined through the solution of equations.
The slack bus is a fictional concept in load flow studies and arises because the I2R losses of the system are not known accurately in advance for the load flow calculation. Therefore, the total injected power cannot be specified at every bus. The phase angle of the voltage at the slack bus is usually taken as reference or zero
Key Takeaway
This topic covers type of buses, known/predicted quantities and unknown quantities of a bus to be determined.
Consider bus of a power system network as shown in figure below. Transmission lines are represented by equivalent π models where impedances have been converted to per unit admittances on a common MVA base.
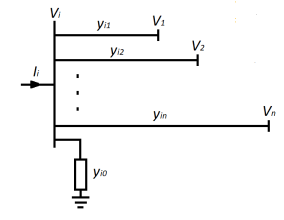
Apply KCL to get the results;


The real & reactive power at bus ‘i’ is


From this relationship, the mathematical formulation of the power flow problem results in a system of algebraic nonlinear equations which must be solved by iterative techniques.
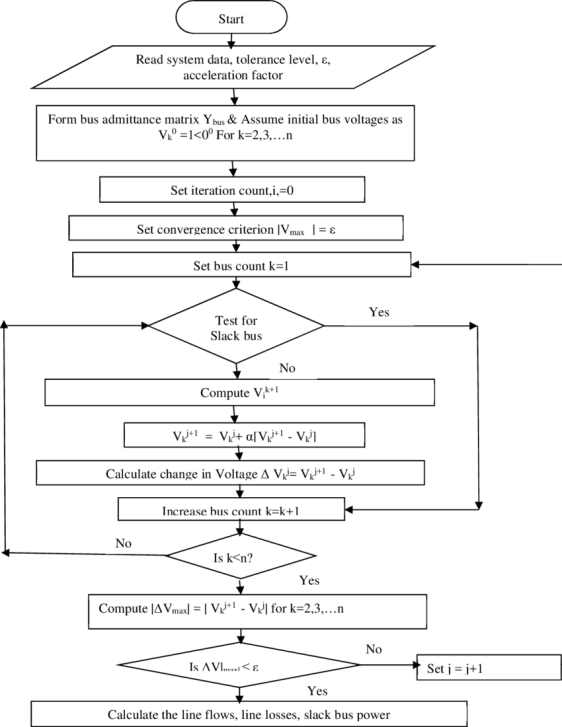
In power flow study, it is essential to solve the set of non-linear equations for two unknown variables at each node. In Gauss-Seidel method, Vi is solved and the iterative sequences become-

Where,
 is the actual admittance in per unit
 are the net real & reactive powers in per unit
In KCL, current entering bus i was assumed positive. Thus, for buses where real and reactive powers are injected into the bus, such as generator buses,  have positive values. For load buses where real and reactive powers are flowing away from the bus i,
  have negative values.


Rewriting the power flow equation in terms of the bus admittance matrix (Y-bus). Since the off-diagonal elements of the bus admittance matrix Ybus shown by uppercase letters, Yij = -yij the diagonal elements are Yii = ∑yij, the equation becomes-

Yii includes the admittance to ground of life charging susceptance & any other fixed admittance to ground. Since both the components V & δ are specified for slack bus, there are 2(n-1) equations which must be solved iteratively. Under normal operating conditions, V of buses is in neighborhood of 1.0 per unit or close to the V of the slack buses. V of load buses are lower than the slack bus value, depending on reactive power demand whereas the scheduled voltage at the generator buses are higher.
The δ of the load buses are below reference angle in accordance to power demand whereas the δ of the generator buses may be above the reference value depending upon the amount of real power flowing into the bus. Thus, for Gauss Seidel method, an initial voltage estimates of 1.0+j0.0 for unknown voltage is satisfactory & the converged solution correlates with actual operating states.
For P-Q buses (load buses),  &
&  are known. Starting with an initial estimate
  is solved for the real & imaginary components of voltage. For P-V buses (regulated buses),
  & |Vi| are specified,
  is solved, then used in
  . Since |Vi| is specified, only imaginary part of
  is retained. And its real part is selected in order to satisfy-

Where,  &
&  are the real & imaginary components of the voltage
  in the iterative sequence.
The rate of convergence is increased by applying acceleration factor- α to the approximate solution obtained from each iteration.

Α is the acceleration factor & it is in the range of 1.3 to 1.7. The process is continued until changes in the real & imaginary components of bus voltages between successive iterations are within specified accuracy.


A voltage in accuracy is in the range of 0.00001 to 0.00005 per unit is satisfactory. • In practice, the method for determining the completion of a solution is based on an accuracy index set up on the power mismatch. The iteration continues until the magnitude of the largest element in the ΔP & ΔQ columns in less than specified value. Normally mismatch accuracy is 0.001 per unit. After solving for bus voltages & angles, power flows & losses in the network branches are calculated.
Flow Chart for Gauss Seidel Method.
Key Takeaway
Iterative method to calculate the line flows, losses & slack bus power.
Load flow solution is an unavoidable tool for power system planning and operation. NR and its derivatives are the most popular and widely used ones among the various methods of load flow solution techniques. In NR method one of the generator buses is treated as slack bus which is kept out of calculation during iterations. This is because of the fact that the slack bus is to carry entire loss of the system and total loss cannot be calculated before the end of iterations [8]. The exclusion of slack bus from the load flow iteration restricts many analyses to make. Consideration of distributed slack bus, load flow for Micro grids, study on minimization of system losses etc. cannot be performed when the slack bus is excluded from the iterations.
The results obtained from this analysis comprises the real and reactive power flow on transmission lines, reactive powers on generator buses, magnitudes and phase angles of load bus voltages. NR method of load flow analysis is an iterative method which approximates the set of nonlinear simultaneous equations to a set of linear simultaneous equations using Taylor’s series expansion and the terms are limited to first order approximation. The non-linear equations governing the power system network are:

Where, Si is the complex power in bus i
Vi is the bus voltage at bus i given as
 and
and 
Where,  = is the bus angle at node i
e is the Euler’s constant
 is the complex voltage at node i
Also
 ,
,
Where Vk is the voltage at bus k
 is the bus angle at node k
Ii is the current injected into bus i, given by


Where Yik is the admittance at bus I & k
Qik is the admittance angle at nodes i & k
Pi & Qi is the real & reactive power respectively at bus i

Separate the conjugate complex power in to real & imaginary power & we will get


The above equations constitute the polar form of the power flow equations that provide the calculated values for the net real power Pi & reactive power Qi entering the bus i. Denoting the calculated values of Pi by Pi cal and Qi by Qi cal leads to definition of mismatches ΔPi & ΔQi
Hence,


Mismatches occur when Pi cal & Qi cal do not coincide with scheduled values.
The set of linear equations formed expressing the relationship between changes in real and reactive power components of the bus voltages can be written in compact form as

The Jacobian Matrix J11 J12 is set up as a partitioned matrix by conventional form

The off diagonal and diagonal term in the sub-matrices are real numbers calculated by partial differentiation of above equations 𝜎𝑖 and |𝑉𝑖 |. The Newton-Raphson method solves the polar form of the power flow equations until the mismatches at all buses fall within specified tolerances.
Flowchart of Newton Raphson Method

Key Takeaway
Iterative method to calculate line flows, line losses & output of load flow analysis in a power system.
Key Takeaway
This topic helps to analyze the different challenges faced in the large-scale power system for system reliability & analysis
References:
1. Power system Analysis-by John J Grainger William D Stevenson, TMC Companies, 4th edition.
2. The Power System Analysis and Design by B.R. Gupta, Wheeler Publishing
3. Power System Analysis by Hadi Saadat – TMH Edition.
4. Modern Power System Analysis by I.J. Nagaraj and D.P.