Unit-6
Closed loop frequency response
The transfer function of second order system is shown as
C(S)/R(S) = W2n / S2 + 2ξWnS + W2n - - (1)
ξ = Ramping factor
Wn = Undamped natural frequency for frequency response let S = jw
C(jw) / R(jw) = W2n / (jw)2 + 2 ξWn(jw) + W2n
Let U = W/Wn above equation becomes
T(jw) = W2n / 1 – U2 + j2 ξU
So,
| T(jw) | = M = 1/√(1 – u2)2 + (2ξU)2 - - (2)
T(jw) = φ = -tan-1[ 2ξu/(1-u2) ] - - (3)
For sinusoidal input the output response for the system is given by
C(t) = 1/√(1-u2)2 + (2ξu)2Sin[wt - tan-1 2ξu/1-u2] - - (4)
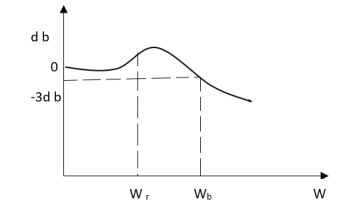
The frequency where M has the peak value is known as Resonant frequency Wn. This frequency is given as (from eqn (2)).
DM/du|u=ur = Wr = Wn√(1-2ξ2) - - (5)
From equation(2) the maximum value of magnitude is known as Resonant peak.
Mr = 1/2ξ√1-ξ2 - - (6)
The phase angle at resonant frequency is given as
Φr = - tan-1 [√1-2ξ2/ ξ] - - (7)
As we already know for step response of second order system the value of damped frequency and peak overshoot are given as
Wd = Wn√1-ξ2 - - (8)
Mp = e- πξ2|√1-ξ2 - - (9)
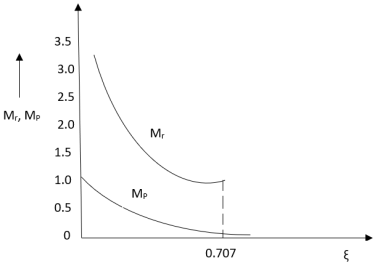
The comparison of Mr and Mp is shown in figure(1).
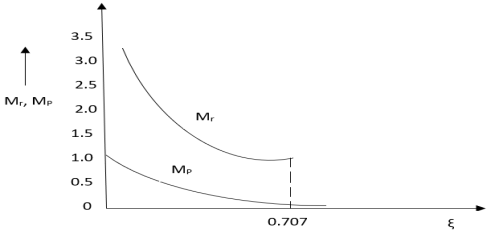
The two performance indices are correlated as both are functions of the damping factor ξ only. When subjected to step input the system with given value of Mr of its frequency response will exhibit a corresponding value of Mp.
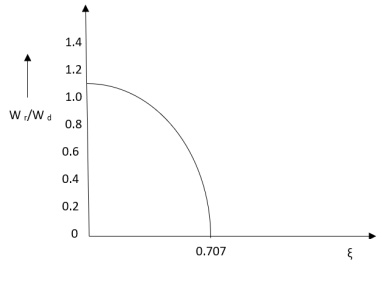
Similarly the correlation of Wr and Wd is shown in fig(2) for the given input step response [ from eqn(5) & eqn(8) ]
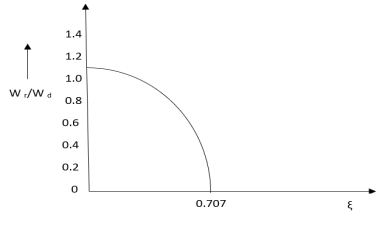
Wr/Wd = √(1- 2ξ2)/(1-ξ2)
Mp = Peak overshoot of step response
Mr = Resonant Peak of frequency response
Wr = Resonant frequency of Frequency response
Wd = Damping frequency of oscillation of step response.
From fig(1) it is clear that for ξ> 1/2, value of Mr doesnot exists.
Frequency Domain Specifications –
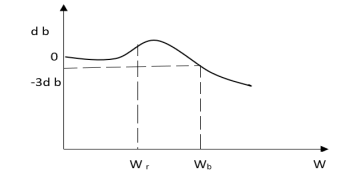
1>. Resonant Peak(Mr) :The maximum value of magnitude is known as Resonant peak. The relative stability of the system can be determined by Mr. The larger the value of Mr the undesirable is the transient response.
2>. Resonant Frequency(Wr) : The frequency at which magnitude has maximum value.
3>. Bandwidth : The band of frequencies lying between -3db points.
4>. Cut-off frequency –The frequency at which the magnitude is 3db below its zero frequency.
5>. Cut-off Rate – It is the slope of the log magnitude curve near the cut off frequency.
Nicholas Chart
The Bode plot is generally constructed for an open loop transfer function of a system. In order to draw the Bode plot for a closed loop system, the transfer function has to be developed, and then decomposed into its poles and zeros. This process is tedious and cannot be carried out without the ais of a very powerful calculator or a computer. Nichols, developed a simple process by which the unity feedback closed loop frequency response of a system can be easily deduced from the open loop transfer function.
Constant magnitude loci that are M-circles and constant phase angle loci that are N-circles are the fundamental components in designing the Nichols chart. The constant M and constant N circles in G (jω) plane can be used for the analysis and design of control systems. However the constant M and constant N circles in gain phase plane are prepared for system design and analysis as these plots supply information with fewer manipulations. Gain phase plane is the graph having gain in decibel along the ordinate (vertical axis) and phase angle along the abscissa (horizontal axis). The M and N circles of G (jω) in the gain phase plane are transformed into M and N contours in rectangular co-ordinates. A point on the constant M loci in G (jω) plane is transferred to gain phase plane by drawing the vector directed from the origin of G (jω) plane to a particular point on M circle and then measuring the length in db and angle in degree.
The critical point in G (jω), plane corresponds to the point of zero decibel and -180o in the gain phase plane. Plot of M and N circles in gain phase plane is known as Nichols chart /plot.Compensators can be designed using Nichols plot. This is used in signal processing and control design.
The complete Nichols chart extends for the phase angle of G (jω) from 0 to -360o. The region of ∠G(jω) used for analysis of systems in between -90o to -270o. These curves repeat after every 180o interval.If the open loop transfer function of unity feedback system G(s) is expressed as
G(s)=G(s) =G(s)[cos
 +jsin
+jsin ]
]
The closed loop transfer function is M(s)=
Let s=jω
G(jω)=G(jω)[cos +jsin
+jsin ]
]
And
M(jω)=M =
=
Eliminating G(jω)
M= +2G(jω)cos
 +1
+1
φ=tan-1sin /G(j
/G(j +cos
+cos
Advantages of Nicholas Chart
1) Gain and phase margin can be determined easily and also graphically.
2) Closed loop frequency response is obtained from open loop frequency response.
3) Gain of the system can be adjusted to suitable values.
4) Nichols chart provides frequency domain specifications
Enter your email below to receive FREE informative articles on Electrical &
Reference Books :
- Modern Control Engineering by K.Ogata, Pearson Education.
2. Control Engineering by Kuo.