Unit-3
Baseband Detection
The Primary causes of error performance in degradation in communication systems are
In digital communications
Depends on Eb/No
Eb/No = S/N
Eb is bit energy and can be described as signal power S times the bit time Tb. N0 is noise power spectral density, and can be described as noise power N divided by bandwidth W. Power spectral density (PSD) is the average power, Px of a real- valued power signal x(t), defined over the interval/ period. Where the time average is taken over the signal period T0 as follows:

Since the bit time and bit rate Rb are reciprocal, we can replace Tb with 1/Rb and write

Therefore, simplify the notation throughout the book, by using R instead of Rb to represent bits/s. Eb/N0 is just a version of S/N normalized by bandwidth and bit rate, as follows

The important metrics of performance in digital communication systems is a plot of the bit-error probability P B versus Eb/N0. Plot of the bit-error probability PB versus Eb/N0.
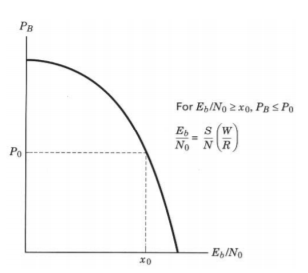
Fig 1 Error Performance
Eb/No is a measure of normalized signal-to-noise ratio (SNR).
Key takeaway
SNR refers to average signal power & average noise power can be degrade in two ways
1.Through the decrease of the desired signal power.
2.Through the increase of noise power or interfering signal.
Signal to noise ratios and Eb/No figures are parameters that are more associated with radio links and radio communications systems. In terms of this, the bit error rate, BER, can also be defined in terms of the probability of error or POE. The determine this, three other variables are used. They are the error function, erf, the energy in one bit, Eb, and the noise power spectral density. The energy per bit, Eb, can be determined by dividing the carrier power by the bit rate and is a measure of energy with the dimensions of Joules. No is a power per Hertz. The bit error rate and probability of error are related as

If a filter produces an output in such a way that it maximizes the ratio of output peak power to mean noise power in its frequency response, then that filter is called Matched filter.
Fig.2: Matched filter
Frequency Response Function of Matched Filter
The frequency response of the Matched filter will be proportional to the complex conjugate of the input signal’s spectrum. Mathematically, we can write the expression for frequency response function, H(f) of the Matched filter as −
H(f)=GaS∗(f)e−j2πft1 ………..1
Where,
Ga is the maximum gain of the Matched filter
S(f) is the Fourier transform of the input signal, s(t)
S∗(f) is the complex conjugate of S(f)
t1 is the time instant at which the signal observed to be maximum
In general, the value of Ga is considered as one. We will get the following equation by substituting Ga=1in Equation 1.
H(f)=S∗(f)e−j2πft1 ……..2
The frequency response function, H(f) of the Matched filter is having the magnitude of S∗(f)and phase angle of e−j2πft1, which varies uniformly with frequency.
Impulse Response of Matched Filter
In time domain, we will get the output, h(t) of Matched filter receiver by applying the inverse Fourier transform of the frequency response function, H(f).
h(t)= ….….3
….….3
Substitute, Equation 1 in Equation 3.
h(t)=
⇒h(t)= ………4
………4
We know the following relation.
S∗(f)=S(−f) ……..5
Substitute, Equation 5 in Equation 4.
h(t)=
⇒h(t)=
⇒h(t)=Gas(t1−t)
In general, the value of Ga is considered as one. We will get the following equation by substituting Ga=1.
h(t)=s(t1−t)
The above equation proves that the impulse response of Matched filter is the mirror image of the received signal about a time instant t1. The following figures illustrate this concept.
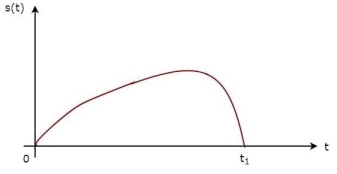
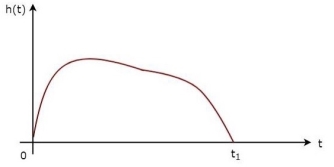
Fig.3: Impulse response of Matched filter
The received signal, s(t) and the impulse response, h(t) of the matched filter corresponding to the signal, s(t) are shown in the above figures.
Key Takeaways:
The frequency response function, H(f) of the Matched filter as −
H(f)=GaS∗(f)e−j2πft1 ………..1
Where,
Ga is the maximum gain of the Matched filter
S(f) is the Fourier transform of the input signal, s(t)
S∗(f) is the complex conjugate of S(f)
t1 is the time instant at which the signal observed to be maximum
Impulse response, h(t)=s(t1−t)
This is a form of distortion of a signal, in which one or more symbols interfere with subsequent signals, causing noise or delivering a poor output.
Causes of ISI
The main causes of ISI are −
The ISI is unwanted and should be completely eliminated to get a clean output. The causes of ISI should also be resolved in order to lessen its effect.
To view ISI in a mathematical form present in the receiver output, we can consider the receiver output.
The receiving filter output y(t)y(t) is sampled at time ti=iTb (with i taking on integer values), yielding –
y(ti)= μ∑akp(iTb−kTb)
= μai+μ∑akp(iTb−kTb)
In the above equation, the first term μai is produced by the ith transmitted bit.
The second term represents the residual effect of all other transmitted bits on the decoding of the ith bit. This residual effect is called as Inter Symbol Interference.
In the absence of ISI, the output will be −
y(ti)=μai
This equation shows that the ith bit transmitted is correctly reproduced. However, the presence of ISI introduces bit errors and distortions in the output.
While designing the transmitter or a receiver, it is important that you minimize the effects of ISI, so as to receive the output with the least possible error rate.
Key takeaway
y(ti)= μ∑akp(iTb−kTb)
The second term represents the residual effect of all other transmitted bits on the decoding of the ith bit. This residual effect is called as Inter Symbol Interference.
Nyquist proposed a condition for pulses p(t) to have zero–ISI when transmitted through a channel with sufficient bandwidth to allow the spectrum of all the transmitted signal to pass. Nyquist proposed that a zero–ISI pulse p(t) must satisfy the condition

A pulse that satisfies the above condition at multiples of the bit period Tb will result in zero– ISI if the whole spectrum of that signal is received. The reason for which these zero–ISI pulses (also called Nyquist–criterion pulses) cause no ISI is that each of these pulses at the sampling periods is either equal to 1 at the centre of pulse and zero the points other pulses are centred.
There is a set of pulses known as raised–cosine pulses that satisfy the Nyquist criterion and require slightly larger bandwidth than what a sinc pulse requires.
The spectrum of these pulses is given by
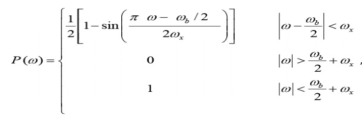
Where ω b is the frequency of bits in rad/s (ω b = 2 /Tb), and x is called the excess bandwidth and it defines how much bandwidth would be required above the minimum bandwidth that is required when using a sinc pulse. The excess bandwidth ω x for this type of pulses is restricted between

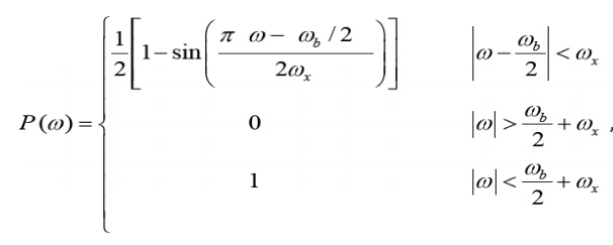
Fig 4 Pulse Response
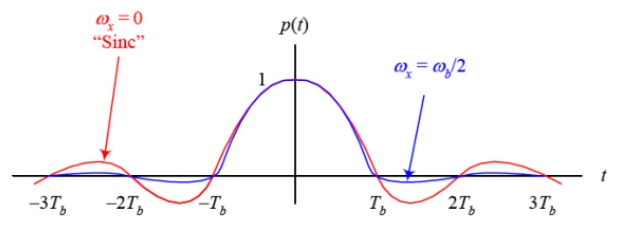
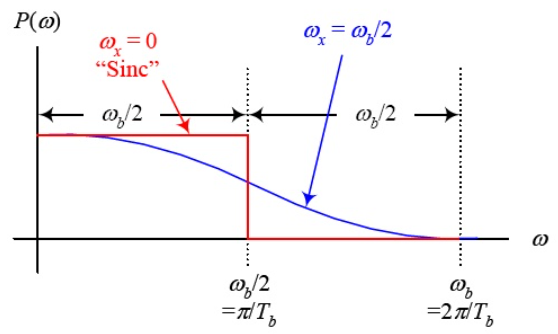
For ωx = 0 the wave is rect function and the pulse is sinc function. When ωx = ωb/2 the spectrum is sinc function but decays early. The expense for having a pulse that is short in time is that it requires a larger bandwidth than the sinc function. The waveform is shown below

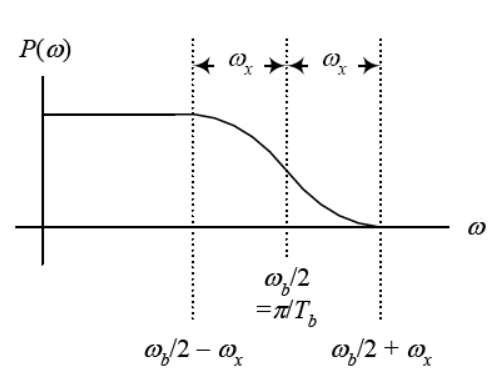
Fig 5 Pulse and its spectrum for ωx = ωb/2 and ωx = 0
The roll-off factor is the ratio of extra bandwidth required for the pulses to the minimum bandwidth required by sinc function.
Key takeaway
The roll-off factor is the ratio of extra bandwidth required for the pulses to the minimum bandwidth required by sinc function.
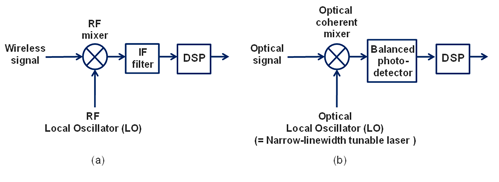
Coherent detection is well known in wireless communication systems. In those wireless systems, a radio frequency (RF) local oscillator (LO) is tuned to “heterodyne”, which is a signal processing technique which combine a high-frequency signal f1 with another f2 to produce a lower frequency signal (f1 – f2), with a received signal through an RF mixer, as shown in Fig.(a), so that both the amplitude and phase information contained in an RF carrier can be recovered in the following digital signal processor (DSP).
For an optical coherent system, a narrow-linewidth tunable laser, serving as an LO, tunes its frequency to “intradyne” with a received signal frequency through an optical coherent mixer, as shown in Fig. (b), and thereby recovers both the amplitude and phase information contained in a particular optical carrier.
Here, “intradyne” means that the frequency difference between an LO and a received optical carrier is small and within the bandwidth of the receiver, but does not have to be zero.
This implies that the frequency and phase of an LO do not have to be actively controlled to an extreme accuracy, therefore avoiding the use of a complicated optical phase locked loop.

Fig 6 Local Oscillator
In contrast to coherent detection is direct detection, typically used by 10Gb/s or lower-speed systems. In a direct detection receiver, its photo-detector only responds to changes in the receiving signal optical power, and cannot extract any phase or frequency information from the optical carrier.
Advantages of Coherent detection :
(1) Greatly improved receiver sensitivity.
(2) Can extract amplitude, frequency, and phase information from an optical carrier, and consequently can achieve much higher capacity in the same bandwidth.
(3) Its DSP can compensate very large chromatic and polarization mode dispersion due to optical fibers, and eliminate the need for optical dispersion compensators and the associated optical amplifiers.
(4) When using balanced detectors with a high common mode noise rejection ratio (CMRR), not only signal-to-noise ratio (SNR) can be improved further, but also agile wavelength selection can be achieved by LO tuning without the use of an optical filter or demultiplexer.
The laser phase noise of an LO is an important impairment in coherent systems as it impacts the “phase coherence”. The “linewidth” parameter of a laser diode is directly related to its phase noise.
Its impact has become as huge as what commercial laser diodes and erbium-doped fiber amplifiers have brought to the industry. Consequently, long-haul networks have already become coherent-centric today, while metro optical networks are bound to become coherent-centric in the next few years.
The Error Probabilities
Having characterized the decision variable Y (T0), we can now give analytical expressions for the error probabilities P(e|i), i = 0, 1, where P(e|0) denotes the probability that the decision made by the receiver is wrong when 0 is sent (i.e., when s0(t) is transmitted), and P(e|1) denotes the probability that the decision made by the receiver is wrong when 1 is sent.
The receiver is wrong when 1 is sent if and only if the input to the threshold device is less than or equal to the threshold α. Under this condition that 1 is sent, the input Y (T0) to the threshold device is the random variable Y0(T0). Let X = Y (T0) and fX(x|i) be the pdf of X given that digit i is sent, i = 0, 1. We denote the X being Gaussian with mean µ and variance σ 2 by N(µ, σ2 ). From the previous discussions, we have fX(x|i) is equal to the pdf of a Gaussian random variable with mean sio(T0) and variance σ2, i.e., the pdf of a Gaussian variables with N(sio(T0), σ2 ) for i = 0, 1. Thus
The Probability of error when 0 is sent

By taking advantage of the fact that (−1)i is equal to 1 if i = 0 and is −1 if i = 1, we can summarize the key result as follows. If the transmitted signals are s0(t) and s1(t), and if µi(T0) = sio(T0) is equal to the mean of the signal component of the output of the filter h(t), sampled at time T0: 0 < T0 ≤ T, then probability of error given the signal si(t) is transmitted is

where α is the threshold, T0 is the sampling time, and σ is the standard deviation of the output of the filter.
On-Off Signals
Consider a binary communication system with the signals s1(t) = s(t) and s0(t) = 0 where s(t) = A > 0 for 0 ≤ t < T and otherwise s(t) = 0. The receiver filter has impulse response h(t) = s(T −t), i.e., the filter is the matched filter, and the sampling time is T0 = T. The output signal s1o(t) is given by

and the output signal s0o(t) is identically zero. It follows that µ1(T) = s1o(T) = A2T and µ0(T) = 0. For an AWGN channel with psd N0/2 and threshold α, the error probabilities obtained


The energy of the signal since h(t) = s(T − t), denoted as E. Thus, the variance σ2 = 1/2N0A2T = 1/2N0E

The typical selection for the threshold is to be in the range 0 < α < A2T

The average probability of error is defined as

If the two signals are transmitted equally likely, i.e., P{1 is sent} = P{ 0 is sent} = 1/2, then we have

Key takeaway
Coherent detection is well known in wireless communication systems. In those wireless systems, a radio frequency (RF) local oscillator (LO) is tuned to “heterodyne”, which is a signal processing technique which combine a high-frequency signal f1 with another f2 to produce a lower frequency signal (f1 – f2).
References
1. “Communication Systems”, Simon Haykin, Wiley publication, 4th Edition, 2004
2. “Digital Communication Fundamentals and Applications”, Bernard Sklar, Pearson Education India, 2nd Edition, 2009
3. “Modern Electronic Communication”, Miller Gary M, Prentice-Hall, 6th Edition, 1999
4. “Digital Communications”, John Proakis, Tata Mc Graw Hill, 5th Edition, 2007
5. “Electronic Communication Systems, Fundamentals Through Advanced”, Wayne Tomsi, Pearson Education, 4th Edition, 2001
