Unit - 6
Business Process Re-Engineering
A business process is a collection of linked tasks, which find their end in the delivery of a service or product to a client. It is also been defined as a set of activities and tasks that, once completed, will accomplish an organizational goal.
The process must involve clearly defined inputs and a single output. These inputs are made up of all of the factors which contribute (either directly or indirectly) to the added value of a service or product.
These factors can be categorized into
Management processes – governs the operation of a particular organizations system of operation.
Operational processes – which constitute the core business.
Supporting business processes – such as human resource and accounting which are put in place to support the core business.
Business process modelling is the graphical representation of a company’s business processes or workflows, as a means of identifying potential improvements. This is usually done through different graphing methods, such as the flowchart, data-flow diagram, etc.
BP modelling is used to map 2 different states of the process: As-is, the state of the process as it is right now, without making any changes or improvements, and To-be, the future state, after making the changes or improvements.
Business Process Mapping :
Deals with both high-level and low-level mapping. i.e, it can be a very generic representation of a process, without getting into too much detail, or pretty much the exact opposite.
Business Process Modeling –
Deals specifically with low-level process maps, with the main purpose being process improvement.
BP modeling is usually categorized as
Business Process Management:
A methodology of constant process re-evaluation and improvement. Just about the same thing as BPI and BPR, with the main difference being that BPM is continuous. That is, it’s not just a single process improvement initiative, it’s something you do constantly.
Business Process Improvement (BPI) –
Usually part of BPM, BPI means the mapping, analysis, and improvement of a single process.
Business Process Reengineering (BPR) – Essentially the same thing as BPI, with the main difference being how you’d change the process. BPR tends to deal with more major changes to the process, such as incorporating technology to completely change the way a process works.
Business Process Modeling Techniques
The three popular technique are :
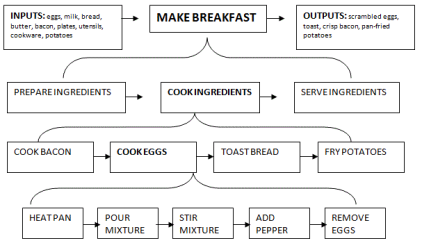
Process Flowcharts

- Process flowcharts are the easiest and most widely used BP modeling techniques.
- The way this works is pretty self-explanatory – you map your processes step by step.
- There are 3 ways to create flowcharts: pen & paper, flowchart software, or workflow management software.
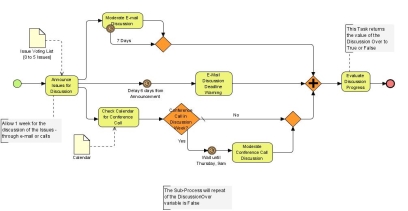
Business Process Model and Notation (BPMN)

- BPMN is an open-industry standard for BP modeling and was developed by the BPMI (Business Process Management Initiative).
- It’s essentially a standardized method for flowchart mapping; meaning, the objects used are defined by the methodology, not the individual doing the mapping.
- BPMN can be carried out exactly the same way as flowcharts, with the only difference being that you’d be using the elements within the graph as defined by BPMN methodology and not your own preference.
Data Flow Diagrams (DFD)
- Data flow diagrams are designed to show the flow of data from one source to another. It describes how these processes relate to each other and to the people who use them.
- It should be noted, though, that DFD isn’t about the technicalities of data storage. Rather, how the data flows through different processes.
Benefits
- Improving Efficiency – The main function of BP modeling is to improve the way the processes are done. As a given, you’ll find different ways to improve the way the process works, which leads to higher efficiency, productivity, output, and finally, profits.
- Enforce Best-Practices & Standardization – If you’re running a big organization, there’s a good chance that different teams do the same process differently. Creating the best-practice design ensures that everyone knows how to do the process.
- Process Agility – If BP analysis is a norm within an organization, they will eventually develop a culture of innovation and change..
- Transparency – Everyone within your organization will be, more or less, aware of how your processes work: what’s the goal, how it operates, etc. This leads to accountability; who owns what process becomes transparent.
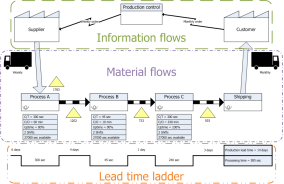
Value stream mapping is a lean management tool that helps visualize the steps needed to take from product creation to delivering it to the end-customer. As with other business process mapping methods, it helps with introspection (understanding your business better), as well as analysis and process improvement.

The inputs for a values stream map include all the resources you leverage to produce goods or services. The route you follow consists of value adding steps, as well as their attendant non-value-adding steps. And your map will also follow information flows.
Steps to Value Stream Mapping
- Decide how far you want to go
- Typically, you would start your mapping by indicating a start and end point. This would show where your internal process begins and ends. Some companies, however, prefer to map out the entire value chain. While it does give you a better idea of the whole process, there’s usually not much you can do about any external processes.
- Your average value stream map begins with the delivery of materials from direct suppliers and ends with delivery to the customer. Place the icon you have chosen to represent your starting and ending points on the left and right of your map.
- If your production processes are complex, you might decide to map each of the value-adding processes in greater detail after completing your overall map. In this case, you would start with the process that allocates the work as “supplier” and the process that receives it as the “client.”
- Define the steps
Now determine what processes are involved in order to get from point A to point B.
As a simple example, a nursery producing ornamental plants begins with seed from a supplier and delivers plants to a customer. Intervening steps that add value along the way might include:
- Sowing
- Transplanting
- Growing
- Grading
- Shipping
Indicate the Information Flows
- One of the advantages of value stream mapping is that it includes information flows.
- The teams or individuals responsible for each process that takes the product from input to output also need information.
- Where does it come from and how is this information passed on?
- It then uses this info and provides a weekly or monthly schedule for each of the processes.
- Add this department in the middle of the sheet between the input and output blocks.
- Draw another block below it to indicate the weekly plan, and draw arrows from the plan to each of the departments it informs.
- Gather Critical Data
Take in-depth look at each process
Typical points to look at would include:
- The inventory items held for each process
- The cycle time (typically per unit)
- The transfer time
- The number of people needed to perform each step
- A number of products that must be scrapped
- The pack or pallet size that will be used
- The overall batch size that each step handles
- Add Data and Time Lines to the Map
- Once you have all the information, you can start adding it to your map. Draw a table or data box under each process block to do so. If you’ve used historical data, be sure to verify it using the current inputs and outputs for each process.
- Indicate the timeline involved in each process beneath your data blocks. This shows the lead time needed to produce products and the actual time spent on producing each unit, pack size, or batch.
- Identify Seven Wastes of Lean
The seven wastes include:
- Transport doesn’t add value to your final product – unless you’re in the transport business! See if you can reduce steps involving transport of materials or information that don’t add value.
- Inventory of inputs and finished products costs you money which could have been earning income elsewhere. The lower your inventory levels can be without stonewalling production, the better it will be.
- Motion costs time and time is money. As an example, our nursery worker has to move her transplanted seedling 10 feet from the potting table to the tractor wagon. That’s wasted time.
- Waiting because there’s a bottleneck in a previous process or sub-process is another clear waste of valuable resources.
- Over-processing can be hard to gauge, but if an item can move from one process to another in an acceptable condition with less input, it should do so.
- Overproduction is an additional pitfall to avoid. Even if your product isn’t perishable, storing it and monitoring it until such time as a customer buys it is clearly a waste.
- Defects mean reworking or scrapping and are clear money-eaters. How can you reduce defects in each step of the process you’ve mapped?
- BPR Computer System :
-It comprises of an ordered collection of hardware and software and data resources
- Computer systems are the basis for automated information systems.
- Shared databases makes information available at many places.
- Expert Systems allow generalists to perform special task
- Telecommunication networks allow organizations to be centralized and decentralized at the same time.
- Decision Support tools allow decision-making to be a part of every bodies job.

It is a model guide that compiles a series of best practices related to the IT business process management. It was developed as a framework, as it is independent of the platforms adopted by the company, as well from the line of business itself and the relevance IT has on the productive chain.
Also, to optimize the investments in IT, it provides valuable data to measure results through Key Performance Indicators or Key Success Factors, for example.
The structure is divided into four parts, called domains. They are:
- Planning and Organization
- Implementing (Execution)
- Deliver and Support
- Monitor and Evaluation
- Building the MIS is a long-term project. It is, therefore, essential to have a relook at the organization where the mission and goals of the organization are likely to be replaced. The business itself would undergo a qualitative change in terms of the business focus, work culture and style and the value system. This would change the platform of business calling for a different MIS.
- The MIS will concentrate more on the performance parameter evaluation which is different in the re-engineered organization. The data capture, processing, analysis and reporting would be process central and performance efficiency would be evaluated in relation to the value generated by the processes.
- The decision support systems will be integrated in the business process itself, where triggers are used to move the process. The triggers could be business rules and stored procedures, enabling the process to become automotive in its execution. The MIS in the re-engineered organization would be more of a performance monitoring tool to start with and then a control for the performance.
- The traditional MIS is function-centered like finance, production, material, etc. The Management Information System in a re-engineered organization would be process centred, evaluating customer satisfaction, expectations and perceptions.
.