Unit - 1
Mode of Transportation
1.1 Modes of Transportation
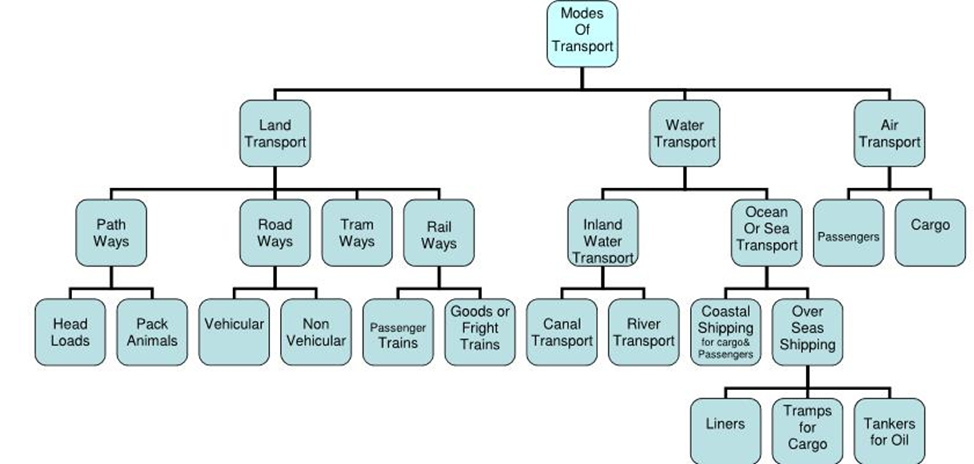
Fig: Modes of transportation
| Advantages |
| Disadvantages |
1. | Less Capital Outlay | 1. | Seasonal Nature |
2. | Door to Door Service | 2. | Accidents and Breakdowns |
3. | Service in Rural Areas | 3. | Unsuitable for Long Distance and Bulky |
4. | Flexible Service | Traffic | |
5. | Suitable for Short Distance | 4. | Slow Speed |
6. | Lesser Risk of Damage in Transit | 5. Lack of Organization | |
7. | Saving in Packing Cost |
|
|
8. | Rapid Speed |
|
|
9. | Less Cost |
|
|
2. Railway transport
| Advantages |
| Disadvantages |
1. | Dependable | 1. | Huge Capital Outlay |
2. | Better Organized | 2. | Lack of Flexibility |
3. | High Speed over Long Distances | 3. | Lack of Door-to-Door Service |
4. | Suitable for Bulky and Heavy Goods | 4. | Monopoly |
5. | Cheaper Transport | 5. | Unsuitable for Short Distance and Small |
6. | Safety | Loads | |
7. Larger Capacity | 6. | Booking Formalities | |
8. | Public Welfare | 7. | No Rural Service |
9. | Administrative Facilities of Government | 8. | Under-utilized Capacity |
10. Employment Opportunities | 9. | Centralized Administration | |
3. Air transport
| Advantages |
| Disadvantages |
1. | High Speed | 1. | Very Costly |
2. | Comfortable and Quick Services | 2. | Small Carrying Capacity |
3. | No Investment in Construction of Track | 3. | Uncertain and Unreliable |
4. | No Physical Barriers | 4. | Breakdowns and Accidents |
5. | Easy Access | 5. | Large Investment |
6. | Emergency Services | 6. | Specialized Skill |
7. | Quick Clearance | 7. | Unsuitable for Cheap and Bulky Goods |
8. | Most Suitable for Carrying Light Goods of | 8. | Legal Restrictions |
High Value |
|
| |
9. | National Defense |
|
|
10. Space Exploration |
|
| |
Key takeaway:
Modes of transport:
6. IRC played an important role in the formation of the three 20-year road development plans in India:
20-years Road Development Plans
Parameters | First 20-year Road Plan | Second 20-year Road Plan | Third 20-year Road Plan |
Name | Nagpur | Bombay | Lucknow |
Duration | 1943-1963 | 1961-1981 | 1981-2001 |
Target Density | 16 km/ 100 km2 | 32 km/ 100 km2 | 82 km/ 100 km2 |
Road Pattern | Star & Grid | ----- | Square Grid |
Planned Expressway Length | ---- | 1600 km | 2000 km |
Development Allowance | 15% | 5% | --- |
Classification of Roads | NH/ SH/ MDR/ ODR/ VR | ----- | Primary: Expressway/ NH Secondary: SH/ MDR Tertiary: ODR/ VR |
Key takeaway:
IRC (Indian Road congress):
1. Principle of highway planning:
(i) Planning a highway network for safe, efficient and fast movement of people and goods.
(ii) Keeping the overall cost of construction and maintenance of the roads in the network to a minimum.
(iii) Planning for future development and anticipated traffic needs for a specific design period.
(iv) Phasing road development programmes from considerations of utility and importance as also of financial resources.
2. Road development plans:
The Second World War saw a rapid growth in road traffic and this led to the deterioration in the condition of roads.
To discuss about improving the condition of roads, the government convened a conference of chief engineers of provinces at Nagpur in 1943. The result of the conference is famous as the Nagpur plan.
A twenty-year development programmed for the period (1943-1963) was finalized. It was the first attempt to prepare a co-ordinate road development programmed in a planned manner.
The roads were divided into five classes:
Bombay Road Plan
The length of roads was under the Nagpur plan was achieved by the end of it, but the road system was deficient in many respects.
Accordingly, a 20-year plan was drafted by the roads wing of government of India, which is popularly known as the Bombay plan.
The highlight of the plan was:
It was the second-year road plan 1961 to 1981.
The total road length targeted to construct was about 10 lakhs.
Rural roads were given specific attention.
They suggested that the length of the rod should be increased so as to give a road density of 32 km per hundred square kilometers.
The construction of 1600 km of expressways was also then included in the plan.
This plan has been prepared keeping in view the growth pattern envisaged in various held by the turn of the century. Some of the salient features of this plan are as given below:
This was the third 20-year road plan (1981-2001). It is also called Luck now road plan.
It aimed at constructing a road length of 12 lakh kilometers by the year 1981 resulting in a road density of 82kms/100 sq.km.
The plan has set the target length of NH to be completed by the end of seventh, eighth and ninth five-year plan periods.
It aims at improving the transportation facilities in villages, towns etc. such that no part of country is farther than 50 km from NH.
One of the goals contained in the plan was that expressways should be constructed on major traffic corridors to provide speedy travel.
Energy conservation, environmental quality of roads and road safety measures were also given due importance in this plan.
3. Highway alignments requirements:
1. Short
The alignment should be short so as to make the road project economical. To meet this requirement, the alignment should be as straight as possible.
2. Easy
The alignment should be such that it is easy to construct and maintain the road with minimum problems.
3. Safe
The alignment should be safe for traffic operation. It should be safe for the construction and maintenance of the road.
4. Economical
The alignment should be economical in its cost of construction, maintenance and traffic operations.
5. Utility
The alignment should be such that it would offer maximum utility by serving maximum population and products.
6. Natural Aspects
The alignment should have good natural aspect.
4. Engineering Surveys for Highway Alignment:
The following steps are involved in finalizing the Highway alignment& preparing the project:
It is the very first step of highway survey.
In this, we use a topographic map of the area under consideration, which can be availed from the Survey of India. Using the map, we can propose different alternatives of the road alignment.
The topographic map usually has contour intervals of around 30 m to 40 m.
We can get the details of the natural as well as man-made land features of the area using this map, and based on this we can then suggest a number of options for the road alignment.
These alternative route options are further studied in detail in the later steps.
This is done to examine the general character of the area for deciding the most feasible routes for detailed studies.
Basic surveying instruments are used in the reconnaissance survey.
Following data is obtained from Reconnaissance Survey:
This is carried out to collect all the physical information which is necessary in connection with the proposed highway alignment. This work consists of:
This may be done using:
5. Engineering surveys for highway location:
Location of the highway alignment is done after carrying out a survey of the area. These surveys are called Engineering Surveys.
We have to locate an alignment which fulfils the basic requirements like the path must be short, safe, economic, easy and useful.
Engineering Surveys in the following phases:
1) Map Study
This is the first step of the Engineering survey, using a topographic map of the area under consideration, which can be availed from the Survey of India.
This topographic map, in general, has a contour interval of around 30 m to 40 m.
2) Reconnaissance Survey
So, in the second phase/step a survey team is headed to the area under study with the minor surveying instruments like Abney level, Tangent Clinometers etc. to do a rough survey of the area under study.
The rough survey is done along the alternatives proposed in the map study and feasibility of the road alignment is checked along the different routes.
Some of the routes may be cancelled out or they may be changed if they appear to be impossible in this study. So finally, they will have a set of routes which are to be further studies in the next step.
3) Preliminary Survey
In this step, the alternative routes which are proposed after a rough survey in the second step are surveyed in details using some advanced instruments like levels, chain and theodolite. Aerial Photogrammetric is best suited for this type of survey.
All the necessary details to carry out the comparative study of the different routes are collected and then finally we have to decide one alignment best suited for the alignment of the road.
Here various details are found out along the stretches of the routes, which can also be found using the aerial techniques by taking photographs along the routes and then further processed to find out the final details of the area.
4) Location Survey
Location of the centerline of the road is done with very much precise instrument like Theodolite and Chain using the drawing prepared or the details gathered in the third step (i.e., Preliminary survey).
This is done by staking the ground with the stakes inserted at the intervals of 50 m to 100 m in the plain area, 50 m to 75 m in the rolling terrain and 30 m to 50 m in the hills and steep terrain.
Pegs may be driven at all the control points. At the curves control points, starting of the transition curve, starting off the circular curve and terminal of the circular curve and the terminal of the transition curve the pegs/stakes are driven into the ground to firmly locate these control points. Benchmarks are located at an interval of 250 m and they are necessarily located at the sites of the cross drainage works.
5) Detailed Survey
In this part, we have carried out the detailed study of the final route using some very precise instruments like Theodolite and Chain to gather all the necessary data for the final estimation, design and preparing drawings using which the construction can be started.
A detailed project report is to be prepared and all the necessary data is collected to prepare that report.
So, the profiling, cross-sectioning and soil investigation are carried out very precisely. CBR values are also found to find out the design thickness of the pavement. After collecting the data, a final drawing, a report is prepared which concludes the highway planning part.
Key takeaway:
6. Energy conservation is the effort made to reduce the consumption of energy by using less of an energy service.
7. This can be achieved either by using energy more efficiently (using less energy for a constant service) or by reducing the amount of service used (for example, by driving less).
1. Geometric design- Design controls
The geometric design of highways is that stage of highway design which deals with the dimensions of the road and layout of visible features of the highway. It is majorly concerned with the design of the road elements and does not include pavement design, structural and drainage components. The geometrics of highway should be designed to provide optimum efficiency in traffic with maximum safety at the reasonable cost. The design of such features is highly influenced by traffic, driver behavior and psychology and vehicle characteristics.
2. Highway cross-sectional elements
The features of the cross-section of the pavement influence the life of the pavement as well as the riding comfort and safety.
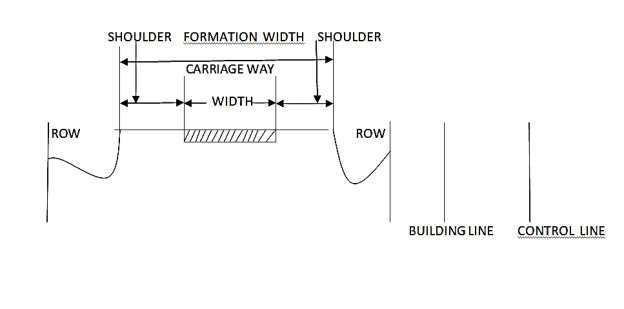
Fig.: Cross-section of Roads
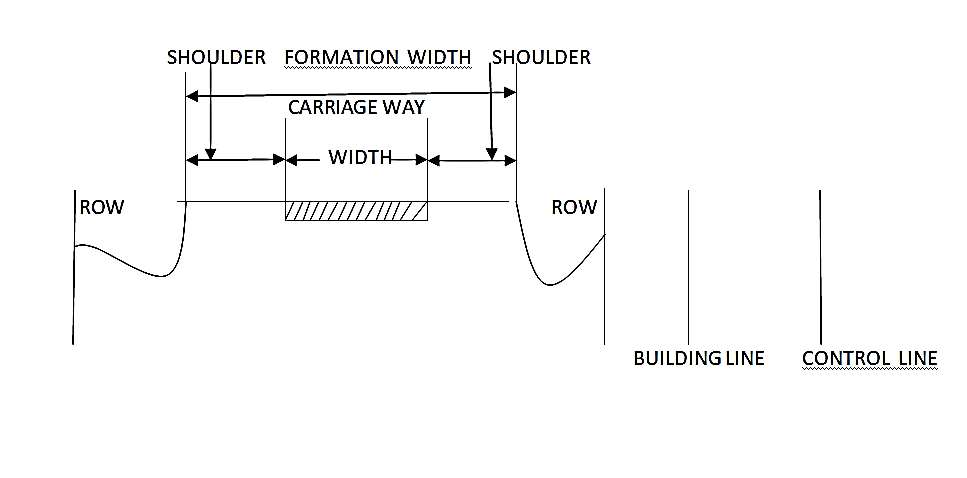
Friction determines the operating speed and distance requirements in stopping & accelerating the vehicles.
Skidding occurs in a vehicle when transverse movement of tyre > circumferential movement of tyre.
Slipping occurs when circumferential movement of tyre > transverse movement of tyre.
Factors affecting friction are:
a) Type & condition of pavement surface
b) Type & condition of tyre & tyre-pressure
c) Speed of vehicles
d) Temperature of tyre& pavement
Coefficient of friction decreases with increase in temperature, load & tyre pressure.
As per IRC,
Longitudinal friction coefficient = 0.35 to 0.40
Lateral friction coefficient = 0.15
When a longitudinal friction coefficient of 0.40 is allowed for stopping a vehicle, the resultant retardation is 3.93m/s2, which is not too uncomfortable for passengers.
b. Pavement unevenness
A Bump Integrator is used to measure vertical undulations of pavement surface recorded per unit horizontal length of the road.
c. Camber/ cross-slope
Note: Superior the road, flatter the camber (RCC > CC > Thick BT > Thin BT > WBM > Gravel > Earth).
Types of Road Surface | Camber | |
Heavy Rainfall | Light Rainfall | |
Cement concrete & high bituminous | 2% | 1.7% |
Thin bituminous | 2.5% | 2% |
WBM & gravel pavement | 3% | 2.5% |
Earth | 4% | 3% |
d. Width of Pavement/ carriageway
Considering that IRC recommends the maximum width of a vehicle to be 2.44m, the minimum width of pavement criteria is given as follows:
e. Traffic separators/ medians
As per IRC, minimum desirable width of 5m for medians of rural highways is recommended.
It may be reduced to 3m where land is restricted.
Width of median can be further reduced to 1.2 – 1.5m for long bridges.
IRC Recommendations for Median Width:
At urban intersection = 1.2m
For vehicles making right turn = 4m to 7.5m
For vehicles crossing at grade = 9m to 12m
f. Kerb height
A Kerb is the edging of a pavement (or a sidewalk) near a road. It indicates the boundary between the pavement and shoulder, or sometimes islands or footpath. The heights of different types of kerbs are:
Low-mountable = 10 cm
Semi-barrier = 15 cm
Barrier = 20 cm
3. Cross-slope or camber
Camber or Cant is the cross slope provided to raise the middle of the road surface in the transverse direction to drain rainwater from the road surface.
The objectives of providing the camber are
Depending on the type of road surface and amount of rainfall, the following camber is suggested by IRC:
Surface Type | Heavy Rain | Light Rain |
Concrete/Bituminous | 2% | 1.7% |
Gravel/WBM | 3% | 2.5% |
Earthen | 4% | 3% |
Excessive camber or cross slope should be avoided because
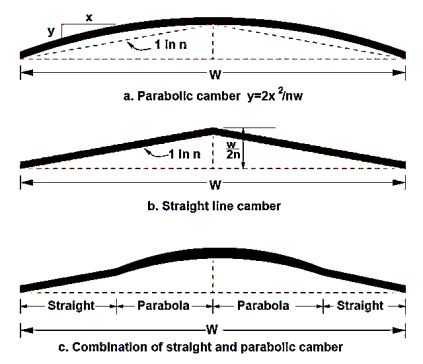
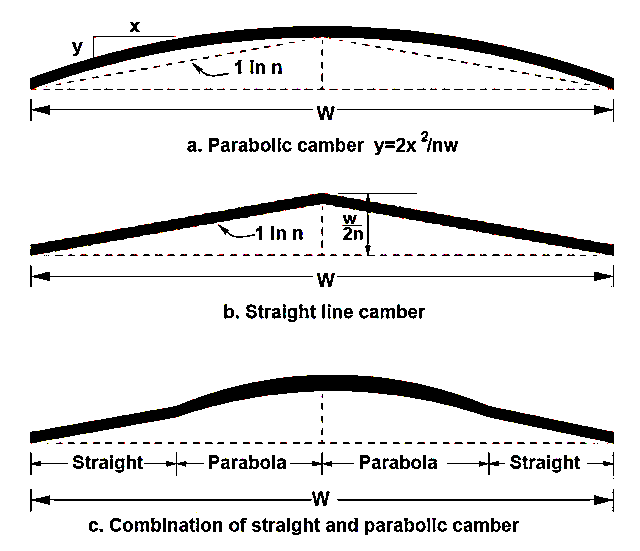
Different types of Camber:
Parabolic Camber
Straight Line Camber
Combination of Straight and Parabolic Camber
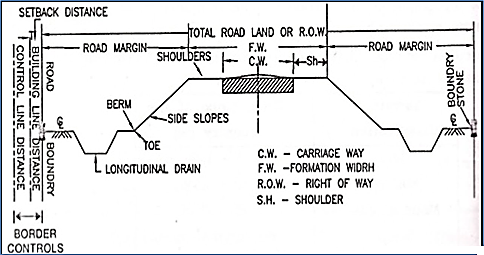
Fig: Types of camber
2. Road width:
In particular, the width of the standard road lane in the United States is specified to be 3.7 m for the interstate highway systems, while the narrower lanes are used on lower classification roads. In Europe, the road and lane width vary by country, but the minimum width of lane is generally from 2.5 to 3.25 m.
3. Road margin:
The portion of the road beyond the carriageway and on the roadway can be generally called road margins. Different elements of road margins are shoulder, parking lanes, bus bays, cycle track, footpath and guard rails.
4. Typical cross section of roads
In the cross section of roads, it is that portion of the roadway between the outer edge of the outer traffic lane and the inside edge of the ditch, gutter, curb or slope.
5. Design speed
Design speed is the target speed at which drivers are intended to travel on a street, and not, as often misused, the maximum operating speed. Actively designing for target vehicle speeds is critical to safety. Changing a street's design results in behavior changes.
6. Sight distance
The safe and efficient operation of vehicles on the road depends very much on the visibility of the road ahead of the driver.
Thus, the geometric design of the road should be done such that any obstruction on the road length could be visible to the driver from some distance ahead.
This distance is said to be the sight distance.
For straight road on level ground, there is no problem of side distance. But Straight Road on level ground is a rare case.
Horizontal curves, vertical curves (Summit), intersections are potential places where there could be a restriction in terms of Sight distance
The actual distance along the road surface over which a driver from a specified height above the carriageway has visibility of the stationary or moving object
The sight distance used for design is
Stopping Sight Distance (SSD) or absolute minimum sight distance
Intermediate Sight Distance (ISD) = 2*SSD
Overtaking Sight Distance (OSD) for safe overtaking
Headlight Sight Distance = SSD at night
Key takeaway:
A horizontal curve acts as a transition between two tangent strips of roadway, allowing a vehicle to negotiate a turn at a gradual rate rather than a sharp cut.
The design of the horizontal curve is dependent on the design speed for the roadway, as well as the drainage conditions and friction factor for the road.
The centrifugal force developed at the curve is counter-acted by the transverse frictional resistance developed between the tyres and the pavement.
Mathematically, centrifugal force P = 
Ratio of centrifugal force P to the weight of the vehicle W is known as centrifugal ratio or impact factor.
 =
= 
The centrifugal force acting on a vehicle while negotiating a horizontal curve has two effects:
1. Overturning Effect (tendency to overturn the vehicle outwards about the outer wheels)
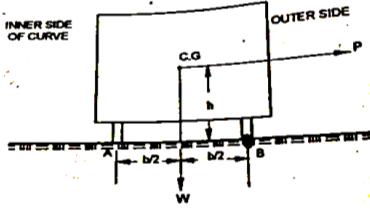
P.h = W x 
For no over-turning condition,
[ =
=  ] ≤
] ≤ 
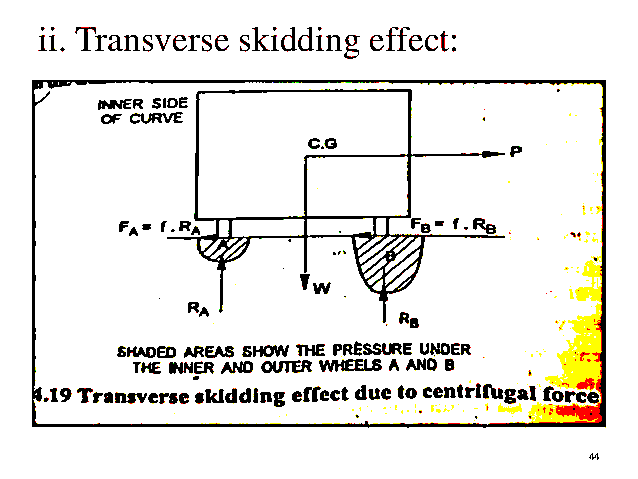
2. Transverse Skidding Effect (tendency to skid the vehicle laterally outwards)
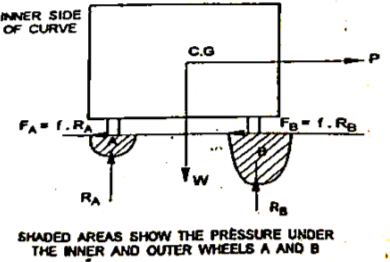
Frictional force = Fw
Centrifugal force = P = 
For no skidding condition, centrifugal force ≤ frictional force
[ =
=  ] ≤ f
] ≤ f
Super Elevation:
Super Elevation is the transverse slope to counteract the centrifugal force and to reduce the tendency of the vehicle to overturn or skid.
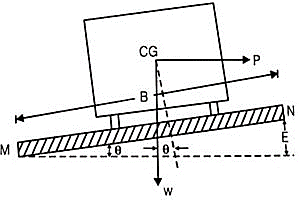
e =  = tan
= tan
Since is extremely small,
tan ≈ sin = 
Where,
B = pavement width
E = relative elevation of outer edge
Calculation of Super Elevation:
The following forces act on vehicle while moving on a circular curve of radius R with speed V m/sec:
a) Centrifugal force P acts horizontally outwards through C.G
b) Weight of the vehicle W acts vertically downwards through C.G
c) Frictional force acts inwards towards the center of the curve
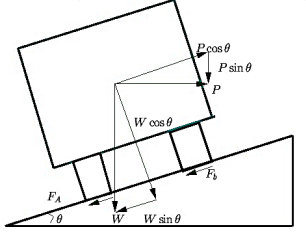
For equilibrium,
P cos = W sin + f (W cos + P sin )
P (cos - f sin ) = W sin + f. Wcos
 =
=  = e + f
Also,
e + f =  =
=  (v is speed of vehicle in m/sec)
We can also say, e + f =  =
=  (V is speed of vehicle in kmph)
R = radius of curve in metre
e = rate of super elevation = tan
f = design value of lateral friction = 0.15
Minimum & Maximum Value of Super Elevation (IRC Recommendations)
Maximum value of super elevation:
a) emax = 7% for plain & rolling terrain
b) emax = 10% for hilly terrain without snow
c) emax = 4% for urban roads with frequent inter-section
Minimum value of super elevation:
emin = camber from drainage consideration
Attainment of Super Elevation
Complete super elevation is attained at the end of transition curve or at the beginning of the circular curve. The attainment of super elevation can be split into two parts:
a) Elimination of the crown of the cambered section
b) Rotation of the pavement to attain full super-elevation
There are two methods of rotation of pavement after eliminating camber:

Depressing inner edge by E/2 and outer edge by E/2.
The advantage of this method is that the earthwork is balanced.
The disadvantage of this method is the drainage problem due to depression of the inner edge.
2. Rotation about inner edge
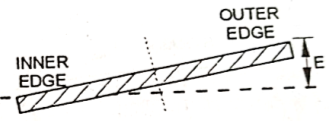
Outer edge of the pavement is raised by E.
The advantage of this method is that it can be used in areas of high rainfall and level terrain to avoid drainage problem.
Ruling Minimum Radius of Horizontal Curve
Minimum radius of horizontal curve is given by the following equation:
Rmin = 
Where,
V = minimum or ruling design speed in km/h
e = Rate of super-elevation
f = Design value of lateral friction
Ruling Minimum Radius
a) For NH & SH = 360m
b) For MDR = 230m
c) For ODR = 155m
d) For VR = 90m
2. Design of Vertical alignment:
Summit curves are vertical curves which are formed when two gradients meet such that there is no discomfort to passengers. But, the main problem in summit curves is to provide adequate sight distance.
Ideally, circular summit curves are best as the sight distance available throughout the summit curve is constant. However, practically simple parabolic curves are used because of best riding qualities, simplicity of calculation work and uniform rate of change of grade. The equation for parabolic summit curves is as follows:
y =a.x2
Where,
a = N/2L
N is the deviation angle and L is the length of the curve.
Minimum radius of parabolic curve summit curve is given by R = L/N
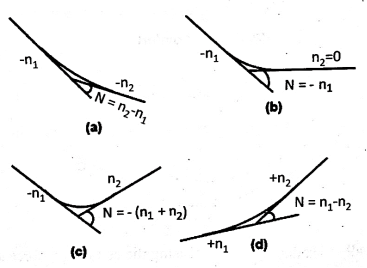
Calculation of Deviation Angle
Length of Summit Curves (L) for Stopping Sight Distance (SSD)
Case 1: L > SSD
L = 
Where, L = Length of Summit Curve (m)
S = SSD (m)
N = deviation angle = algebraic sum of grade
H = height of eye level of driver above road surface = 1.2m
h = height of object above pavement surface = 0.15m
Now, if H = 1.2m and h = 0.15m, then L = 
Case 2: L < SSD
L =  = 2S –
Length of Summit Curves (L) for Overtaking Sight Distance (OSD) and Intermediate Sight Distance (ISD)
Case 1: L >OSD or ISD
L = 
Where,
L = Length of Summit Curve (m)
S = OSD/ ISD (m)
N = deviation angle = algebraic sum of grade
H = height of eye level of driver above road surface = 1.2m
Now, if H = 1.2m, then L = 
Case 2: L <OSD or ISD
L =  = 2S –
Key takeaway:
1) Horizontal curves:
Horizontal alignment design involves the understanding of the design aspects such as design speed and the effect of the horizontal curve on the vehicles.
The horizontal curve design elements include the design of super elevation, extra widening at horizontal curves, design of transition curve, and set back distance.
The presence of a horizontal curve imparts centrifugal force which is reactive force acting outward on a vehicle negotiating it. The centrifugal force depends on the speed and radius of the horizontal curve and is counteracted to a certain extent by transverse friction between the tyre and pavement surface.
On a curved road, this force tends to cause the vehicle to overrun or to slide outward from the center of road curvature.
Forces acting on a Vehicle on Horizontal Curve
b: Distance between two wheels or total width of the wheelbase
h: height of the center of gravity of vehicle above the road surface
W: Weight of Vehicle
P: Centrifugal Force acting outwards


The vehicle overturns the w.r.t. outer wheel due to Centrifugal Force. On the verge of overturning, the contact between the inner tyre and road will be lost.
Overturning:


 = Resistance against Overturning


Lateral Skid: Can be avoided by increasing friction at curves

P=F
P =f*W


f: Coefficient of Lateral Friction = 0.15
2. Vertical curves:
Vertical curves facilitate a gradual change between two different gradients.
Vertical curves should be simple in application and result in a design that is safe and comfortable in operations, pleasing in appearance, and adequate for drainage.
Types of Vertical Curves:
1. Summit Curves
Summit curves or crest curves are convex upwards.
If Deflection angle N is Positive, the vertical curve is Summit Curve.
If the road surface is below the point of vertical intersection, then it is a summit curve
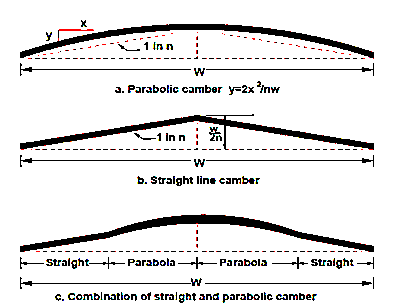
Fig.: Summit curve
Summit Curves are formed when two gradients meet as illustrated below:
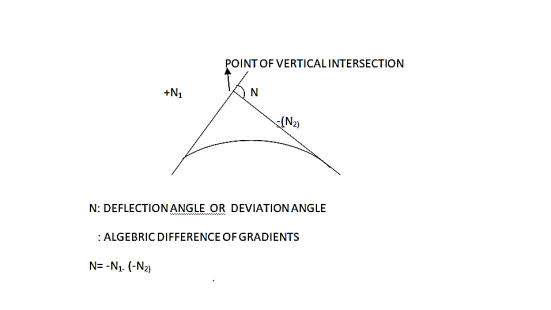
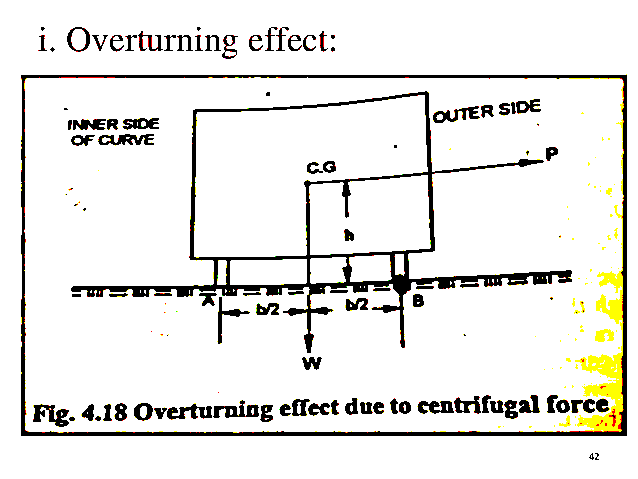
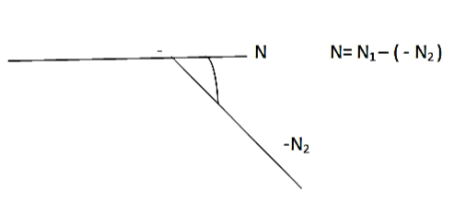
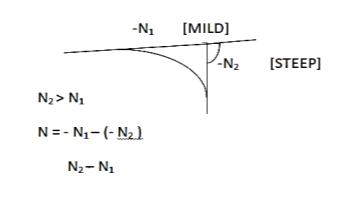
Fig.: Different Grades Curve
1) Shape of Summit Curve:
Circular summit curves are ideal as the sight distance available throughout the length of the summit curve is constant.
For small deviation angles, a simple parabola is congruent with a circular curve.
Arithmetic calculations and ordinary computation are easy for a simple parabola. So, general practice is to provide simple parabola as Summit curve
2) Design Considerations:
The stopping sight distance or absolute minimum sight distance should be provided on these curves and where overtaking is not prohibited, overtaking sight distance or intermediate sight distance should be provided as far as possible.
When a fast-moving vehicle travels along a summit curve, there is less discomfort to the passengers.
This is because the centrifugal force will be acting upwards while the vehicle negotiates a summit curve which is against the gravity and hence a part of the tyre pressure is relieved.
P: Centrifugal Force
W: Gravitational Force
3) Length of Summit Curve (IRC Approach):
The important design aspect of the summit curve is the determination of the length of the curve (L) which is parabolic.
As noted earlier, the length of the curve is guided by the sight distance consideration (S).
That is, a driver should be able to stop his vehicle safely if there is an obstruction on the other side of the road.
While deciding the length of the summit curve, two situations can arise depending on the uphill and downhill gradients
Case 1: L>S
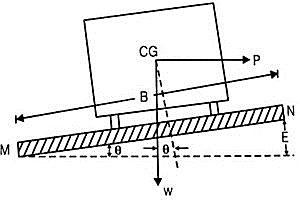
Fig.: When L> S

Where,
Case 2: L<S
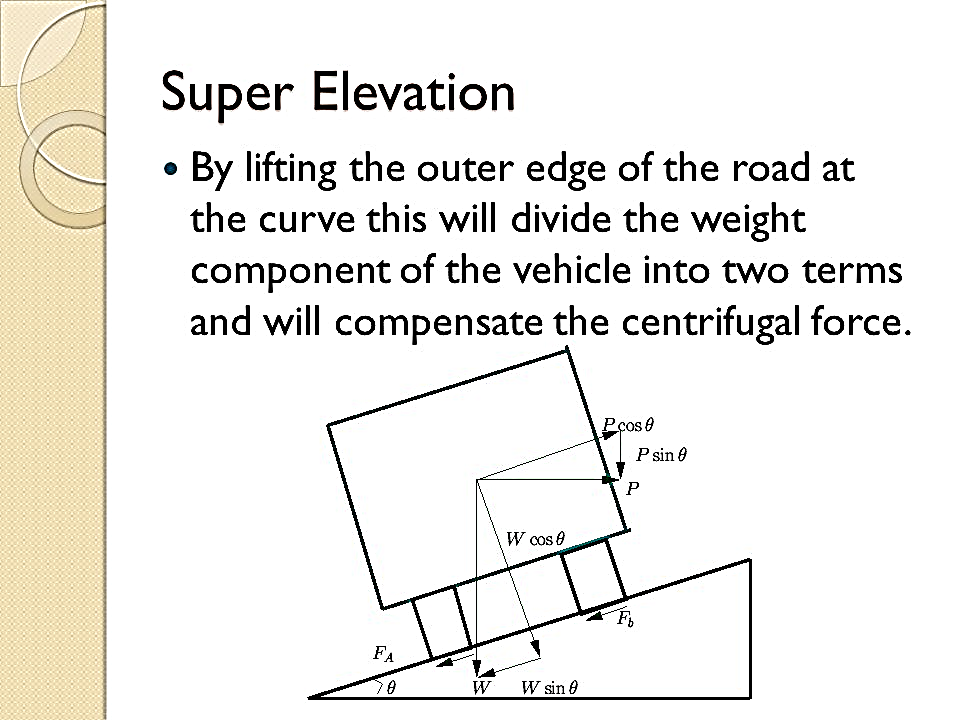
Fig.: When L < S

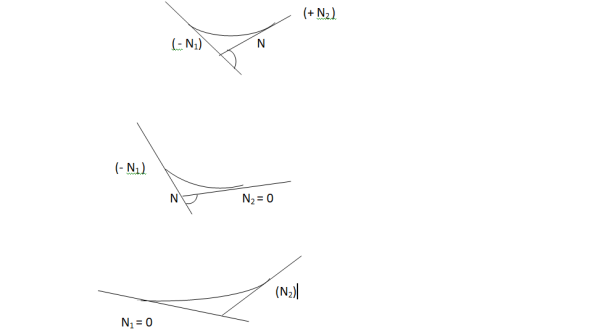
Valley curves or sag curves are convex downwards.
If Deflection Angle N is Negative, the vertical curve is Valley Curve.
If the road surface is above the point of vertical intersection, then it is a Valley curve
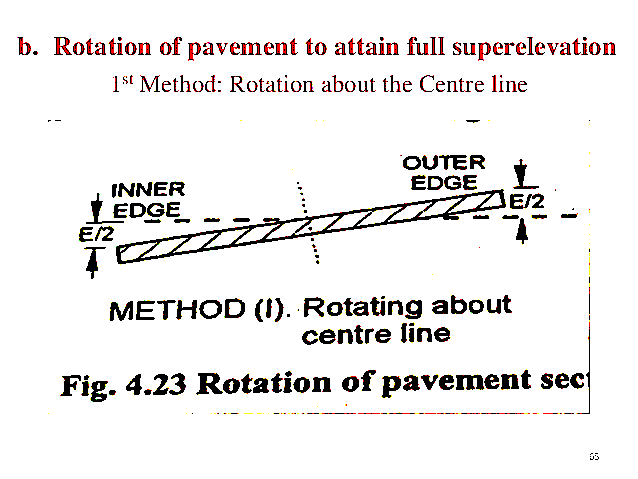
Fig.: Valley Curve
Valley Curves are formed when two gradients meet as illustrated below:
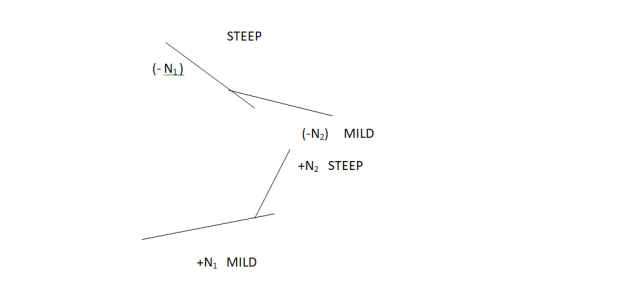
1) Design Considerations:
There is no restriction to sight distance at valley curves during day time. But visibility is reduced during the night.
In the absence or inadequacy of street lights, the only source for visibility is with the help of headlights. Hence valley curves are designed taking into account headlight distance.
In valley curves, the centrifugal force will be acting downwards along with the weight of the vehicle, and hence impact to the vehicle will be more.
This will result in jerking of the vehicle and cause discomfort to the passengers.
For gradually introducing and increasing the centrifugal force acting downwards, the best shape that could be given for a valley curve is a transition curve.
Cubic parabola is generally preferred in vertical valley curves.
3) Length of Valley Curve (IRC Approach):
The valley curve is made fully transitional by providing two similar transition curves of equal length.
The transitional curve is set out by a cubic parabola.
The length of the Valley Transition Curve is based on two criteria
A. Comfort or Centrifugal Acceleration Criteria

Where,
B. Safety or Headlight Sight Distance Criteria
While deciding the length of the valley curve for headlight distance, two situations can arise depending on the uphill and downhill gradients
1) When the length of the curve is greater than stopping sight distance (L>S)
2) When the length of the curve is greater than stopping sight distance. ((L<S)
Case 1: L>S

Where,
Case 2: L<S

Key Takeaways:
References:
2. Khanna S. K., Justo C.E.G, & Veeraragavan A., “Highway Materials and Pavement Testing”, Nemchand and Bros., Roorkee- 247 667.
3. LR Kadiyali, Transportation Engineering, Khanna Publication.
4. L.R. Kadiyali, Transportation Engineering, Khanna Publishing House
5. Saxena, Subhash C, A Textbook of Highway and Traffic Engineering, CBS Publishers &Distributers, New Delhi
6. Kumar, R Srinivasa, “A Text book of Highway Engineering”, Universities Press, Hyderabad.
7. Kumar, R Srinivasa, “Pavement Design”, Universities Press, Hyderabad.
8. Chakraborty Partha & Das Animesh, “Principles of Transportation Engineering”, Prentice Hall (India), New Delhi,
9. IRC: 37- Latest revision, “Tentative Guidelines for the design of Flexible Pavements” Indian Roads Congress, New Delhi
10. IRC:58-2015 Guidelines for the Design of Plain Jointed Rigid Pavements for Highways (Fourth Revision) (with CD)
11. IRC:65-2017 Guidelines for Planning and Design of Roundabouts (First Revision)
12. IRC:73-1980 Geometric Design Standards for Rural (Non-Urban) Highways
13. IRC:106-1990 Guidelines for Capacity of Urban Roads in Plain Areas
14. IRC: 93-1985 Guidelines on Design and Installation of Road Traffic Signals.
15. IRC:92-2017 Guidelines for Design of Interchanges in Urban Areas (First Revision)
16. IRC: SP: 68-2005, “Guidelines for Construction of Roller Compacted Concrete Pavements”, Indian Roads Congress, New Delhi.
17. IRC: 15-2002, “Standard Specifications and Code of Practice for construction of Concrete Roads” Indian Roads Congress, New Delhi.
18. MORTH, “Specifications for Road and Bridge Works”, Ministry of Shipping, Road Transport & Highways, Published by Indian Roads Congress, New Delhi.