Back to Study material
S


Unit - 3


Contouring


  • The line of intersection of a level surface with the surface of the ground is called as contour or a line joining the points on the ground having same reduced level.
  • The elevations and depressions or undulations of the surface of the ground are shown on map by means of contour lines.
  • It is noted that, from the map, only horizontal distances between the points are known but if the contour lines are drawn on the same map, then along with horizontal distances, the vertical distances are also known.
  • Thus, the nature of the ground whether hilly, flat, sloping or undulating can be found out by studying the contour lines.
  • For example, reduced levels (R. L’S) of contour lines in Fig.goes on increasing from outside to inside indicating that it is hill.
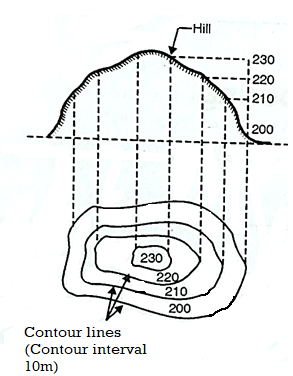
  • Fig.3.1: Plan (Contour lines indicate hill)

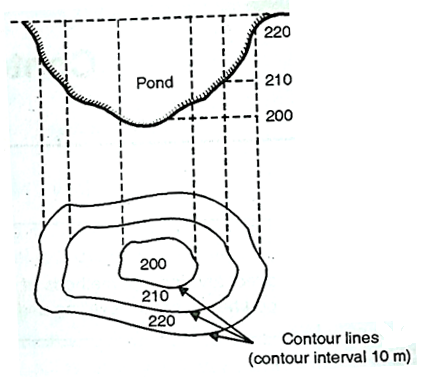
    Fig.3.2: Plan (Contour lines indicate pond)

  • In Fig., R.L’s of contour lines goes on decreasing from outside to inside indicating that it is trough or depression. Fig. shows the contour lines of pond.

  • Contour interval:

  • It is the vertical distance between two successive contours.
  • It remains constant for a given map.
  • The difference in R.L's of two contour gives contour interval.
  • Choice of contour interval:

  • The choice of contour interval depends upon the following considerations:
  • Nature of ground: For a flat ground a small interval is necessary. If the ground is undulating or sloping the contour interval will be larger.
  • Scale of the map: If the scale of the map is small, the contour interval should be large.
  • Purpe and extent of the survey: If the survey is done for detailed design work or for accurate earth work calculations, small contour interval is used.
  • If the time available is less, greater contour interval should e used.
  • Horizontal equivalents:

  • The horizontal distance between two points on two consecutive contours is known as the horizontal equivalents.
  • Horizontal equivalent depends upon steepness of ground.
  • Key Takeaways:

  • Contour interval: It is the vertical distance between two successive contours.
  • Horizontal equivalents: The horizontal distance between two points on two consecutive contours is known as the horizontal equivalents.

  • The contour lines have the following characteristics
  • All points on a contour line have the same elevation or R.L's. Fig. shows the contour lines of equal elevation.
  • Fig.3.3: Contour lines of same elevation

  • Two contour lines of different elevations cannot cross each other. However, in case of overhanging cliff two contour lines of different elevations can intersect. For such case, refer the Fig.
  • H:\unit 3 survey\IMG_20210526_200041.jpg

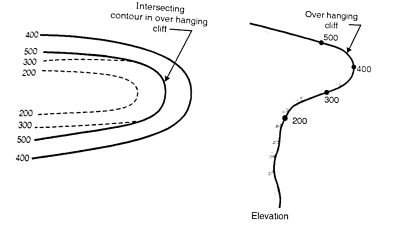
    Fig.3.4: Intersecting contours in overhanging cliff

  • Steep’s slope:
  • (i) When contour lines come close together then it indicates steep slope. Fig. shows steep slope along X-X.

    (ii) Uniform slope: if contour lines are equally spaced, uniform slope is indicated.

    (iii) A series of straight, parallel and equally spaced contours represent a plane surface.

    H:\unit 3 survey\IMG_20210526_200110.jpg

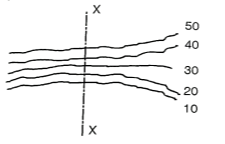
    Fig.3.5: Steep slope along X-X

    H:\unit 3 survey\IMG_20210526_200131.jpg

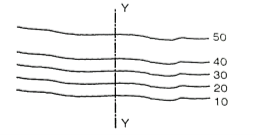
    Fig.3.6: A gentle slope along Y-Y

    H:\unit 3 survey\IMG_20210526_200651.jpg

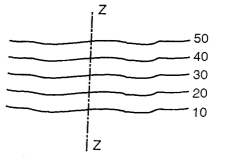
    Fig.3.7: Uniform slope along Z-Z

    H:\unit 3 survey\IMG_20210526_200208.jpg

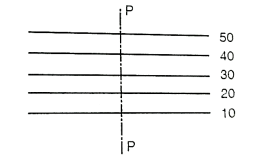
    Fig.3.8: Plane surface slope along P-P

  • Hill: Closed contour lines with higher values inside indicate hill. See Fig.
  • Depression: Closed contour lines with lower values inside indicate a depression.

    H:\unit 3 survey\IMG_20210526_200247.jpg

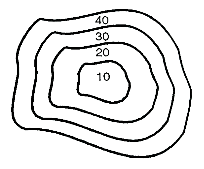
    Fig.3.9: shows depression

    H:\unit 3 survey\IMG_20210526_200620.jpg

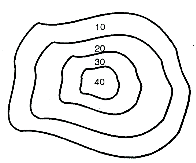
    Fig.3.10: Shows a hill

  • Ridge line:
  • Fig. indicates a ridge line. Contour lines cross ridge at right angles. For ridge line the higher elevation contour is inside the loop or band.

    Valley line

    Fig. indicates a valley line. Contour lines also cross the valley lines at right angles. Valley line is indicated by higher elevation contours outside the loop.

    H:\unit 3 survey\IMG_20210526_200305.jpg

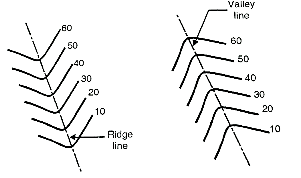
    Fig.3.11: Ridge and valley line


    Direct method:

  • In the direct method, the contour to be plotted is actually traced on the ground.
  • These points are plotted on ground and contours are marked through them. This method is followed where great accuracy is required.
  • Procedure:

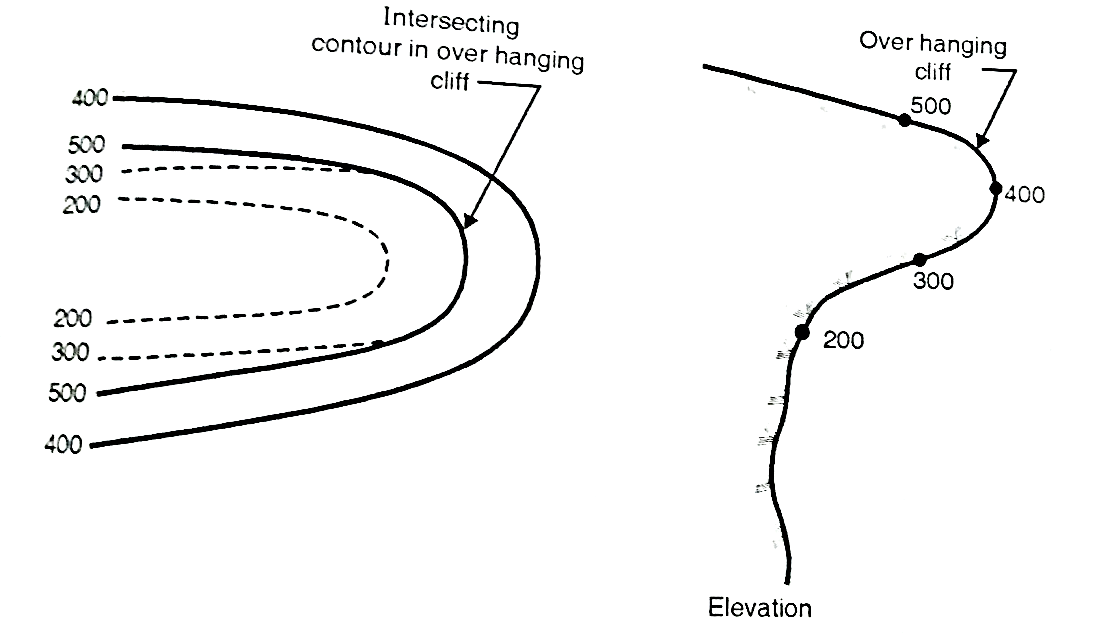
    Fig.3.12: Direct method

  • Consider an area as shown in Fig. which is to be surveyed for contouring.
  • (a)The work is started from B.M. and level is setup at the centre of the area.

    (b) Suppose it is required to find out the contour of 90.000 m then the staff should be moved to various positions on plot where the reading on staff should give R.L. of 90.000 m. on ground. When all the points are located, they are marked on ground directly.

    (c) Similar process is followed for locating the contour of 95.000 m and other contours.

    Indirect method:

  • In this method spot levels are taken at regular interval along predetermined lines on the ground. The work is then plotted on plan and then the required contour lines are drawn by the process of interpolation.
  • The indirect method is less tedious and speedy as compared to direct method.
  • The methods followed in indirect method of contouring are:
  • (a) By cross-section:

  • This method is suitable for roads, railways and canal survey. Consider X, Y, Z as the centre line of the road or railway or canal route as shown in Fig. cross sections are set at every 10 m on the centre line whereas the other dimension to complete a rectangle may be 5 m.
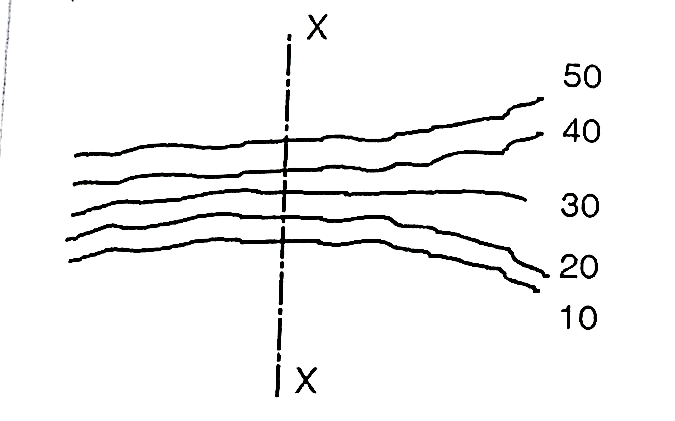
  • Fig.3.13: Method of cross-sections

  • The spacing of the cross-section depends upon the nature of terrain. The cross-sections are more closely spaced where the contours curve abruptly. Staff readings of all the nodal points are determined and the R.L's are calculated. The same cross-section is plotted on the sheet to a suitable scale. The respective R.L's are written on the nodal point as shown in Fig. and then the required contours are interpolated between the R.L's.
  • (b) By squares:

  • In this method the area to be surveyed is divided into a number of squares of size 5 to 20 m depending upon the nature of the ground and contour interval required. The elevations of the corners of the squares (called nodal points here) are determine by means of process of levelling. The calculated reduced level of these nodal points are then written on the respective nodal and contours are interpolated between them.
  • This method is used when the area to be surveyed is small and the ground is not mush undulating because on undulating ground it would be practically impossible to form squares.
  • Fig.3.14: Method of square

    (c) By tacheometric method:

  • In the case of hilly areas, tacheometric contouring method is used. Here instrument known as tacheometer which is a theodolite, is utilized which determines horizontal distances and elevation of points.
  • As shown in Fig. the tacheometer is set at a point approximately at the centre of the area. Radial lines are set making angles with either the magnetic meridian or with the first radial line. On each radial line staff readings are observed at different points. When the readings along all the radial lines have been observed, it is then plotted on a sheet to a suitable scale. The required contour lines are then interpolated as usual.
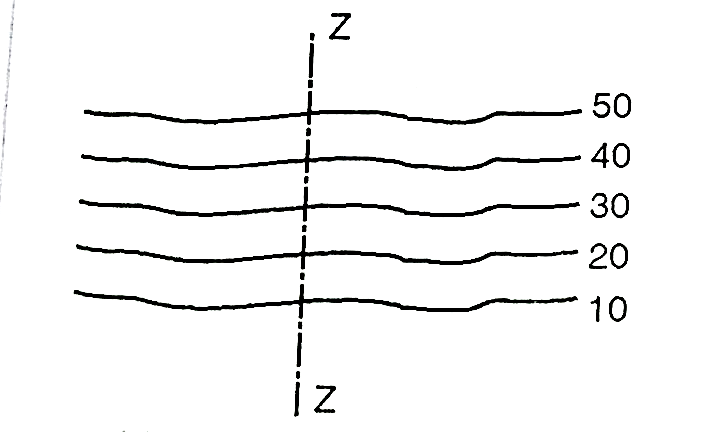
  • Fig.3.15: Tacheometric method

    Key Takeaways:

    Direct method: In the direct method, the contour to be plotted is actually traced on the ground.

    Indirect method: In this method spot levels are taken at regular interval along predetermined lines on the ground. The work is then plotted on plan and then the required contour lines are drawn by the process of interpolation.


  • In preliminary survey for a road in hilly or mountainous country, the points are fixed along the gradient.
  • The line joining such points is called a contour gradient or grade contour.
  • Example: Suppose a falling gradient of 1 in 30 is to be traced on the ground
  • Let the RL of the straight point 100.00 m and

    Let the distance of the next point 60 m.

    B.S on known point is 0.50

    HI =100+ 0.50 =100.05 m

    Then R1 of the next point =100-(60/30)

                                                  =100-2

                                                  =98 m

    Hence the staff reading =100.50-98

                                                =2.5 m

  • The staff is then held at 60 m from the starting point and is moved radially up or down the slope until reading and 2.5 m is obtained. The point is then marked by fixing a peg.
  • The line joining the starting point to this point now is one grade of 1 in 30. The process is repeated until the last point is marked.
  • References:

  • Surveying Vol.1 by B.C. Punmia, Laxmi Publication
  • Surveying and leveling by R. Subramanian, Oxford University Press
  • Surveying Vol-1 by R. Agor, Khanna Publishers

  • Index
    Notes
    Highlighted
    Underlined
    :
    Browse by Topics
    :
    Notes
    Highlighted
    Underlined