Unit - 1
Hydrologic cycle
The cyclic movement of water from surface of the earth to the air and from the air to the surface of earth is called as Hydraulic cycle or water cycle.
Hydrology can be useful in design of water supply, agriculture water requirements, navigation, flood control and hydraulic structures in following ways:
Steps of the Hydraulic Cycle
Due to the solar radiation, called as Isolation i.e., in coming solar radiation. The oceanic and the water on the land surface get heated and gets converted into vapor.
2. Second step:
The vapour being lighter is lifted up in the atmosphere so the air having this vapour called as moisture starts cooling down and so it starts controlling.
It reduces the carrying capacity of air to hold the moisture and it becomes moisture saturated i.e., no more moisture it can hold. This level is called as level of condensation.
3. Third step:
Due to the pushing of air from the earth surface, this saturated air is still pushed in the upward direction, to make it still cooler and still more compact, to reduce its capacity lesser than the actual available moisture This extra moisture is converted into small rain drops, which attract the dust particles to make it visible. It is called as clouds.
4. Fourth step:
These moisture carrying clouds are carried by the winds towards the land surface.
If it is a hilly region the clouds are still lifted up to increase the size of the raindrops and they start falling down called as rainfall.
5. Fifth step:
The rainwater received on the surface starts flowing towards the slopes, to form the running water or streams, which finally meet the oceans.
The rainwater received on the surface same times percolates (it depends upon the type of rock, if it is porous the water percolates) to form the ground water.
It also comes back on the surface in the form of springs to form a surface stream to reach the ocean.
The rain water received on the surface, which is plain and have non-porous rock; forms lakes or tanks.
The cycle is completed once the ocean or surface water comes back can the earth surface to start the first stage of Hydrology ic. it starts getting converted from the liquid state to the gaseous state. When the water is received in the form of solid state i.e., snow, it also undergoes the same cycle.
When the process is fast the water-vapour directly gets converted into solid snow particles. It is called as sublimation. This happened when the temperature of the moisture saturated air is less than 0°C i.e., less than the freezing point temperature. In the temperature and in the arctic zones on the earth it causes snowfall.
Processes involve in hydrological cycle:
As stated above the hydraulic cycle is completed in six stages. This can express by using technical terminology. These processes are as follows.
Key takeaways:
The water stability of every continent (besides Antarctica) is given one at a time for the regions of outside runoff and inner runoff (endorheic regions) in which precipitation is completely lost to evaporation.
All stability components are estimated by independent strategies which offer a computation of a stability discrepancy and for this reason evaluation of reliability of the received results.
Areas of outside runoff occupy approximately 80% of the Earth’s land area.
These regions receive 93% of precipitation onto the land; 88% of evaporation occurs there and 100% of the freshwater influx to the World Ocean. The complete land area (with islands) gets approximately 119 000 km3 of precipitation at some stage in a year, or 800 mm.
The most precipitation layer is located in South America (1600 Mm), the minimum precipitation layer (177 mm) occurs in Antarctica. On the other continents suggest precipitation varies inside 740 to 790 mm.
The overall freshwater influx to the World Ocean from the continents (without Antarctica) equals 39 500 km3/year.
The oceans also receive approximately 2400 km3/year as subsurface runoff not drained by rivers, and 2300 km3 of freshwater mainly as icebergs and melt runoff from the glaciers of Antarctica.
Thus, the overall freshwater influx to the World Ocean from land is set forty-four two hundred km3/year that is equal to approximately 370 mm over the regions of outside runoff or three hundred mm, if associated with the entire land area evapo transpiration over continents varies from 420 mm to 850 mm (without Antarctica, wherein it's miles approximately zero).
Evapotranspiration from the regions of outside runoff is set 1.5 to two instances extra than that from endorheic regions.
Evapotranspiration values given within side the stability consist of runoff in endorheic regions wherein it is completely lost for evaporation. It also includes the amount of water used for human activities.
Key takeaways:
On the basis of the spread intensity and total receipt the precipitation can be classified as:
Drizzle: In this type the size of the water drops is small i.e., it is less than 0.5 mm in diameter and its intensity is also lesser than 1 mm per hour.
Rain: It has the bigger size of the water drops i.e., more than 0.5 mm in diameter.
Cloud burst: It has a very high intensity i.e., with a period of one hour a huge amount of rain water is received in a small region to great danger of floods e.g., cloudburst at Morbid in Gujarat.
Hail: It is a solid form of ice with the diameter varying between 0.5 mm and 5.00 cm. The hail storms are generally observed during the pre-monsoon conditions in the months of April and May, it is a very destructive to affect the plants, crops and also the domestic animals.
Snow: It is solid form of precipitation received in the form of ice crystals. It is observed mainly in the high-altitude regions like Himalayas and in the high latitudinal regions in the artic zones and in the temperate zone during winters when the average temperature is less than 0° C e.g., Shimala, Nainital, Srinagar, Almora etc. receive the precipitation in the form of snow during the cold winter season.
Sleet: When the ground and the atmospheric temperature near the ground is near + 0°C the precipitation is in both solid and liquid forms.
Dew: During the long winter nights in the tropical regions when due to outgoing long wave radiation the surface become cool and level of condensation is reached i.e., the air near the surface becomes vapour-saturated to form the small water drops on the grass and plants.
It is all as Dew (and the temperature at which the dew is formed is called as Dew point temperature.)
Frost: When the small water drops come in contact with the cold objects they get converted into Crystals, to be called as Frost or Glaze. They affect the plant growth in the high latitude region the demarking line of farming is based on this
Frost: It needs to have at least go frost free days to go for agricultural activities.
Fog: During the long winter nights the release of heat is more so near the bank of a river or pond and in the valley region in the early morning period the air becomes condensed i.e., the point of saturation is reached to release some amount of vapor in the form of small water drops which attract the dust particles to become visible. It is called as fog near the coastal areas also the fog is observed. The thick fog affects the traffic to create road accidents.
Smog: When the fog and smoke mainly through the transport and industrial activities gets mixed with the fog it is called as smog. It is very dangerous for the small animals and plants. It reduces the visibility to create accidents. Most of the large industrial based urban centers have become the prey of smog.
2. Measurement of precipitation
The unit of measurement is cm or mm. It is measure for per sq. cm of the land for a period of 24 hours. The instrument used to measure rainfall is called as Rain gauge i.e., gauging the rainwater.
The accuracy of the rainfall data is very important on the basis of this data (called as point data) the monthly or yearly arranges rainfall of that point is calculated for the purpose of the agricultural planning and other various types of economic planning.
The intensity of rainfall is measure as mm per hour or can per day. To get correct data it is necessary to place the rain gauge at the correct place. Following points are considered while selecting the correct site for the rain gauge.
Key takeaways:
Frequency Analysis:
The frequency Analysis is the Ranking of the rainfall data.
After the rainfall data is ranked a series rank numbers i.e., ranking from 1 to 'n' i.e., the total number of observations is assigned.
When the rainfall data are ranked from lower values to highest values. The probability is referred as the probability of non-exceedance.
The frequency of rainfall is expressed in terms of return period (T) which is the average length of time between rainfall events that equal or exceed. The given or designed magnitude.
Arithmetic average or mean method
Step 1: Average or mean rainfall

Where, P = amount of rainfall recorded at the n rain gauges stations installed in the catchment area.
n = number of stations installed.
Step 2: Standard deviation

Step 3: Coefficient of variation

Step 4: Optimum number of rain gauge = coefficient of variation % error 2
Step 5:
Additional number = Optimum nos. - Existing nos.
Key takeaways:
We need to collect the data regarding the amount of storm water i.e., rainfall received in an area, in given period of time. It is useful for any type of water-planning or for the water budget for a particular area.
This information can be represented either in the form of statistical values i.e., numerical figures or in the form of a curve which is called as Depth Area-Duration curve.
The steps for preparing D.A.D. curve:
Step 1: From the rainfall records of the area understudy, i.e., a river basin. A list of the most severe storms, with their dates is prepared.
Step 2: By using this list ISO-hyetal map is prepared giving values to the ISO-hyets.
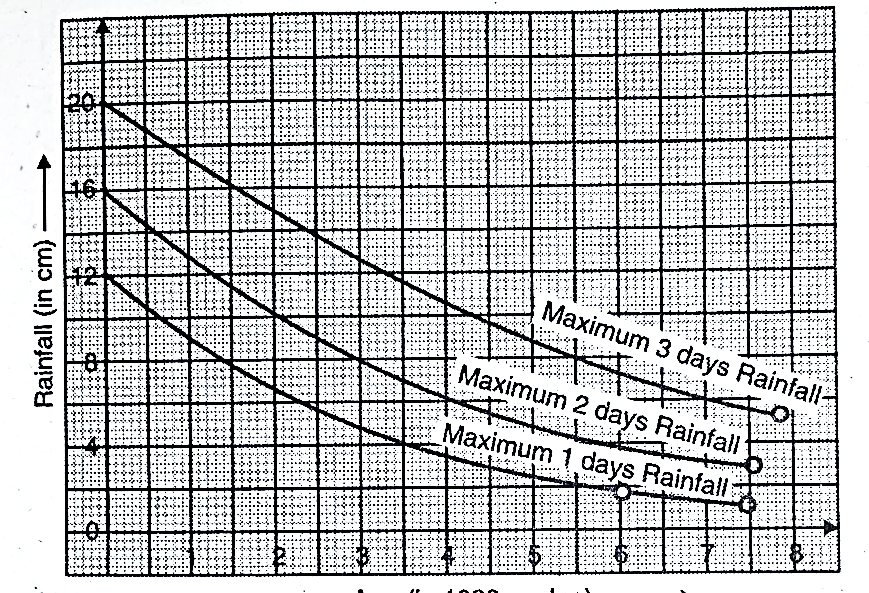
Step 3: From these ISO-hyets, the curves, for different duration. i.e., 1 day rainfall, 2 days rainfall 3 days rainfall, for different areas. [Refer Fig. 1.7.2]
Applications of D.A.D
A: These curves are useful to calculate the heavy rainfall day and the exiled flood situation.
To give warning to the people about the expected food. This can be useful to save, humans and domestic animals lives.
B: It is good for the drought prove area to note the expected storms.
2. Intensity duration curve and depth area curve duration curve
To calculate the intensity of rainfall the following equation is used:

Where,
I = intensity of rainfall (in mm/per hour)
t = Duration of rain-fall (in minutes)
C, a, b = Constants for the specific area.
The data generated is plotted on a graph paper to show the relation of intensity and duration on 'X' and 'Y' axis.
The vertical scale indicates the maximum intensity of precipitation in mm/h and the horizontal scale indicates the time in hours.
These points then are joined by a smooth line to form a curve. It is called as Intensity Duration Curve or Intensity-Duration graph.
Depth-Area Duration curve (DAD)know the maximum amount of rainfall, within various durations, over the areas of different sizes. For that following step are taken A. The rainfall records are examined of DAD of a storm is carried to the given region.
B. The record of meteorologically similar region is examined.
C: From the above records a list is prepared of the most severe storms, with their dates, occurrence and duration.
D: Using such list, an ISO-hyetal map is prepared.
E: By using the values of ISO-hyetal graphs are prepared, for different durations. ic. one day rainfall, two days rainfall and three days rainfall.
Use of DAD
Although the most severe storm listed, may not reappear, but under the given rainfall-depths in the catchment area one can keep the people aware of the expected danger of floods and can reduce the losses; both human losses and economic losses.
3. Intensity Duration Analysis
If the data for a given area is Equation No. 1
The Maximum Annual Rainfall = 1.5x Average annual rainfall Equation No. 2
The Minimum Annual Rainfall = 0.60 x Average Annual Rainfall.
Sometimes same specific point data is not available. e.g., in a region out of 50 rain gauge stations, some stations data for a long period is not available.
In such cases, it is assumed that the rainfall data of 'n' rain gauge stations, for a period of one year is equivalent to the data of one rain gauge station for 'n' years and thus the study can be continued. This method is called as "The Station Year Method".
Key takeaways:
For a given area the depth of the precipitation i.e., the actual amount of rainfall received in a given specific period, is called as Probable or Possible Maximum Precipitation. (P.M.P.)
This is very useful to calculate and estimate the maximum possible flood in the area which is under consideration.
Equation to Calculate PMP
PMP = P₁+ K Xx
Where,
P₁ = It is the average precipitation over the given area.
SX = Standard deviation of the rainfall series.
K = A constant for the area and its neighborhood of 15.
To calculate the PMP at the world level (Considering the areas getting maximum rainfall) the following curve was obtained.
PMP = 42.16X D⁰.475
PMP = Total precipitation in cm
D = Duration in hours.
Relation between the Extremes and Average
Precipitation: The maximum and the minimum annual precipitation can be calculated by using the following equations.
If Earth’s floor has been flawlessly uniform, the long-time period common rainfall might be dispensed in awesome latitudinal bands, however the scenario is complex through the sample of the worldwide winds, the distribution of land and sea, and the presence of mountains.
Because rainfall outcomes from the ascent and cooling of wet air, the regions of heavy rain suggest areas of growing air, while the deserts arise in areas wherein the air is warmed and dried at some point of descent.
In the subtropics, the change winds deliver considerable rain to the east coasts of the continents however the west coasts have a tendency to be dry. On the opposite hand, in excessive latitudes the west coasts are commonly wetter than the east coasts. Rain has a tendency to be ample at the windward slopes of mountain stages however sparse at the lee sides.
In the equatorial belt, the alternate winds from each hemispheres converge and provide upward push to a trendy upward movement of air, which will become intensified regionally in tropical storms that produce very heavy rains within side the Caribbean, the Indian and southwest Pacific oceans, and the China Sea and in thunderstorms which might be in particular common and lively over the land areas. During the once-a-year cycle, the doldrums pass closer to the summer time season hemisphere, so out of doors an imperative location close to the Equator, which has ample rain in any respect seasons, there may be a sector that gets lots rain in summer time season however a bargain much less in winter.
Key takeaways:
The concept of Intersection is confined with a point at which two Lines or two different functions act at the same time but in different directions.
Intersection of rainfall is a process, in which we receive the rainwater in different forms i.e., water liquid form or snow in solid form. When the rainwater is received on the surface of the earth, at that point of intersection, some of it gets evaporated, depending upon the temperature condition and dryness of the air.
Some of it is percolated i.e., infiltration, which depends upon the type of surface rock. So, the usefulness of rainwater depends upon these two Intersecting parameters.
Key takeaways:
To estimate the rate of evaporation from the surface of the water body, following methods have been introduced.
A: Water Budget Method calculate the rate of evaporation following equation is used:

E= Evaporation
P= Precipitation;
I= Surface inflow
U1= Under-ground inflow of water into the surface water (Through springs) Under-ground out flow of water from the surface water (through percolation)
u2= Out flow of water (through irrigation canal) ds Change in the storage
If all the numerical data (accurate) is available the loss of water through evaporation can be calculated.
B: Energy Budget Method
In this method, for a specific period of time, how much energy is received from the sun by the water is calculated and how much energy is utilized for the evaporation is calculated to know the accurate evaporation. For this, the following equation is used.
Q₁ Q₂ +Q+Q
Total energy received from the solar radiation
Where,
Q Total energy reflected by to the atmosphere through the reflection
Qs Change in the energy in the stored water
Q Energy required for evaporation
In this Q, may be ± or because in same case the energy may be added or may be reduced (through the utilization of energy). In this equation if all the figures are available Q i.e., energy required for evaporation can be calculated. The actual evaporation can be calculated if the following information is available.
1. Latent heat of evaporation
2. Temperature of water
3. Atmospheric pressure.
Key takeaways:
If an adequate quantity of water is available for evaporation and transpiration the combined process is known as Potential Evapo transpiration (PET). The actual Evapo transpiration (AET) is always lesser than PET (PET > AET)
The Measurement of Evapotranspiration
Two methods are used to measure the AET which are as follows:
A: Lysimeter
B: Inflow-outflow measurements
A: Lysimeter
It has a tank which is circular shape. The diameter of the tank varies between 600 mm and 3000 mm. The machine is buried into the group up to its top and it is filled with the soil. A plant is planted in it. 1.5 to 2 m Area = A=1 m
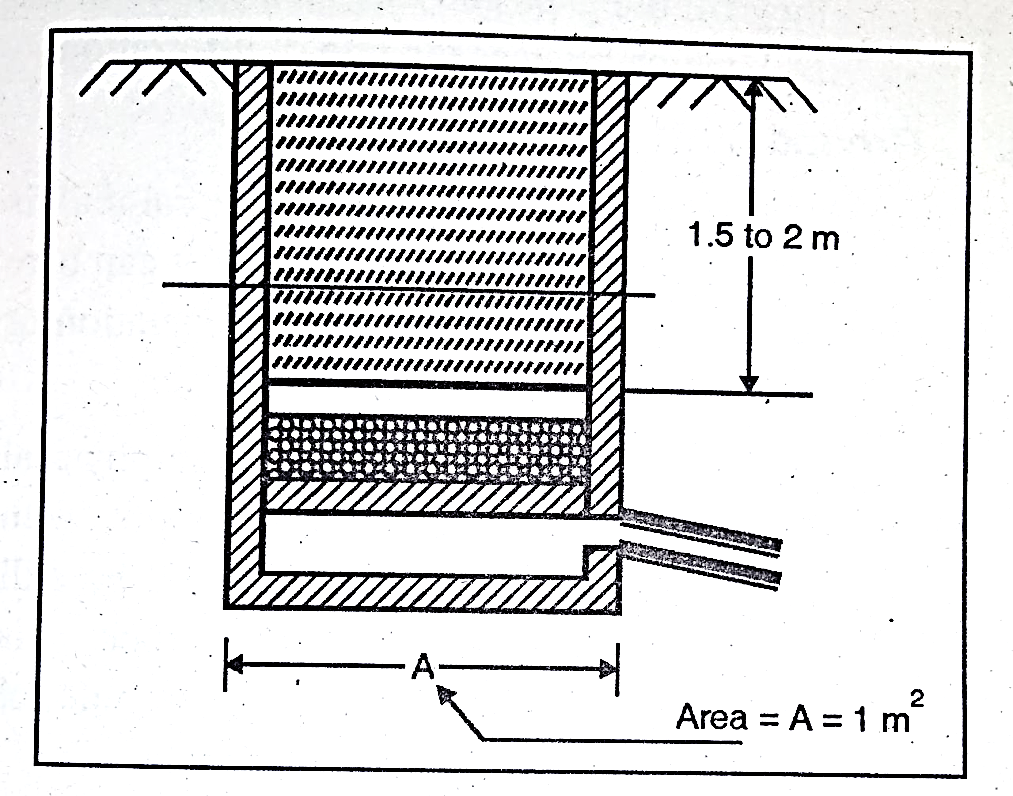
The tank is filled with water to its capacity. The following equation is used to calculate AET of the plant.
P+WO+AET + AS
Where,
P = Precipitation during the period of observation
W = Water supplied;
O Water Drained
AET = Actual Evapo-transpiration
AS = Change in the soil-moisture in the lysimeter.
Problems
These lysimeter are costly.
The total process needs a very long period of time.
B: Inflow-Outflow Measurements
This method is useful for a very large area i.e., an extensive field area up to 100 ha.
An accurate account of the inflow of water i.e., the water supplied to the field, is kept up to date.
The inflow can be rainwater, canal water or the unused, extra water is also measured. The difference between these two would be the Evapo-transpiration.
Problem
The theory of this method is very accurate but in reality, it is very difficult to measure the inflows and the outflows.
Key takeaways:
The rate of infiltration is very important aspect needed to be studied, because the ground water level in a given region is the result of this rate of infiltration.
The ground water is a major source of water for domestic purpose and also for small-sized irrigation for the crops. In South India, the well irrigation is more popular than the canal irrigation.
The instrument used to measure the rate of infiltration is known as Infiltrometer.
Based on the functions these infiltrometers can be classified as:
(A) Flooding-type Infiltrometers
(B) Sprinkling type infiltrometer
A: Flooding type Infiltrometers
These can be further sub-divided into two as,
1. Single-tube flooding infiltrometer.
2. Double-tube flooding infiltrometer.
The length of the tube is of which 500 mm. part of the tube is kept under the ground level and 100 mm. part of the tube is kept above the ground level.
While placing the tube in the soil care is taken to have minimum disturbance to the present soil structure.
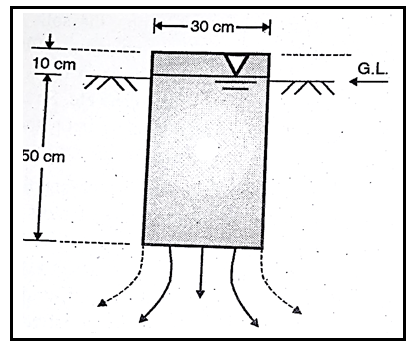
In this tube the water is added from the top opening and the level of water is constantly maintained.
The amount of water used the duration period and the depth of the water which has infiltrated in the soil is measured to know the rate of infiltration. For this a pointer gauge is used to show the water accurately.
2. Double-tube infiltrometer
It’s in case of a single-tube infiltrometer, the water may flow sideways, so two tubes are used their diameters vary between 300 and 600 mm.
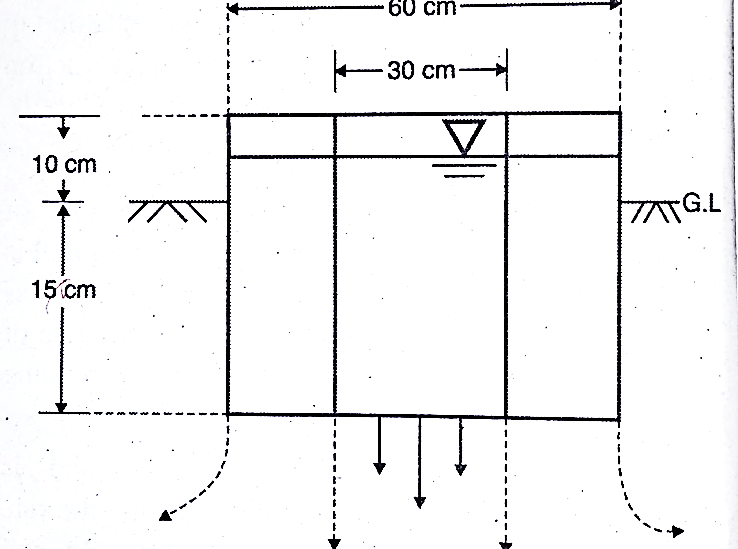
They are driven 150 mm. in the ground keeping 100 mm. part of the length of these tubes above the ground level
Outside these tubes a metal ring is used to avoid the side and the border effects.
Problems in using Infiltrometer
While the tubes in inserted the layer of the soil gets disturbed.
If proper care is not taken while the water is poured into the tube there will be some lateral flow of water (some water may pour out from the opening of the tube). In case of double tube infiltrometer the chances of such out flow is reduced.
While concluding this experiment, if it starts raining the in fact of raindrops cannot be avoided.
While pouring the water into the tube some air may get entrapped and it may also affect the process of infiltration.
The effects of slope on the rate of infiltration are not taken into accounts.
If the soil has some big borders, their impact on the rate of infiltration, is not considered in this experiment.
The size (diameter) of the tube also makes change in the rate of infiltration i.e. If the diameter of the tube is small the rate of infiltration is greater.
So, while noting down the rate of infiltration of the soil in different regions the above limitation must be kept in mind.
2. Infiltration indices
The rate of infiltration is very important because it is, a one hand a wastage of surface water but on the other hands, it is the way to increase the level of ground water, which also is used for domestic purpose as well as for commercial purpose through the dug well, tube well and springs etc.
To make is easy to understand, the rate of infiltration of water is assumed to be same at all the depths, in the soil in fact the rate of infiltration never remains equal at the top layer of soil it is always greater than at the lower layers. By assuming uniform rate, we can calculate this rate of infiltration by using following methods.

It is the most common method to express the rate of infiltration. For this the following equations are used,
P = E+SR+SD+Q+I
Or I = P- (E+SR+ SD) - Q
Where,
P = Precipitation; E = Evaporation.
SR = Surface retention (through, interception and depression storage)
Sp= Surface detention (after a while it also flows as a surface run off)
Q = Surface runoff;
I = Rate of Infiltration [If we neglect the effects of E, Sg and Sp]
The simple equation can be formed as,
 index = P-Q
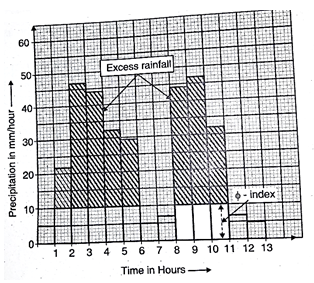
If we deduct the amount of water taken away from the total precipitation by the way of run-off. We can calculate the rate of infiltration. Fig. is a graphical expression of the above-mentioned index.
2. W Index
If all the abstractions i.e., evaporation surface retention, surface retention, surface detention etc. are considered, W index can be used to express the rate of infiltration.
It is expressed as,
W Index =P-(E+SR+Sp+Q)
so, W index is always lesser than o index.
3. W min Index
It is an expression which indicates the minimum rate of infiltration. It is observed when uniform stage is reached after the stabilization is attained. It is expressed as,
W = index (after the stage of stabilization)
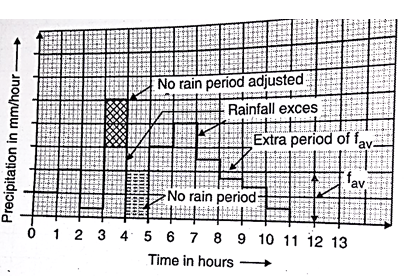
4. FAV
It is slight modification of index. In is assumed that in a storm, there is very low or no precipitation. The process of infiltration is still in progress, due to the effects of the early receipt of a heavy precipitation.
This situation can be expressed graphically as shown below.
Key takeaways:
References: