Software resiliency is synonymous with operational resiliency. It is defined as a system's or component's ability to fulfill its required functions under static conditions for a set amount of time.
Software reliability is sometimes described as the likelihood that a software system will complete its assigned task in a particular environment for a predetermined number of input cases, assuming error-free hardware and input.
Software Reliability, along with functionality, usability, performance, serviceability, capability, installability, maintainability, and documentation, is an important component of software quality.
Software reliability was created to predict the number of defects or faults in the software. Software reliability is the probability that the software will execute properly without any failure for a given period of time. Reliability is concerned with how well the software functions to meet the requirements of the customer. It represents a user-oriented view of the software quality.
The two terms related to software reliability are-
● Fault: a defect in the software, e.g., a bug in the code which may cause a failure.
● Failure: a derivation of the program's observed behavior from the required behavior.
Software reliability is hard to achieve, because the complexity of software tends to be high. While the complexity of software is inversely related to software reliability it is directly related to other important factors like software quality, especially functionality, capability.
Hardware versus Software Reliability
In any software industry, system quality plays an important role. It comprises hardware quality and software quality. We know that hardware quality is constantly high. So, if the system quality changes, it is because of the variation in software quality only.
Hardware components basically fail due to wear and tear, whereas software components fail due to bugs. To fix the hardware fault, we have to either repair or replace the failed parts. On the other hand, to fix software fault one has to track down until the error is encountered or the design is changed to fix the bug. Doing this the hardware reliability would remain the same, but software reliability would either increase or decrease.
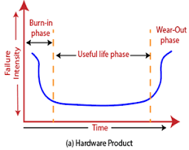
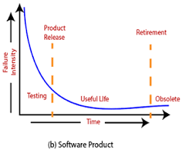
Fig 1: Change in failure rate of a product
Applications of Software Reliability
Software reliability can be used in a variety of ways.
● Software engineering technologies are compared.
○ What does it cost to implement a new technology?
○ In terms of cost and quality, what is the technology's return?
● Measuring the progress of system testing -The failure intensity metric informs us about the system's current quality: a high intensity indicates that further tests are required.
● Controlling the system's functioning - The number of software changes made for maintenance has an impact on the system's reliability.
● Better understanding of software development processes - Quality quantification allows us to have a better understanding of the development process.
Key takeaway:
Software reliability was created to predict the number of defects or faults in the software.
Reliability Metrics
Reliability Metrics are used to qualitatively express the reliability of the software product. Some reliability metrics which can be used to quantify the reliability of the software are as follows:
(i) Rate of Occurrence of failure (ROCOF):
It is the number of failures appearing in a unit time internal. The number of unexpected events over a specific time of operation. ROCOF is the frequency of occurrence with which an unexpected role is likely to appear. For e.g. A ROCOF of 0.05 means that five failures are likely to occur in 100 operational time unit steps.
(ii) Mean time to failure (MTTF):
MTTF is described as the time interval between the two successive failures. To measure MTTF, we can evidence data for n failures. Let the failures appear at time instant t1, t2, t3……… tn
So, MTTF can be calculated as,

An MTTF of 175 means that 1 failure is expected in each 175-time unit
(iii) Mean Time to Repair (MTTR):
MTTR is the average time it takes to track the errors causing the failure and to fix them.
(iv) Mean Time Between failure (MTBF):
The combination of MTTF and MTTR is MTBF.
MTBF = MTTF + MTTR
MTBF of 300 denotes that the next failure is expected to appear after 300 hours.
(v) Probability of Failure on Demand (POFOD):
POFOD is described as the possibility that the system will fail when a service request is made.
A POFOD of 0.1 means that one out of ten service requests may fail.
(vi) Availability (AVAIL):
Availability is the probability that the system is available for use at a given time. It also takes into account the repair time and the restart time for the system. An AVAIL of 0.995 means that in every 1000-unit time, the system is feasible to be available for 995 of these.
The metrics are used to improve the reliability of the system by identifying the areas of requirements.
Reliability Growth Modeling:
A reliability growth model is a mathematical model of how software reliability improves as errors are detected and repaired.
Jelinski & Moranda model:
The simplest reliability growth model is a step function model where it is assumed that the reliability increases by a constant increment each time errors are deleted and repaired.
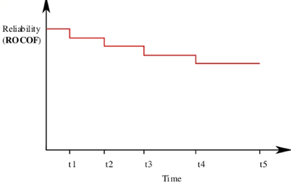
Fig 2: Step Function Model of Reliability Growth
Little wood and Verall’s model:
This model allows for negative reliability growth to reflect the fact that when a repair is carried out, it may introduce additional errors. It also models the fact that as errors are repaired, the average improvement to the product reliability per repair decreases.
Key takeaway:
A software reliability growth model is a numerical model that forecasts how software reliability will improve over time as defects are detected and fixed. These models assist the manager in determining how much time and effort should be spent testing. The project manager's goal is to test and debug the system until it meets the needed degree of reliability.
The Software Reliability Models are as follows:
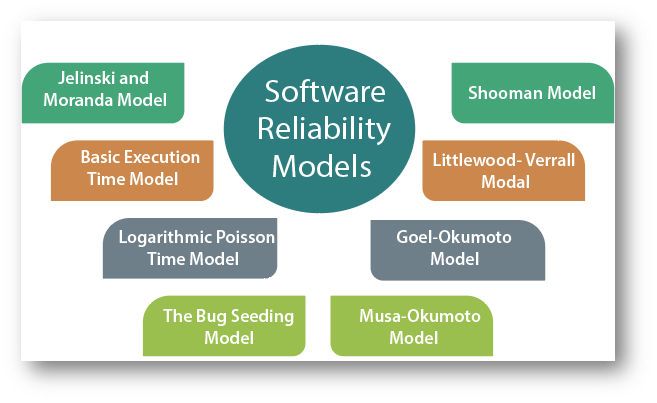
Fig 3: software reliability models
Jelinski and Moranda model
The Jelinski-Moranda model is a failure-to-failure time model. The following assumptions are made concerning the fault detection and rectification procedure in this model:
We may write the hazard rate (the instantaneous failure rate) as follows using assumptions a, b, d, and f:
Z(ti) = ϕ X [N-(i-1)], i=1, 2... N
Where t is the time interval between the discovery of the i'th and (i-1) th failure; is the proportionality constant specified in assumption (a); and N is the total number of defects in the system at the start.
This means that if (i-1) defects have been identified by time t, the system will still have N-(i-1) faults.
Basic Execution time model
J.D. Musa created this concept in 1979, and it is based on execution time. The basic execution model is the most common and widely used reliability growth model, owing to the following reasons:
● It is practical, straightforward, and simple to comprehend.
● Its characteristics have an obvious physical connection.
● It can be used to predict reliability with accuracy.
The basic execution model uses execution time to determine failure behavior at first. The execution time can be converted to calendar time later.
The mean failures observed in the basic execution model are stated in terms of execution time (τ) as

Where,
-λ0: stands for the initial failure intensity at the start of the execution.
-v0: stands for the total number of failures occurring over an infinite time period; it corresponds to the expected number of failures to be observed eventually.
Goel-Okumoto (GO) Model
The model developed by Goel and Okumoto in 1979 is based on the following assumptions:
Because each flaw is perfectly corrected after causing a failure, the number of intrinsic flaws in the software at the start of testing is equal to the number of failures that will arise after an unlimited period of testing. Assumption 1 states that M () follows a Poisson distribution with an expected value of N. As a result, under the Jelinski Moranda model, N is the predicted number of first software faults as opposed to the fixed but unknown actual number of first software faults 0.
Key takeaway
A software reliability growth model is a numerical model that forecasts how software reliability will improve over time as defects are detected and fixed.
The SEI approach provides a measure of the global effectiveness of a company’s software engineering practices and established five process maturity levels that are defined in the following manner:
Level 1: Initial.
The software process is characterized as ad hoc and occasionally even chaotic. Few processes are defined, and success depends on individual effort.
Level 2: Repeatable.
Basic project management processes are established to track cost, schedule, and functionality. The necessary process discipline is in place to repeat earlier successes on projects with similar applications.
Level 3: Defined.
The software process for both management and engineering activities is documented, standardized, and integrated into an organization-wide software process. All projects use a documented and approved version of the organization’s process for developing and supporting software. This level includes characteristics defined for level 2.
Level 4: Managed.
Detailed measures of the software process and product quality are collected. Both the software process and products are quantitatively understood and controlled using detailed measures. This level includes all characteristics defined for level 3.
Level 5: Optimizing.
Continuous process improvement is enabled by quantitative feedback from the process and from testing innovative ideas and technologies. This level includes all characteristics defined for level 4.
The five levels defined by the SEI were derived as a consequence of evaluating responses to the SEI assessment questionnaire that is based on the CMM. The results of the questionnaire are distilled to a single numerical grade that provides an indication of an organization’s process maturity.
The SEI has associated key process areas (KPAs) with each of the maturity levels. The KPAs describe those software engineering functions (e.g., software project planning, requirements management) that must be present to satisfy good practice at a particular level. Each KPA is described by identifying the following characteristics:
Eighteen KPAs (each described using these characteristics) are defined across the maturity model and mapped into different levels of process maturity.
The following KPAs should be achieved at each process maturity level:
i. Process maturity level 2
Requirement management
ii. Process maturity level 3
iii. Process maturity level 4
iv. Process maturity level 5
Each of the KPAs is defined by a set of key practices that contribute to satisfying its goals. The key practices are policies, procedures, and activities that must occur before a key process area has been fully instituted. The SEI defines key indicators as “those key practices or components of key practices that offer the greatest insight into whether the goals of key process areas have been achieved”.
Key takeaway
It is necessary to undertake software maintenance in order to:
Software reverse engineering is the process of recovering the design and the requirements specification of a product from an analysis of its code. The purpose of reverse engineering is to facilitate maintenance work by improving the understandability of a system and to produce the necessary documents for a legacy system. Reverse engineering is becoming important, since legacy software products lack proper documentation, and are highly unstructured.
Even well-designed products become legacy software as their structure degrades through a series of maintenance efforts. The first stage of reverse engineering usually focuses on carrying out cosmetic changes to the code to improve its readability, structure, and understandability, without changing its functionalities. A process model for reverse engineering has been shown in figure.
A program can be reformatted using any of the several available pretty printer programs which layout the program neatly. Many legacy software products with complex control structures and unthoughtful variable names are difficult to comprehend.
Assigning meaningful variable names is important because meaningful variable names are the most helpful thing in code documentation. All variables, data structures, and functions should be assigned meaningful names wherever possible. Complex nested conditionals in the program can be replaced by simpler conditional statements or whenever appropriate by case statements
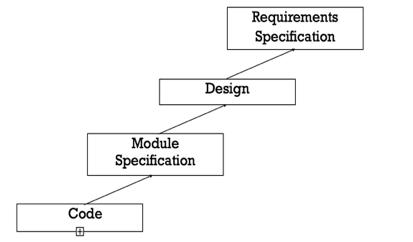
Fig 4: A process model for reverse engineering
After the cosmetic changes have been carried out on a legacy software the process of extracting the code, design, and the requirements specification can begin. In order to extract the design, a full understanding of the code is needed. Some automatic tools can be used to derive the data flow and control flow diagram from the code. The structure chart should also be extracted. The SRS document can be written once the full code has been thoroughly understood and the design extracted.
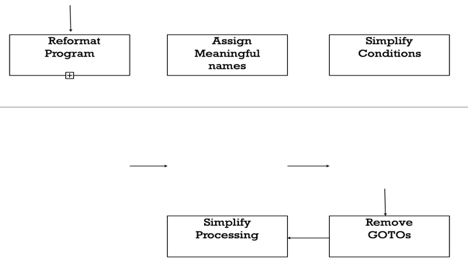
Fig 5: Cosmetic changes carried out before reverse engineering
Key takeaway:
Software re-engineering is the process of updating software to keep it current in the market without affecting its functionality. It is a lengthy procedure in which the software design is altered and programs are rewritten.
Legacy apps can't keep up with the most up-to-date technologies on the market. When hardware becomes outdated, software updates become a headache. And if software becomes obsolete over time, the functionality remains unchanged.
Unix, for example, was created in assembly language at first. Unix was re-engineered in C when the language C was created because working in assembly language was difficult.
Aside from that, programmers can find that some parts of software need more maintenance than others, as well as re-engineering.
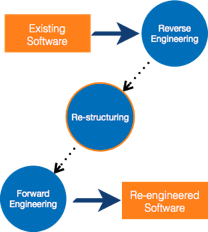
Fig 6: Re-engineering process
Process of Reengineering
● Determine what needs to be re-engineered. Is it the whole program or just a portion of it?
● Reverse engineering is a technique for obtaining requirements for current applications.
● If necessary, restructure the program. Changing function-oriented programs to object-oriented programs, for example.
● Reorganize data as needed.
● Fill out an application to get re-engineered applications, use forward engineering principles.
Key takeaway:
Software products are costly therefore a software project manager always looks for ways for cutting development cost. A feasible way to reduce development cost is to reuse parts from pre developed software. Reuse also leads to higher quality of the developed products.
In a software development following items can be reused effectively-
Basic issues in any Reuse program
In implementing any Reuse program, there arise some basic issues. Some of them are as follows-
● Component Creation: - For this, the reusable components have to be first recognized. Selection should be such that the component should have potential for reuse. Domain analysis can be used to create reusable components.
● Component indexing and storing: - Indexing means classifying the reusable components so that they can be easily reached for reuse. For easy access, when the number of components becomes large, components can be stored in a Relational Database management system (RDBMS) or an object-oriented database system (ODBMS).
● Component searching: - The programmers have to search for components which match their requirements from the database. For effective searching, the programmers require a proper method to describe the components.
● Component understanding: - A proper and complete understanding of a component is required to decide whether it can be reused or not. For that the components should be properly documented.
● Component adaptation: - Sometimes, the component may weed adaptation before they can be reused, since they may not exactly fit with the requirements.
● Repository maintenance: - Continuous maintenance for repository should be done. Maintenance here means new components have to be entered, faulty components have to be tracked and after the emergence of new applications, old applications should be removed.
Key takeaways
● The Client-Server architecture represents the application in the following way:
1. The server contains a set of Services, and
2. The client requests the services.
● The Client makes a request for the Server's services.
● Client and Server are two distinct processes.
● Net Banking and e-Commerce are two examples of services supplied.
Client Server Architecture
Client Server architecture are of two types:
1. Two-Tier Architecture
2. Three-Tier Architecture
Two Tier Architecture
In Client-Server architecture, one Server might be connected to more than one Client.
In this architecture, the application executes on two layers:
1. The Client Layer
2. The Server Layer
The two-tier architecture is of two types:
1. Thin-Client Model
2. Fat-Client Model
Thin-Client Model
In this model the Data Management and Application Logic is implemented on the Server and the Client is responsible for running the Presentation software.
Example: The Compiler makes use of a thin-client model.
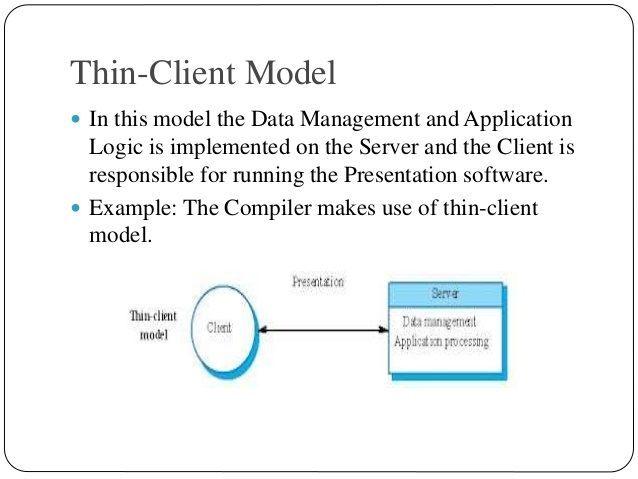
Fig 7: thin client model
Advantages
This model is used in Simple Applications.
Disadvantages
1. There is Heavy-Load on both the Server and the Network. The Server is responsible for all the computations which results in Heavy-Network Traffic between Client and Server.
2. As it executes only the Presentation tier on the Client, it doesn’t use the power of computing devices available.
Fat-Client Model
In this model, the Server is responsible only for Data Management. The Application and Presentation Software is executed on the Client Side.
Example: ATM is connected to the Server. User operates the ATM’s and the information is processed at the Client side. The Data Management is handled by the Server.
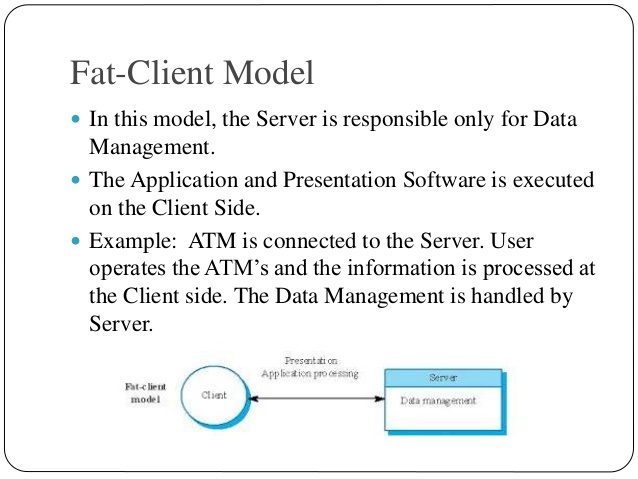
Fig 8: fat client model
Advantages
1. This model makes a proper utilization of power computing devices by executing the application logic on clients. Thus, Processing is distributed effectively.
2. Application functionality is spread across many computers and thereby efficiency of the overall system increases.
Disadvantages
1. System management is more complex.
2. If Application software has to be changed then this involves re-installation of software in every client and thus becomes Costly.
Three Architecture
In this architecture, the Presentation, Application Processing and Data Management are logically separate processes and execute on different processors.
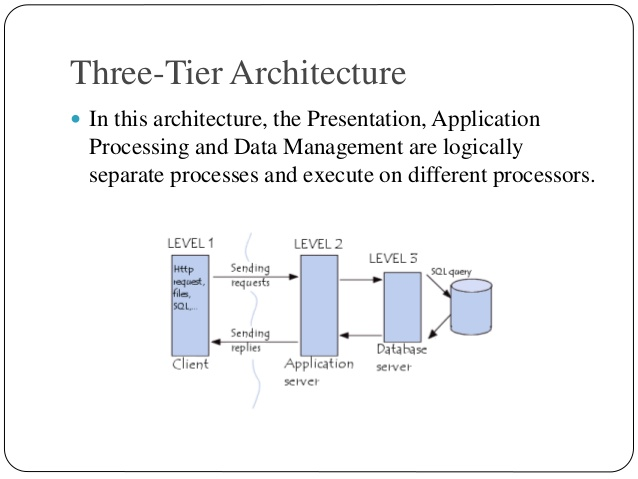
Fig 9: three architectures
Example of three tier architecture
● Internet Banking is an example of Three-Tier Architecture.
● The Client browses the web page and requests for Banking Transactions (The Presentation Layer).
● Then the Application Processes the request and communicates with the Database Server to verify the request for transaction (The Application Layer).
● The Database Server stores the bank database and executes queries. The Results of these queries are returned to Application Server. (Database Management Layer).
Key takeaway
The term "service-oriented architecture" refers to an architectural approach in which applications make use of network services. Services are supplied to form applications in this architecture via an internet communication call.
● SOA enables users to create applications by combining a large number of features from existing services.
● SOA refers to a set of architectural principles that organize system development and allow components to be integrated into a unified, decentralized system.
● SOA-based computing condenses functionality into a collection of interoperable services that may be implemented into a variety of software systems from various business domains.
Within Service-oriented Architecture, there are two key roles:

Fig 10: key role of SOA
Services may combine information and data collected from other services or construct service processes to meet the needs of a specific service customer. Service orchestration is the term for this method. Service choreography, which is the coordinated interaction of services without a single point of control, is another key interaction pattern.
Advantages
● Service reusability
● Easy maintenance
● Platform independent
● Availability
● Scalability
● Reliability
Disadvantages
● High overhead
● High investment
● Complex service management
"On-Demand Software" is another term for SaaS. It's a software distribution model in which a cloud service provider hosts service. These services are accessible to end-users via the internet, therefore they do not require the installation of any software on their devices to use them.
The following services are offered by SaaS providers:
Business Services: A SaaS provider offers a variety of commercial services to help a company get off the ground. ERP (Enterprise Resource Planning), CRM (Customer Relationship Management), billing, and sales are examples of SaaS commercial services.
Document Management: SaaS document management is a software application for creating, managing, and tracking electronic documents that is provided by a third party (SaaS providers).
Slack, Samepage, Box, and Zoho Forms are other examples.
Social Network: As we all know, the general public uses social networking sites, thus social networking service providers employ SaaS for their convenience and to manage the information of the general public.
Mail Services: To deal with the unpredictable amount of users and load on e-mail services, several email providers employ SaaS to deliver their services.
Advantages
● Stay focused on business processes
● Change software to an Operating Expense instead of a Capital Purchase, making better accounting and budgeting sense.
● Create a consistent application environment for all users.
● No concerns for cross platform support
● Easy Access
● Reduced piracy of your software
● Lower Cost
● Continuous Technology Enhancements
Disadvantages
● Initial time needed for licensing and agreements
○ Trust, or the lack thereof, is the number one factor blocking the adoption of software as a service (SaaS).
○ Centralized control
○ Possible erosion of customer privacy
● Absence of disconnected use
Key takeaway
References: