Unit - 4
Stability
Concept of Stability:
A stable system always gives bounded output for bounded input and the system is known as BIBO stable
A linear time invariant (LTI) system is stable if,
The system is BIBO stable
In absence of the input the output tends towards zero
 For system;
1)


For R(s) = 1
C(S) = 
R (t) =  (t) C (t) = t

Fig 1 Input and output for 
So, system unstable.
E.g., 2

[R(s) = 1]
 =
= 
C(t) = e-10t C(t)
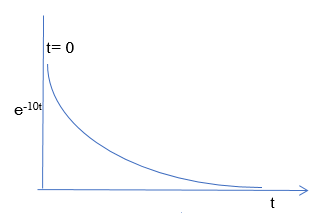
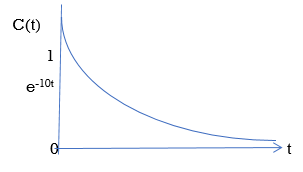
Fig 2 BIBO stable figure
Effect of location of Poles on stability
A) Real and negative G(s)= 
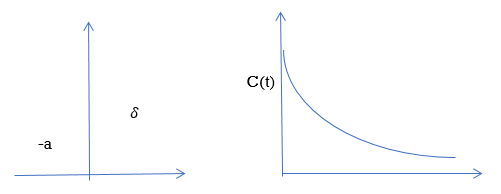
Fig 3 Output for G(s)= 
Stable
B) Poles on right half of S- plane
G(s) = 
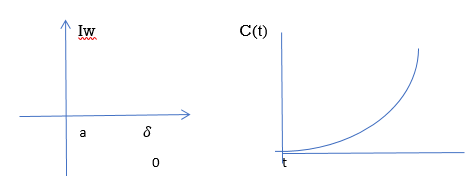
Unstable Unbounded Output
Fig 4 Input and Output for G(s) = 
(C)Poles at origin
G(s)=
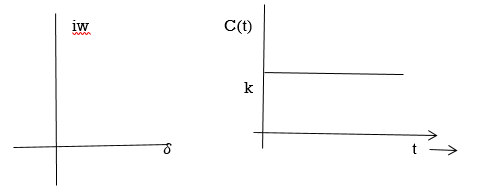
Marginally stable
Fig 5 Input and output for G(s)=
4) Complex poles on left half of S-plane
S1, S2= -α ± iw
 =
= 
C(t) = k e- αt Cos wt
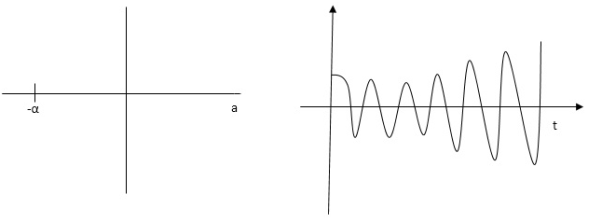
Fig 6 Pole location and output for C(t) = k e- αt Cos wt
At t - ∞ C(t) – 0 so, system stable
5) Complex poles on right half of S-plane
S1, S2 = α ± iw.
C(t) = k eαt COS wt.
 C(t) increases exponentially with t ∞
So, unstable.
6) Poles on iw axis:
S1, S2 = ± iw.
C(t) = k COS wt.
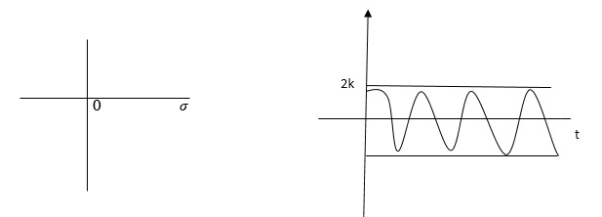
Fig 7 Output response of C(t) = k COS wt.
The system is marginally stable than sustained oscillations.
Key takeaway:
Consider a system with characteristic equation
aoSm + a1 Sm-1 ……………..am=0.
1) All the coefficients of above equation should have same sign.
2) There should be no missing term.
The above two condition are necessary but not sufficient condition for stability
The response of an asymptotically stable linear system is in the long run determined by its steady state component. During the initial time interval, the transient response decays to zero, according to the asymptotic stability requirement, so that in the remaining part of the time interval the system response is represented by its steady state component only. The so-called steady state errors, which represent the differences at steady state of the actual and desired system responses (outputs).
Consider the following open loop system

L-1[c(s)] = L-1[ G(s) R (S)]
C(t) = L-1[ G(S) Q (s)]
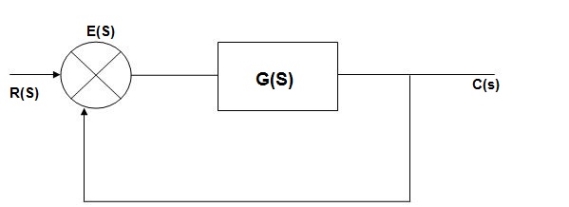
E(s) = R(s) –c(s) [ error signal]
C(S)= [ R(s)- c(Q)] G(s)
C(s) = R(s) G(s)- c(s) G(s)
C(s) [ 1+G(s)] = R(s) G(s)
C(s)/R(s) = G(s)/1+G(s)
C(s)/R(s) = G(s)/1+G(s)
E(s) = R(s)- c(s)
=R(s)-R(s) G(s)/1+G (s0
E(s) = R(s) [1/1+G(s)
If no error then E(s) = 0, f(t) = 0 Hence, r(t) = c(t)
The instantaneous value of a parabolic signal varies as square of the time from an initial value of zero t=0. The signal representation in figure below.
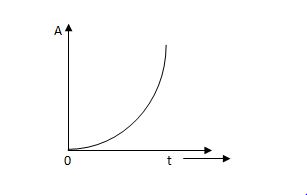
Fig 8 Parabolic Function
r(t) At2 t>=0
=0 t<0
Then Laplace Transform is given as
R(s) = L[At2] = 2A/s3
If no error then E(t) =0, R(t) = c(t), output is tracking the input.
Steady state Errors signal (ess): - (t  )
)
ess = t  e(t)
e(t)
Using final values, the theorem
 = ess =
  S.E (s)
ess=  S[R(s)/1+G/(s)]
So, for difficult input, ess will be different Input still be
1) R(s) = unit step (3) R(s) = parabolic
2) R (s) = Ramp
1) R(s)= Unit step
R(t) = u(t)
R(s) = 1/s
ess =  s [ R(s)/1+G(s)]
=  s[ys/1+G(s)]
ess=  1+1/1+G(s)
=1/1+lt G(s) s- 0
Kp =  G(s) (Position error coefficient)
ess = 1/1+kp
1) R(s) = Ramp
R(t) = t
R(s) = 1/s2
ess=  s [ R(s)/1+G(s)]
=  s[ys2/1+G(s)]
=  1/s(1+G(S)
= 1/s+SG(s)
ess = l/s-0 SG (s)
ess =  t L/SG (s)
Kv =  SG(s)
SG(s)
Velocity errors coefficient
ess = L/Kv
(3) Parabolic
R(t) = t2
R(s) =1/s3
Ess =  s [ R(s)/1+G(s)]
=  s(1/s3)/1+G(s)
=  1/s2+s2G(s)
Ess =  1/s2G(s)
Ka =  s2 G(s)
Acceleration error coefficient
Ess = 1/ka
Input Error coefficient
Unit step ess= 1/1+kv kv =  G(S)
G(S)
Ramp ess= 1/kv kv =  sG(s)
sG(s)
Parabolic ess = 1/ka ka =  s2 G(s)
Now finding errors in type 0,1,2 system
Type 0:
G(s) = 1/(s+a) (s+b)
1) Kp:
Kp =
= 1/(s+a) (s+b)
Kp= 1/ab
Ess=1/1+np = 1/1+(1/ab) 
o/p not locking the input
(b) kv:
Kv =  s G(s)
=  s/(s+a) (s+b)
= s/(s+a) (s+b)
Kv = 0
ess = 1/kv = 
o/p not locating the input
(3) ka:
Ka =  s2 G(s)
=  s2 /(s+a) (s+b)
Ka =0
ess = 1/ka = 
o/p not locking the input
Type –I:
G(s) = 1/s(s+a) (s+b)
(a) Kp:
Kp =  G(s)
G(s)
= 1/s(s2+as+ab)
Kp = 1/0 = 
ess = 1/1+kp = 0
o/p is tracking the input
(b) kv:
Kv =  S G(s)
= 1/(s+a) (s+b)
=1/ab
Kv = 1/ab
ess =1/ka = ab 
o/p is not tracking the input
3) ka:
Ka=  s2G(s)
=  s2 /s(s+a)(s+b)
=  s/(s+a)(s+b)
Ka= 0
Ess = 1/ka = 
O/p is not tracking the input.
Type 2:
G(s) = 1+/(s2(s+a) (s+b)
a) Kp:
Kp =  G(s)
G(s)
=  1/s2 (s+a) (s+b)
Kp = 
ess = 1/1+kp = 0
o/p tracking the i/p
b) kv:
Kv = s G(s)
= 1/s(s+a) (1+b)
kv = 
ess =1/ = 0
= 0
o/p tracking the o/p
(b) ka:
Ka=  s2G(s)
= 1/(s+a) (s+b)
Ka = 1/ab
ess = 1/(yab) ≠0
Output is not locking the input
|
Unit step ≠0 0 0 |
Ramp  |
Parabolic  |
Examples
Q1) For the CLTF G(s) =  . Find Kp, Kv and Ka?
Sol: Kp =  G(s)
G(s)
= 

= 1
Kv =  SG(s)
SG(s)
=  S
S 
= 0
Ka =  s2 G(s)
=  s2
s2 
= 0
Q2) For a unity feedback system G(s) =  an input t3u(t) is applied. Find the steady state error?
Sol: ess= 

r(t) = t3u(t)
R(s) = 6/s4
H(s) =1
ess= 

= 
= 
= 5/3
Q3) Determine the type and order of the system G(s)= K/S(S+1)
G(S)= K(S+1)/S2(S+2)
Sol: G(s)= K/S(S+1)
It is order 2 and type 1 system
G(S)= K(S+1)/S2(S+2)
It is order 3 and type 2 system
Q4) Derive position error coefficient?
Sol: R(s)= Unit step
R(t) = u(t)
R(s) = 1/s
Ess =  s[ R(s)/1+G(s)]
=  s[ys/1+G(s)]
ess=  1+1/1+G(s)
=1/1+lt G(s) s- 0
Kp =  G(s)
G(s)
(Position error coefficient)
The transient response of control system means changing so, this occurs mainly after two conditions and these two conditions are written as follows-
Condition one: Just after switching ‘on’ the system that means at the time of application of an input signal to the system.
Condition second: Just after any abnormal conditions. Abnormal conditions may include sudden change in the load, short circuiting etc.
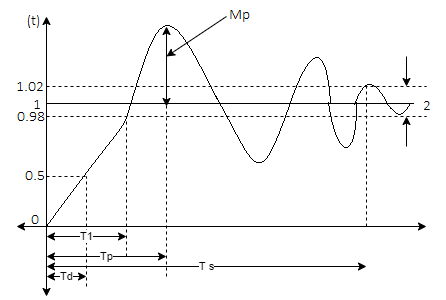
Fig 9 Transient Response
Specifications:
(1) Rise Time (tp): The time taken by the output to reach the already status value for the first time is known as Rise time.
C(t) = 1-e- wnt/
wnt/ 1-
1- 2 sin (wdt+ø)
Sin (wd +ø) = 0
Wdt +ø = n
tr =n -ø/wd
-ø/wd
For first time so, n=1.
tr =  -ø/wd
-ø/wd
T=1/
(2) Peak Time (tp)
The peak value attained by the output is called peak time. The time required by the output to reach this value is lp.
d(cct) /dt = 0 (maxima)
d(t)/dt = peak value
tp = n /wd for n=1
tp =  wd
wd
(3) Peak Overshoot Value:
Maximum deviation of output from steady state value is called peak overshoot value(Mp ).
(ltp) = 1 = Mp
( Sin(Wat + φ )
( Sin (Wd∏/Wd + φ)
Mp = e-∏ξ / √1 –ξ2
Condition 3 ξ = 1
C(S) = R(S) Wn2 / S2 + 2ξWnS + Wn2
C(S) = Wn2 / S(S2 + 2WnS + Wn2) [ R(S) = 1/S ]
C(S) = Wn2 / S( S2 + Wn2 )
C(t) = 1 – e-Wnt + tWne-Wnt
The response is critically damped.
(4). Settling Time (ts):
ts = 3 / ξWn (5%)
ts = 4 / ξWn (2%)
Disturbances are unwanted signals entering into a feedback control system. A disturbance may act at the input or output of the plant. Here we consider the effect of input disturbance.
To characterize the effect of a disturbance input on the feedback control system, we consider the modified block diagram that includes a disturbance input.

Fig 10 Modified Block Diagram
Let r(t) denote a reference, and d(t) a disturbance input; then the system output is expressed in the Laplace domain as

Assuming unity-gain feedback configuration (H(s)=1) the tracking error, e(s), is computed as:

By using the Final Value Theorem, the steady-state error is expressed as:

Where Kp is the position error constant.
A large loop gain (large Kp) reduces steady-state error in the presence of both reference and disturbance inputs. A large controller gain, K, can be used to increase Kp, however, a large K would generate a large magnitude input signal to the plant, which may cause saturation in the actuator devices (amplifiers, mechanical actuators, etc.).
To analyse the control requirements for simultaneous tracking and disturbance rejection, we consider a unity-gain feedback control system (H(s)=1).
Let G(s)=n(s)d(s) represent the plant and K(s)=nC(s)dC(s) represent the controller; then, the output in the presence of reference and disturbance inputs is given as:

The characteristic polynomial is given as: Δ(s)=n(s)nc(s)+d(s)dc(s)
Asymptotic tracking. For asymptotic tracking, d(s)dc(s) should contain any unstable poles of r(s). For example, an integrator in the feedback loop ensures zero steady-state error to a constant reference input.
Disturbance Rejection. For disturbance rejection, n(s)dc(s) should contain any unstable poles of d(s). For example, a notch filter centered at 60 Hz removes power line noise from the measured signal.
Example
A small DC motor has the following component values: R=1Ω, L=10mH, J=0.01kgm2, b=0.1Nsrad, kt=kb=0.05.
The DC motor transfer function is given as: G(s)=500/s2+110s+1025.
Since G(0)≅0.5, with a static controller, the position error constant is: Kp=0.5K. The steady-state error in the presence of reference and disturbance inputs is given as:
e(∞) =[1/1+0.5K]r(∞)−[0.5/1+0.5K]d(∞).
We may choose a large KK to reduce the steady-state tracking error as well as improve the disturbance rejection. A large value of K, however, reduces system damping and results in an oscillatory response of the DC motor.
For a static controller, the closed-loop characteristic polynomial is given as: Δ(s, K)=s2+110s+1025+500K
The resulting damping ratio is: ζ=55/√1025+500K
In order to limit the damping to, say ζ≤0.6, the controller gain is limited toK≤14.75. We may choose, for example, K=14, which results in the following steady-state error to reference and disturbance inputs: e(∞) =(1/8)r(∞)−(1/16)d(∞).
Reduction of parameter variations by use of feedback
The feedback systems are having many advantages over the non-feedback system as we have seen earlier. So, some performance parameters can be controlled through this feedback system such as sensitivity, noise etc. Sensitivity is a parameter which forecasts the effectiveness of feedback in reducing the influence of these variations on system performance. [Reference 4]
The output of the open loop system is given by
C(s) = G(s)R(s)
Now due to variation in parameters G(s) changes to [G(s)+ G(s)]. The output will now become
C(s)+ C(s) = [G(s)+
 G(s)] R(s)
 C(s) =
  G(s)R(s)
For closed loop system the output is given as
C(s) =  R(s)
R(s)
Now due to variation in parameters it becomes
C(s)+ C(s) =
 R(s)
R(s)
The above equation shows that if there is variation in parameters then G(s) is reduced by factor of 1+G(s)H(s). The variation in overall transfer function T(s) due to change in G(s) is defined as sensitivity.
Sensitivity = 
When there is small change in G(s) then sensitivity becomes

 : Sensitivity of T w.r.t G
For closed loop system the sensitivity will be
 =
=  x
x  =
= 
For open loop system
 = 1
= 1
As T=G
The sensitivity of T w.r.t H is given as
 =G [
=G [ ]
]  =
= 
The above equation shows that for large values of GH sensitivity of the feedback system w.r.t H approaches to unity.
Control over system dynamics by use of feedback
The dynamics of the system can be controlled by the feedback by adjusting the location of poles. In this section we will see how the location of poles effect the dynamics of the system.
Let us consider a system which has open loop transfer function of G(s) defined as
G(s) =  (1)
(1)
Let K =  /
/
 = 1/
= 1/
The poles for the above system lie at s= - and
and  =1/
=1/ is time constant.
The dc gain of the system is given by G(0) = K =  /
/
For closed loop system the transfer function is given by
 (2)
(2)
 =
= 
 =
=  /(1+K)
The above equation shows that due to feedback the system pole shifts from - to (–
to (– +K’). Due to this change the dynamic response of the system is also affected. For studying the dynamic response, we assume that the input to the system is an impulse.
r(t) =  (t)
(t)
And it can also be written as
R(s) = 1
Taking inverse Laplace transform of equation 1 we get
For open loop system
c(t) = K’
Taking inverse Laplace transform of equation 2 we get
For closed loop system
c(t) = K’
The system dynamic response decays in both the open system as well as closed loop system. The closed loop system time constant is  =
=  /(1+K) so its response decays faster than open loop system by factor of (1+K).
Control of effect of disturbance signals by use of feedback
The feedback helps to control the disturbances as they generate an error signal. The sfg for closed loop system is given by
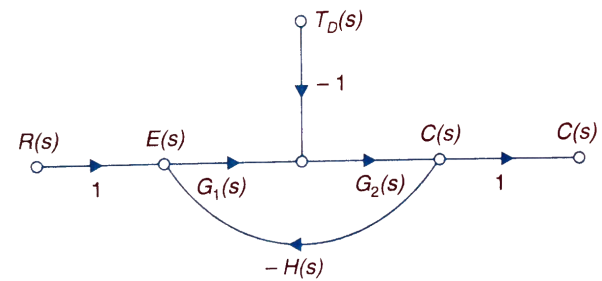
Fig 11 Closed loop system with disturbance signal
 =
= 
Where:
TD(s) = Disturbance signal.
For |G1G2H(s)|>>1 over the range of s
 =
=
The signal flow graph of a system with noise signal N(s) in the feedback path. The gain is given by
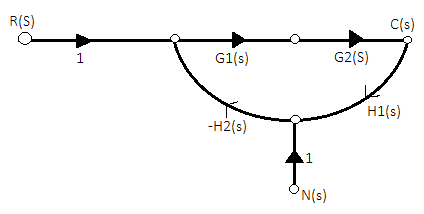
Fig 12 SFG for noise feedback function
 =
= 
For  >>1
>>1
Cn(s) = 
The feedback reduces sensitivity, improves transient response and minimises the effects of disturbance signal in control system.
Key takeaway:
The dynamics of the system can be controlled by the feedback by adjusting the location of poles.
The closed loop system time constant is  =
=  /(1+K) so its response decays faster than open loop system by factor of (1+K).
We have seen how to draw a root locus for given plant dynamics. We include a variable gain K in a unity-feedback configuration—we know this as proportional control. Sometimes, proportional control with a carefully chosen value of K is sufficient for the closed-loop system to meet specifications. But, what if the set of closed-loop pole location does not simultaneously satisfy the geometry that defines the specifications. We need to modify the locus itself by adding extra dynamics—a compensator or controller D(s)

We redraw the locus and pick K in order to put the poles where we want them.

Adding a compensator effectively adds dynamics to the plant.
Adding a left-half-plane pole pulls the root locus to the right. This tends to lower the system’s relative stability and slow down the settling of the response. But, providing that the closed-loop system is stable, the pole can also decrease steady-state errors.

- In first plot: The system is stable for all K, responses are smooth.
- In second plot: System also stable for all K, but when poles become complex, response shows overshoot and oscillations.
- In third plot: The system is stable only for small K, and oscillations increase as the poles approach the imaginary axis.
- But, steady-state error improves from left to right (assuming the closed-loop system is stable).
Again, generally speaking, adding a left-half-plane zero pulls the root locus to the left. This tends to make the system more stable, and speed up the settling of the response. Physically, a zero adds derivative control to the system, introducing anticipation into the system, speeding up transient response. However, steady-state errors can get worse.

In first plot: System is stable only for small K, and oscillates as poles approach imaginary axis. In second plot: System is stable for all K, but still oscillates. In third and fourth plots: More stable, less oscillation. But, steady-state error degrades from left to right.
Reducing steady-state error
We have a number of options available to us if we wish to reduce steady-state error.
Proportional Controller
Effects of controller are viewed on time response and stability.
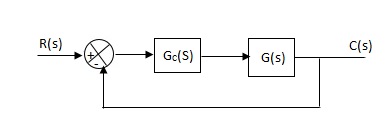
Fig 13 Controller with unity feedback system
Gc(S) = TF of the controller
G(S) = OLTF without controller
G’(S) = Gc(S).G(S)
= OLTF with controller
Proportional means scalar Multiplier.
Gc(S) = Kp Stability can be controlled
Que) G(S) = 1/S(S + 8)
CLTF = 1/S2 + 8S + 1
w2n = 1
wn = 1
2ξWn = 8
ξ = 4
ξ>/1 so, overdamped.
Now introducing Gc(S) = K
G’(S) = Kp/S(S + 8)
CLTF = Kp/S2 + 8S + Kp
wn = √Kp
2 ξwn = 8
ξ = 4/√Kp
If,
Kp = 16; ξ = 1; critically damped
Kp> 16; ξ< 1; undamped
Kp< 16; ξ> 1; overdamped
Integral (I) controller
The transfer function of this controller is
Gc(S) = Ki/S
Integral controller is used to improve the steady state response or reduce the steady state error.
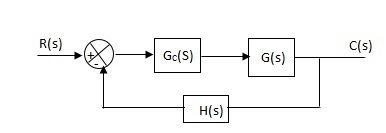
Fig 14 Integral Controller
G’(S) = Gc(S).G(S)
G(S) = 1/S + 5, Gc(S) = Ki/S
G’(S) = Ki/S(S + 5). After applying the Gc(S) the type of system is increasing and hence, the steady state error is decreasing (Refer Time Response).
Disadvantage -
By using integral controller, the stability of closed loop system decreases.
G(S) = 1/S + 5
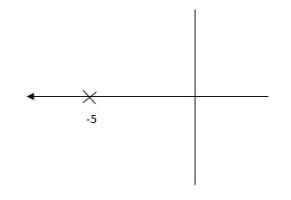
Fig 15 Pole Locations For given system
G’(S) = Ki/S(S + 5)
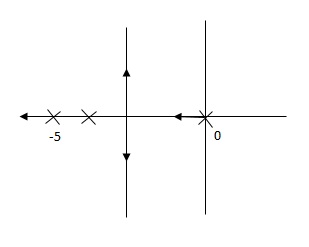
Fig 16 Pole Location after Integral controller
Fig(15), is more stable than (16) as more the away the pole from origin (imaginary axis) more is the stability.
Que. G(S) = 1/(S + 5)(S + 10)
G’(S) = Kp/S(S + 5)(S + 10)
G(S) = 1/(S + 5)(S + 10)
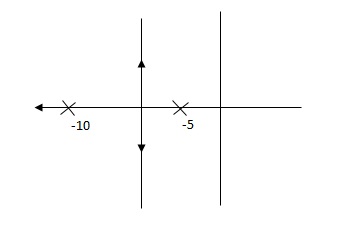
Fig 17 Root Locus Without controller
G’(S) = Ki/S(S + 5)(S + 10)
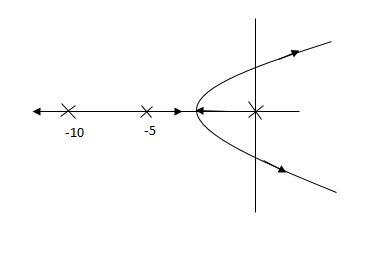
Fig 18 Root Locus Without controller
So, Fig 18 is less stable at root locus lies on the R.H.S,
Derivative (D) Controller -
Gc(S) = Kd(S)
They are used to improve the stability.
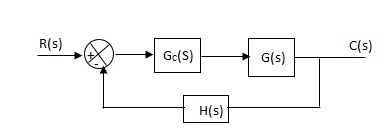
Fig 19 Derivative controller system
G’(S) = KdS/S2(S + 10)
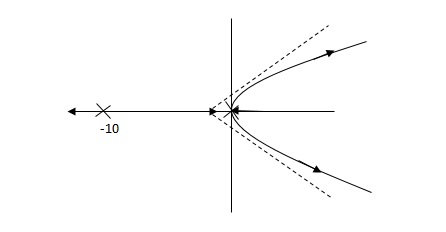
Fig 20 Root Locus for system without controller
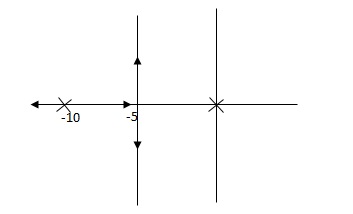
Fig 21 Root locus with controller
Fig 21 is stable i.e more stable than the Fig 20.
Disadvantage –
It increases the steady state i.e. o/p will not track the input at steady state.
Proportional Plus Integral [PI] controller -
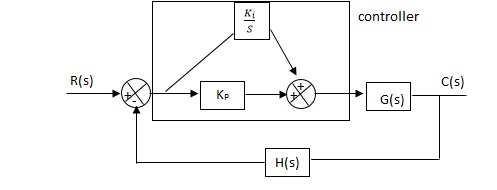
Fig 22 PI controller
Gc(S) = KpS + Ki/S
The steady state error will decrease and the stability will depend on Kp i.e. if Kp is increased/decreased than according to it stability will change (Kpα stability).
Used to reduce ess without much affecting the stability.
Proportional Plus Derivative (PD) Controller -
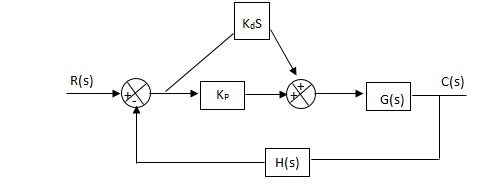
Fig 23 PD controller
Used to improve the stability without affecting much the steady state error.
PID controller
Gc(S) = Kp + Ki/S + KdS
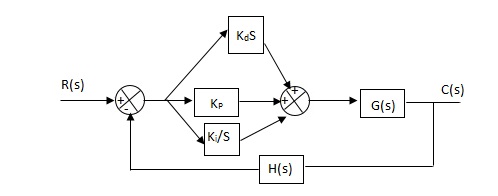
Fig 24 PID Controller
It improves the stability. It decreases the steady state error and both are proportional to Kp.
Key takeaway:
CL RESPONSE RISE TIME OVERSHOOT SETTLING TIME S-S ERROR
 Decrease Increase Small change Decrease
Ki Decrease Increase Increase Eliminate
Kd Small Change Decrease Decrease Small change
CL RESPONSE | RISE TIME | OVERSHOOT | SETTLING TIME | S-S ERROR |
 | Decrease | Increase | Small change | Decrease |
Ki | Decrease | Increase | Increase | Eliminate |
Kd | Small Change | Decrease | Decrease | Small change |
Examples
Que) The block diagram of a system using PI controllers is shown in the figure 18 Calculate:
(a). The steady state without and with controller for unit step input?
(b). Determine TF of newly constructed sys. With controller so, that a CL Poles is located at -5?

Fig 25 Block diagram with PI controller
(a). Without :
C(S)/R(S) = 0.2/(S + 1)
C(S) = R(S) 0.2/(S + 1) + 0.2
For unit step
Ess = 1/1 + Kp
Kp = lt G(S)
S 0
= lt 0.2/(S + 1)
S 0
Kp = 0.2
Ess = 1/1.2 = 5/6 = 0.8
(b). With controller:
Gc(S) = Kp + Ki/S
G’(S) = Gc(S).G(S)
= (Kp + Ki/S )0.2/(S + 1)
= (KpS + Ki)0.2/S(S + 1)
Ess = 1/1 + Kp = 0
So, the value of ess is decreased.
(b). Given
Kpi/Kp = 0.1
G’(S) = (Kp + Ki/S)(0.2/S + 1)
= (KpS + Ki)0.2/S(S + 1)
As a pole is to be added so, we have to examine the CE,
1 + G’(S) = 0
1 + (Kp + Ki)0.2/S(S + 1) = 0
S2 + S + 0.2KpS + 0.2Ki = 0
S2 + (0.2Kp + 1)S + 0.2Ki = 0
Given,
Kpi = 0.1Ki
Kp = 10Ki
S2 + (2Ki + 1)S + 0.2Ki = 0
Pole at S = -5
25 + (2Ki + 1)(-5) + 0.2Ki = 0
-10Ki – 5 + 25 + 0.2Ki = 0
-9.8Ki = -20
Ki = 2.05
Kp = 10Ki
= 20.5
Now,
G’(S) = (KpS + Ki)(0.2)/S(S + 1)
= (20.5S + 2.05)(0.2)/S(S + 1)
G’(S) = 4.1S + 0.41/S(S + 1)
Que. The block diagram of a system using Pd controller is shown, the PD is used to increase ξ to 0.8. Determine the T.F of controller?

Fig 26 Block diagram with PD controller
(1). Kp = 1
(a) Without controller:
C(S)/R(S) = 16/S2 + 1.6S + 16
wn = 4
2 ξwn = 16
ξ = 1.6/2 x 4 = 0.2
(b). With derivative:
ξS = 0.2 to 0.8
Undamped to critically damped,
G’(S) = (1 + KdS)(16)/(S2 + 1.6S)
CE:
S2 + 1.6S + 16(1 + KdS) = 0
S2 + (1.6 + Kd)S + 16 = 0
2 ξwn = 1.6 + Kd1.6
wn = 4
ξS = 0.8
2 x 4 x 0.8 = 1.6 + Kd1.6
6.4 – 1.6 = Kd1.6
4.8/16 = Kd
Kd = 0.3
TF = (1 + 0.3S)16/S(S + 16)
1>. Resonant Peak(Mr) :The maximum value of magnitude is known as Resonant peak. The relative stability of the system can be determined by Mr. The larger the value of Mr the undesirable is the transient response.
2>. Resonant Frequency(Wr) : The frequency at which magnitude has maximum value.
3>. Bandwidth: The band of frequencies lying between -3db points.
4>. Cut-off frequency –The frequency at which the magnitude is 3db below its zero frequency.
5>. Cut-off Rate – It is the slope of the log magnitude curve near the cut off frequency.
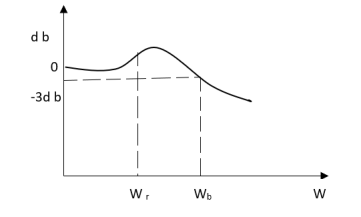
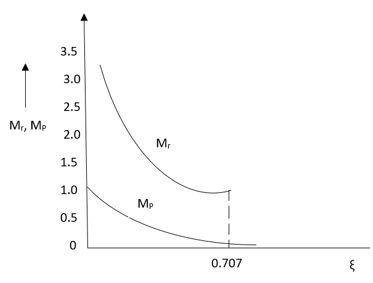
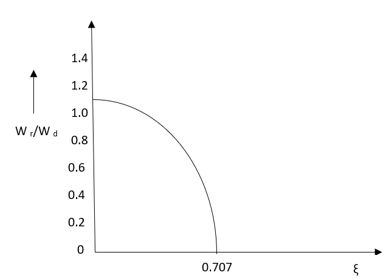
Fig 27 Frequency Domain Specification
In this section we show how to use Bode diagrams in order to design controllers such that the closed-loop system has the desired specifications. Three main types of controllers—phase-lead, phase-lag, and phase-lag-lead controllers. Here we give their interpretation in the frequency domain. We present the design procedure for the general controllers mentioned above.
Similar and simpler procedures can be developed for PD, PI, and PID controllers. After mastering the design with phase-lead, phase-lag, and phase-lag-lead controllers, students will be able to propose their own algorithms for PD, PI, and PID controllers. Controller design techniques in the frequency domain will be governed by the following facts:
(a) Steady state errors are improved by increasing Bode’s gain KB.
(b) System stability is improved by increasing phase and gain margins.
(c) Overshoot is reduced by increasing the phase stability margin.
(d) Rise time is reduced by increasing the system’s bandwidth.
However, very often it is not possible to satisfy all of these requirements at the same time, and control engineers have to compromise between several contradicting requirements.
Phase-Lag Controller
The transfer function of a phase-lag controller is given by

The corresponding magnitude and phase frequency diagrams for a phase-lag controller are presented in Figure
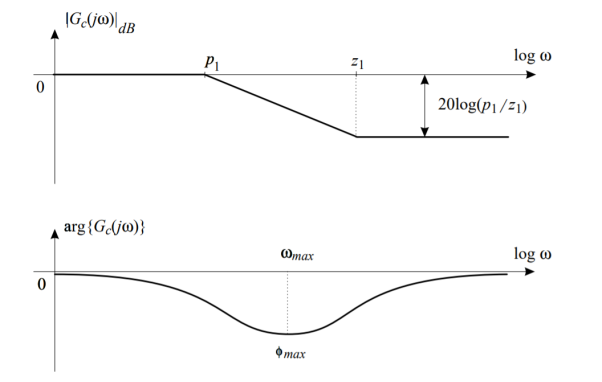
Fig 28 Magnitude approximation and exact phase of a phase-lag controller
Note that for the magnitude diagram it is sufficient to use only the straight line approximations for a complete understanding of the role of this controller. In general, straight line approximations can be used for almost all Bode magnitude diagrams in controller design problems. However, phase Bode diagrams are very sensitive to changes in frequency in the neighborhood of the corner frequencies, and so should be drawn as accurately as possible.
Due to attenuation of the phase-lag controller at high frequencies, the frequency bandwidth of the compensated system (controller and system in series) is reduced. Thus, the phase-lag controllers are used in order to decrease the system bandwidth (to slow down the system response). In addition, they can be used to improve the stability margins (phase and gain) while keeping the steady state errors constant.
Expressions for ωmax and ɸmax of a phase-lag controller will be derived in the next subsection in the context of the study of a phase-lead controller. As a matter of fact, both types of controllers have the same expressions for these two important design quantities.
Phase-Lead Controller
The transfer function of a phase-lead controller is

And the corresponding magnitude and phase Bode diagrams are shown in Figure
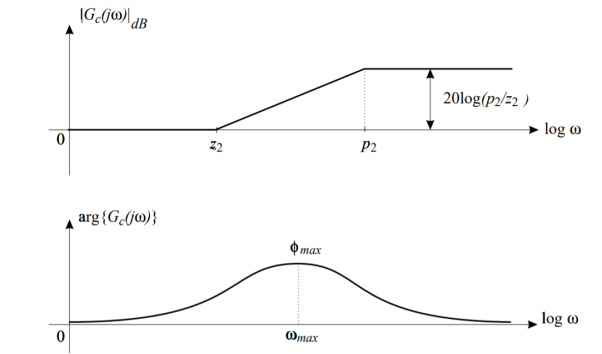
Fig 29 Magnitude approximation and exact phase of a phase-lead controller
Due to phase-lead controller (compensator) amplification at higher frequencies, it increases the bandwidth of the compensated system. The phase-lead controllers are used to improve the gain and phase stability margins and to increase the system bandwidth (decrease the system response rise time).
The phase of a phase-lead controller is given by

So that

Assume that 

The value for parameter a in terms of ɸmax

Phase-Lag-Lead Controller
The phase-lag-lead controller has the features of both phase-lag and phase-lead controllers and can be used to improve both the transient response and steady state errors. However, its design is more complicated than the design of either phase-lag or phase-lead controllers. The frequency transfer function of the phase lag-lead controller is given by


The Bode diagrams of this controller are shown in Figure
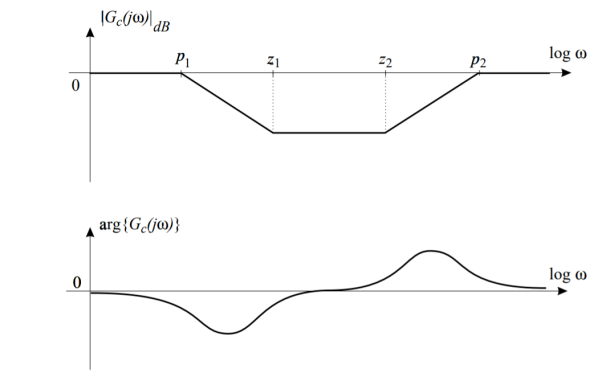
Fig 30 Bode diagrams of a phase-lag-lead controller
The PID controller applications include the following.
The best PID controller application is temperature control where the controller uses an input of a temperature sensor & its output can be allied to a control element like a fan or heater. Generally, this controller is simply one element in a temperature control system. The entire system must be examined as well as considered while choosing the right controller.
Temperature Control of Furnace
Generally, furnaces are used to include heating as well as holds a huge amount of raw material at huge temperatures. It is usual for the material occupied to include a huge mass. Consequently, it takes a high quantity of inertia & the temperature of the material doesn’t modify rapidly even when huge heat is applied. This feature results in a moderately stable PV signal & permits the Derivative period to efficiently correct for fault without extreme changes to either the FCE or the CO.
MPPT Charge Controller
The V-I characteristic of a photovoltaic cell mainly depends on the range of temperature as well as irradiance. Based on the weather conditions, the current and operating voltage will change constantly. So, it is extremely significant to track the highest PowerPoint of an efficient photovoltaic system. PID controller is used to finding MPPT by giving fixed voltage and current points to the PID controller. Once the weather condition is changed then the tracker maintains current and voltage stable.
The Converter of Power Electronics
We know that converter is an application of power electronics, so a PID controller is mostly used in converters. Whenever a converter is allied through a system based on the change within the load, then the converter’s output will be changed. For instance, an inverter is allied with load; the huge current is supplied once loads are increased. Thus, the parameter of voltage as well as the current is not stable, but it will alter based on the requirement.
In this state, this controller will generate PWM signals to activate the IGBTs of the inverter. Based on the change within the load, the response signal is provided to the PID controller so that it will produce n error. These signals are generated based on the fault signal. In this state, we can obtain changeable input & output through a similar inverter.
Application of PID Controller: Closed Loop Control for a Brushless DC motor.
They proposed the rules for determining values of proportional gain kp, derivative time Td and integral time Ti. They have proposed from (1) methods.
1) First Method: The basic PID controller is shown in figure below. In this method a unit step response of a plant. Is obtained if the plant has neither integrator non dominant complex conjugal poles, then the output step curve is of shape s. As shown below. These curves are generated experimentally.
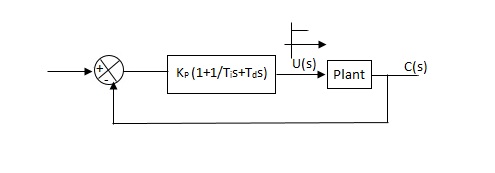
Fig 31 PID CONTROLLER
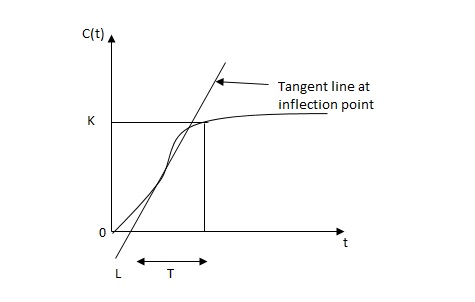
Fig 32 S-Shaped Response Curve

c(s) / l(s) = ke-l1s / ts+1
The values of KP, Ti and td should be set according to the table suggested by Ziegler Nichols tuning rules shown below.
Type of controller
Types of controller | Kp | Ti | Td |
|
P | T/L | 00 | 0 |
|
PI | 0.9T/L | L/0.3 | 0 |
|
PID | 1.2T/L | 2L | 0.5L |
|
Controller gain Gc(s)= kp(1+1/Tis+Tds)
= 1.2T / L(1+1 / 2LS+0.5 LS)
= 1.2t/l+0.6t / L2S+0.6TS
= 0.6T(2/L+1/L2S+S)
Gc(s) = 0.6 T(S+1/L)2/S
Thus, the PID controller has a pole at the origin and double zeros at S=-1/ L
Second Method -
1) Firstly, set Ti= and Td=0
2) use proportional control action only, increase kp from 0 to Kcr (Critical value).
3)then Kcr and pcr (period) are determined experimentally.

Fig 33 closed loop with proportional controller
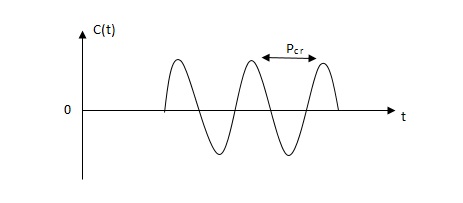
Fig 34 sustained oscillation with period pcr.
4)For this method Ziegler Nichols suggested new set of values for kp ,ti and td shown in table below.
Types of controller | KP | TI | Td |
P | 0.5Kcr |  | 0 |
PI | 0.45 KCR | 1/1.2PCR | 0 |
PID | 0.6KCR | 0.5PCR | 0.125PCR |
GC(S) = KP(1.1/Tis+Tds)
=0.6 Kcr(1+1/0.5PcrS+ 0.125 PCRS)
=0.075 KcrPcr(s+4/Pcr)2 / s
Thus, the PID controller has a pole at the origin and double zeros at s= -4/Pcr
Key takeaway:
It is a PID tuning method for controlling and improving parameters like Kp, Ti and Td. They provide good regulation.
For getting the required performance we need to adjust the design parameters and this is called compensation. To achieve the required output parameters a device called compensator is used. The compensators are mainly used to increase the steady state accuracy of system. These compensators minimise the overshoot. As these compensators are introduced in the system the transfer function changes and hence the performance specifications also change.
Lead compensation
Phase – Lead Compensation:
The phase of output voltage leads the phase of input voltage for the applied sinusoidal input. The circuit diagram is shown below. The transfer function is given as,
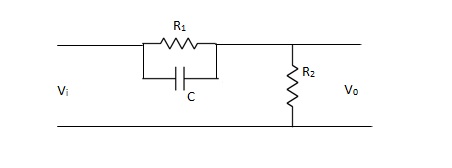
Fig 35 Phase Lead Compensation
Vo/Vi = α(1 + ST)/(1 + S α T)
Where, α = R2/R1 + R2 and α< 1
T = R1C
w = 1/T lower corner frequency due to zero.
w = 1/ αT upper corner frequency due to pole.
Mid frequency is given as,
wm = 1/T√ α
The maximum phase lead angle is φm
Φm = tan-1(1- α)/2√α = Sin-11- α/1 + α
Lag compensation
Phase Lag Compensation:
The phase of the output voltage lags the phase of the input voltage for applied sinusoidal input. The circuit diagram is shown below,
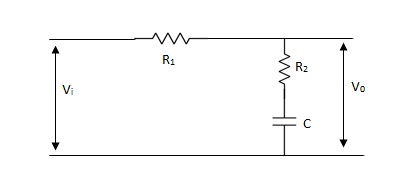
Fig 36 Phase Lag Compensation
Vo/Vi = 1 + ST/1 + SβT
Where, β = R1 + R2/R2, β> 1
T = R2C
w = 1/T upper corner frequency due to zero
w= 1/βT lower corner frequency due to pole
The mid frequency wm,
wm = 1/T√β
The maximum phase lead angle Φm
Φm = tan-11- β/2 √β
= sin-11 – β/1 + β
Lead-lag compensation
Phase Lag-Lead Network:
To overcome the disadvantages of lead and lag compensation, they are used together. As lead compensation does not provide phase margin but has fast response and lag compensation stabilize the system but does not provide enough bandwidth.
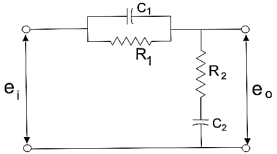
Fig 37 Lag-Lead Compensation
eo/ei = (1 + α ST1)/(1 + S T2)
T2)
Where, αT1 = R1C1
 T2= R2C2
We can say in the lag-lead compensation pole is more dominating than the zero and because of this lag-lead network may introduces positive phase angle to the system when connected in series.
Key takeaway:
Phase Lead Network Phase Lag Network
1>. It is used to improve the 1>It is used to improve the
Transient response. Steady state response.
2>. It acts as a high pass filter. 2>It acts as a low pass filter.
3>. The system becomes fast as 3>The Bandwidth decreases
Bandwidth increases as rise through rise time the speed
Time decreases. is slow.
4>. As the circuit acts as 4>Signal to noise ratio is higher as it a differentiator, signal to acts as integrator.
Noise ratio is poor.
5>. Maximum peak overshoot 5>It reduces steady state error thus
Is reduced. improve the steady state accuracy
Examples
Q1) Consider the following system

Where 
Performance requirements for the system:
Steady state: Kv =5
Transient response:
Phase margin > 40°
Gain margin > 10 dB.
A) Analysis of the system with Gc(s) = K

For K = 5, the closed-loop system is unstable
Design of a lag compensator


1) 
2) Phase margin of the system 5G(s) is -13°, the closed-loop system is unstable. From the Bode diagram of 5G(jω) we obtain that the additional required phase margin of 40° + 12° = 52° is obtained at ω=0.5 rad/sec. The new gain crossover frequency will be: ωc = 0.5 rad/sec.
3) Place the zero of lag compensator at ω=1/T=0.1rad/sec.
4) The magnitude of 5G(jω) at the new gain crossover frequency ωc =0.5 rad/sec is 20 dB. In order to have ωc as the new gain crossover frequency, the lag compensator must give an attenuation of -20db at ωc.
5) Therefore - 20log  = - 20 dB,
  =10.
=10.
6) 
The Bode diagram is
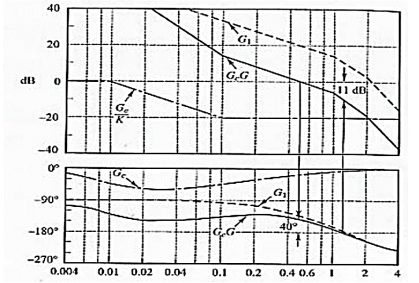
Bode diagrams for:
- G1(jω) = 5G(jω) (gain-adjusted KcβG(jω) open-loop transfer function)
- Gc(jω)/K = Gc(jω)/5 (compensator divided by gain Kcβ = 5)
- Gc(jω)G(jω) (compensated open-loop transfer function)
The effect of the lag compensator is:
- The original unstable closed-loop system is now stable.
- The phase margin 400 is acceptable transient response.
- The gain margin 11dB is acceptable transient response. Kv is 5 as required this is acceptable steady-state response.
- The gain at high frequencies has been decreased.
Q2) Given the control system
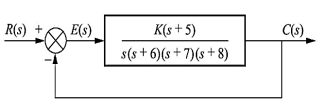
Find K such that there is a 10 percent error in steady state?
A2) Since system type is 1 the finite steady state error should be for a ramp input.
e(∞) = 1/ Kv = 0.1
We obtain K = 672
Q3) Consider the System (with one integrator) in the following figure

The steady state error for r(t) = 5u(t) will be?
A3) The steady state error for r(t) = 5u(t) will be

Q4) Consider the System (with one integrator) in the following figure

The steady state error for r(t) = 5tu(t) will be?
A4) The steady state error for r(t) = 5tu(t) will be

Q5) Consider the System (with one integrator) in the following figure

The steady state error for r(t) = 5t2u(t) will be?
A5) The steady state error for r(t) = 5t2u(t) will be

Q6) Consider the System (with no integrator) in the following figure

The steady state error for r(t) = 5u(t) will be?
A6) The steady state error for r(t) = 5u(t) is

Q7) Consider the System (with no integrator) in the following figure

The steady state error for r(t) = 5tu(t) will be?
A7) The steady state error for r(t) = 5tu(t) is

References:
[1] I. J. Nagrath and M. Gopal, “Control Systems Engineering”, New Age International, 2009.
[2] K. Ogata, “Modern Control Engineering”, Prentice Hall, 1991
[3] M. Gopal, “Control Systems: Principles and Design”, McGraw Hill Education, 1997.


