Unit - 1
Introduction
The elements which form a digital communication system is represented by the following block diagram for the ease of understanding.
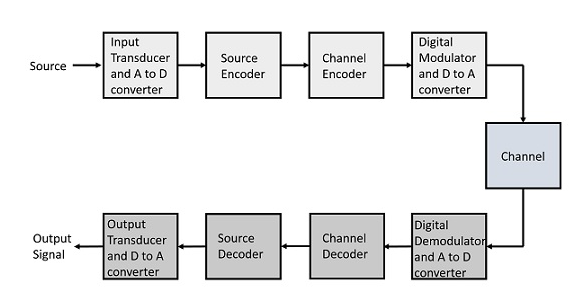
Fig 1 Elements of Digital Communication System
Following are the sections of the digital communication system.
Source
The source can be an analog signal.
Example: A Sound signal
Input Transducer
This is a transducer which takes a physical input and converts it to an electrical signal. This block also consists of an analog to digital converter where a digital signal is needed for further processes.
A digital signal is generally represented by a binary sequence.
Source Encoder
The source encoder compresses the data into minimum number of bits. This process helps in effective utilization of the bandwidth. It removes the redundant bits unnecessary excess bits, i.e., zeroes.
Channel Encoder
The channel encoder, does the coding for error correction. During the transmission of the signal, due to the noise in the channel, the signal may get altered and hence to avoid this, the channel encoder adds some redundant bits to the transmitted data. These are the error correcting bits.
Digital Modulator
The signal to be transmitted is modulated here by a carrier. The signal is also converted to analog from the digital sequence, in order to make it travel through the channel or medium.
Channel
The channel or a medium, allows the analog signal to transmit from the transmitter end to the receiver end.
Digital Demodulator
This is the first step at the receiver end. The received signal is demodulated as well as converted again from analog to digital. The signal gets reconstructed here.
Channel Decoder
The channel decoder, after detecting the sequence, does some error corrections. The distortions which might occur during the transmission, are corrected by adding some redundant bits. This addition of bits helps in the complete recovery of the original signal.
Source Decoder
The resultant signal is once again digitized by sampling and quantizing so that the pure digital output is obtained without the loss of information. The source decoder recreates the source output.
Output Transducer
This is the last block which converts the signal into the original physical form, which was at the input of the transmitter. It converts the electrical signal into physical output.
Output Signal
This is the output which is produced after the whole process.
Key takeaway
The channel decoder, after detecting the sequence, does some error corrections. The distortions which might occur during the transmission, are corrected by adding some redundant bits.
Communication channel is a connection between transmitter and receiver through which data can be transmitted. They are also called as communication media or transmission media.
The basic types of communication channel can be categorised as
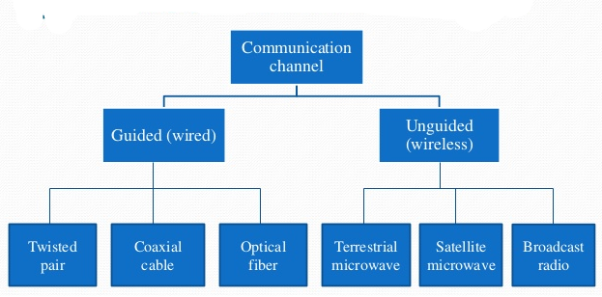
Fig 2 Communication Channel
Twisted Pair Cable
One of the wires carries signal, the other is used only as a ground reference. Number of twists per unit length determines the quality of the cable.

Fig 3 Twisted pair cable
Types of Twisted pair cable
- Shielded twisted pair cable
- Unshielded twisted pair cable
- Categories off Twisted pair cables
- Category 1- 0.1Mbps
- Category 2- 2Mbps
- Category 3 – 10Mbps
- Category 4 -20Mbps
- Category 5 – 100Mbps
- Category 6- 200Mbps
- Category 7- 600Mbps
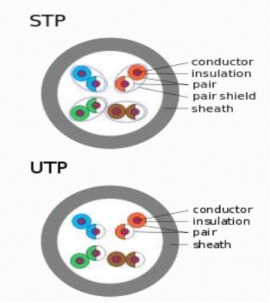
Fig 4 Interior of cables
Coaxial cable
It us used for both analog and digital signals. They effectively used at higher data rate and higher bandwidth. For analog signals need amplifiers every few km. For digital signals require every 1km.

Fig 5 Coaxial cable
Optical fibre cable
A fibre -optic cable is composed of very thin strands of glass or plastic known as optical fibres one cable can have as few as two strands or as many as several hundreds of them. These optical fibre cables carry information in the form of data between two places using optical or light-based technology. Once the light beams travel down the optical fibre cable (OFC), they would emerge at the other end.
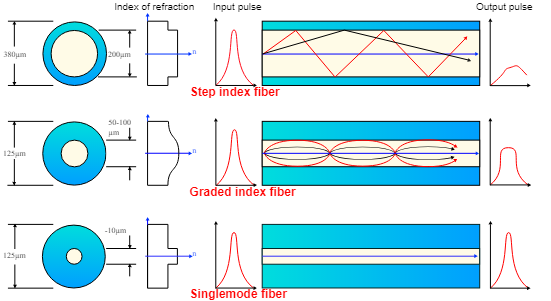
Fig 6 Optical Fiber Cable
The basis on refractive index OFC is of two types:
Step Index Fibbers: It comprises a core enclosed by the cladding, which has a single uniform index of refraction.
Graded Index Fibbers: The refractive index of the optical fibre decreases as the radial distance from the fibre axis increases.
Based on materials, OFC is of 2 types:
Plastic Optical Fibbers: The poly (methyl methacrylate) is used as a core material for the transmission of light.
Glass fibres: It consists of extremely fine glass fibres.
Based on the mode of propagation of light, OFC is divided into:
Single-Mode fibres: Used for long-distance transmission of signals.
Multimode fibres: Used for short-distance transmission of signals.
Terrestrial microwave
They require very few repeaters. The use parabolic dish to focus a narrow beam. They work on frequencies between 1-40GHz.
Satellite Communication
It receives only one frequency and transmits on another frequency. This means that the uplink frequency ranges from 5.925-6.425GHz and downlink frequency of 3.7-4.2 GHz. They work over a height of 35,784km. The speed of transmission is at least 3-40 apart.
Broadcast Radio
The radio frequency ranges from 3kHz-300GHz. They use broadcast radio of 30MHz-1GHz, for FM radio and UHF and VHF television. The transmission is unidirectional. It suffers from multipath interference due to reflections from land, water and other objects. They are used for multicast communications such as radio and television and also for paging systems.
Key takeaway
- Communication channels are essential for communication systems. The transmission characteristics are important in selecting channel because they directly affect the communication quality.
- Different types of communication channels have different transmission characteristics and costs, they are used in different applications.
The mathematical model reflects the most important characteristics of the system. Channel mathematical model helps to design channel encoder and modulator at receiver and channel decoder and demodulator at receiver side.
Additive noise channel
It is simplest mathematical model. The transmitted signal S(t) corrupted by an additive random noise process n(t). This n(t) arises from electrical components. If noise is introduced primarily at receiver side by components it may be characterized as thermal noise. This type of noise is characterised as Gaussian noise process. The model mathematical model for this channel is called additive Gaussian noise channel.
A signal may be contaminated along the path by noise. Noise may be defined as any unwanted introduction of energy into the desired signal.
In radio receivers’ noise may produce hiss in the loud speaker output. Hence noise is random and unpredictable.
Noise is produced in both external and internal to the system.
External noise includes
- Atmospheric noise (lightening)
- Galactic noise (thermal radiation)
- Industrial noise (from motors, ignition)
We can minimize or eliminate external noise by proper system design.
Internal noise is generated inside the system. It is resulted due to random motion of charged particles in resistors, conductors and electronic devices.
With proper design it can be minimized but never can be eliminated.
Types of Noise
- White Noise
- Thermal noise
- Shot noise
- Partition noise
- Low frequency or flicker noise
- Burst noise
- Avalanche noise
- White Noise
One of the important random processes is the white noise process. Noises in many practical situations are approximated by the white noise process.
White noise plays an important role in modelling of WSS signals. A white noise process W(t) is a random process that has constant power spectral density at all frequencies.
Thus
S w(w) = N0/2 ----------------(1) - ∞<w<∞
Where No is real constant and called the intensity of the white noise. The corresponding autocorrelation is given by
Rw ( = N/2
= N/2  (
( where
where  (
( is the Dirac delta.
The average power of white noise
P wg = E W 2 = 1/2π dw -> ∞
The autocorrelation function and the PSD of white noise process is shown in Figure.
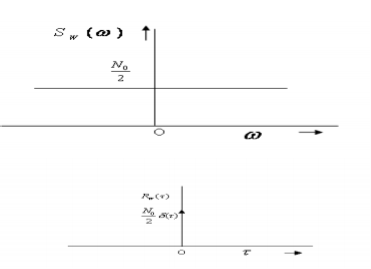
Fig.7 Autocorrelation function
- Thermal Noise
- Thermal noise is the electronic noise generated by thermal agitation of charge carriers inside an electrical conductor in equilibrium, which happens regardless of any applied voltage.
- Movement of electrons will form kinetic energy in the conductor related to temperature in the conductor.
- When the temperature increases the movement of electrons increases and current flows through the conductor.
- Current flows due to free electrons which create noise voltage n(t).
- Noise voltage is influenced by temperature hence it is called thermal noise.
Q. Calculate the thermal noise power available from any resistor at room temperature (290K) for a bandwidth of 1Mhz. Calculate also the corresponding noise voltage given that R = 50 Ω.
Pn = 1.38 x 10 -23 x 290 x 10 6
= 4 x 10 -15.
En2 = 4 x 50 x 1.38 x 10 -23 x 290
= 0.895 µ V
- Shot Noise
- Shot noise arises because the current consists of a vast number of discrete charges.
- The continuous flow of these discrete pulses gives rise to almost white noise. There is a cut-off frequency by the time it takes for the electron or other charge carrier to travel through the conductor.
- Unlike thermal noise, this noise is dependent upon the current flowing and has no relationship to the temperature at which the system is operating.
- Shot noise is more apparent in devices such as PN junctions. The electrons are transmitted randomly and independently of each other.
- Partition Noise
When the circuit is to divide in between two or more paths then the noise generated is known as Partition noise. The reason for this generation is random fluctuation in the division.
- Flicker Noise
Flicker noise or modulation noise is the one appearing in transistors operating at low audio frequencies. Flicker noise is proportional to the emitter current and junction temperature. However, this noise is inversely proportional to the frequency.
- Burst Noise
Burst noise consists of step-like transitions suddenly between two or more discrete voltages or current levels.
Each shift in offset voltage or current lasts for millisecond to seconds. It is also known as popcorn noise because of the popping or crackling sound it produces in audio circuits.
- Avalanche Noise
Avalanche noise is the noise produced when a junction diode is operated at the onset of avalanche break down, a semiconductor junction phenomenon in which the carriers having high voltage gradient develop sufficient energy to dislodge additional carriers through physical impact creating ragged current flow.
Key Takeaways:
- The average power of white noise
P wg = E W 2 = 1/2π dw -> ∞
2. Noise may be defined as any unwanted introduction of energy into the desired signal.
Fourier series expansion of periodic functional symmetry condition:
Fourier series Representation of Periodic Signals.
To represent any periodic signal x(t) Fourier developed an expression called Fourier series. This is in terms of an infinite sum of sines and cosines or exponentials.
A periodic signal is one which repeats itself periodically over -∞ < t < ∞
A sinusoidal signal x(t) = A sin Ω0t is periodic with period T = 2π/ Ω0.
Let us consider a signal x(t) is a sum of sine and cosine functions whose frequencies are integer multiple of Ω0.
x(t) = a0 + a1 cos (Ω0t) + a2 cos (2 Ω0t) + a3 cos (3 Ω0t) ……. + ak cos (k Ω0t) + b1 sin(Ω0t) + b2 sin (2Ω0t) + b3 sin(3Ω0t) + ………. + bk sin (k Ω0t) ------------- (1)
= a0 + 
Where a0, a1……. Ak and b1, b2………bk are constants and  is the fundamental frequency.
If the signal x(t) has to be periodic then it should satisfy the condition
x (t + T) = x(t)
x (t + T) = a0 +  ---------------- (2)
= a0 +  Here
Here 
= a0 +  -------------- (3)
= x(t)
Evaluation of Fourier Coefficients
The constants a0, a1, a2 ……… an, b1, b2…….bn are called Fourier coefficients. To evaluate ao we have to integrate both sides of eq (3) over one period (t0, t0+T) n of x(t) from an arbitrary time t0.
Thus  +
+  -------(4)
 +
+  ------(5)
= a T +  ------(6)
Each of the integrals in the summation in the above equation (6) is zero since the net areas of sinusoids over the complete periods are zero for any nonzero integer n.
Therefore
 = aoT----------(7)
 a0 = 1/T
  ------(8)
To evaluate an and bn
 = 0 for m≠n when m=n ≠0 = T/2. -------(9)
 = 0 for values of m and n-------(10)
 = 0 when m≠n when m=n ≠0 = T/2------(11)
To find a multiply eq (3) by cos ( and integrate over one period. That is
 +
+ t -----------(12)
The first integral on the RHS of the above equation yields to zero because we are integrating over one period.
Therefore
 = am T/2-----(13)
Am = 2/T  or
or
An = 2/T 
Similarly
Bn=2/T 
The Fourier series of functions is used to find the steady-state response of a circuit.
Condition for symmetry There are different types of symmetry that can be used to simplify the process of evaluating the Fourier coefficients.
- Even function symmetry
A function is defined to be even if and only if
f(t) = f(-t)
If a function satisfies the equation, then it is said to be even because polynomial functions with only even exponents have this type of behavior.
Av = 2/T 
Ak = 4/T  bk=0 for all values of k.
The function is even if the coefficients of b are zero.
When t0 = -T/2 then
Av = 1/T 
Av = 1/T  +
+ 
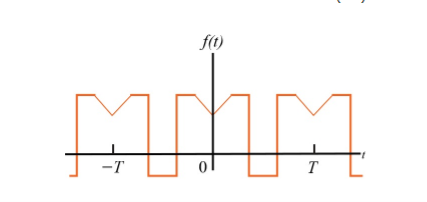
When t= -x we observe that f(-x) =f(x) since it is even function.
 =
=  =
= 
Which does show that integrating from -T/2 to 0 is the same as integrating from 0 to T/2
Therefore
Ak = 2/T  + 2/T
+ 2/T 

Similarly
 =
=  =
= 
To find the Fourier coefficients the integration lies between 0 and T/2.
- Odd function symmetry
A periodic function is defined to be odd if f(t) = -f(t) due to the fact that polynomial functions with only odd exponents behave this way.
The expression is
Av= 0; ak = 0 for all k;
Bk = 4/T 
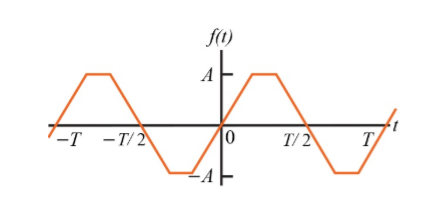
The evenness (oddness) of a function can be dismantled by shifting the periodic function along the time axis.
Example:
For the following diagram explain whether it is even or odd.
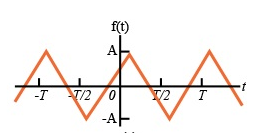
Solution:
The signal is neither even nor odd.
To make the signal even there is a slight shift to be applied as shown in the figure.
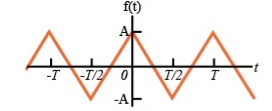
To make the signal odd

- Half-wave symmetry:
A periodic signal satisfying the condition
x(t) = -x (t ± T/2)
Is said to half symmetry. The Fourier series expansions of such type of periodic signals contains odd harmonics only.
Example:
Show that the signal x(t) that satisfies half wave symmetry contains Fourier coefficients with odd harmonics only.
A signal with half-wave symmetry that satisfies the condition x(t+T/2) = - x(t)
The Fourier coefficients of the signal are
Cn = 1/T  Ω0 dt
Ω0 dt
= 1/T [ Ω0 dt +
  Ω0 dt
Ω0 dt
= 1/T  Ω0 dt +
  Ω0 dt
Ω0 dt
=  Ω0 dt -
 Ω0 dt
Ω0 dt
Here e-jnπ = 1 for n
Even.
Hence Cn=0
Ω0 = 2π/T
- Quarter-wave symmetry
If a function has half-wave symmetry and symmetry about the midpoint of the positive and negative half-cycles, the periodic function is said to have quarter--wave symmetry.
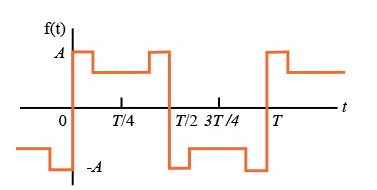
Problems:
Find the trigonometric Fourier series for the periodic signal x(t) as shown in the figure.
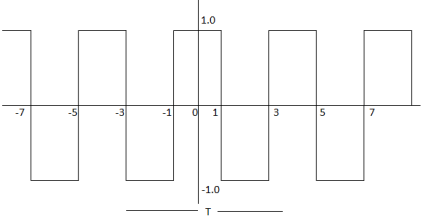
For the given signal the period T =4.
For our convenience let us choose one period signal from t= -1 to t=3
That is t0=-1 and t0+ T =3.
The fundamental frequency
 = 2 π/T =2 π/4= π/2.
x(t) = {1 for -1 ≤t ≤1
-1 for 1≤t≤3}
a0= 1/T 
= ¼  = ¼ [
= ¼ [  +
+  ]
]
= ¼ [ t |-1 1 + (-t) | 1 3]
= ¼ [ 1 – (-1) – (3-1)] = 0
a0 = 0.
An = 2/T 
½ 
= ½  +
+ 
= ½ [ 2/ nπ sin(nπ/2t) | -1 1 - 2/nπ sin(nπ/2t) |1 3
= ½ [ 8/nπ sin(nπ/2)] = 4/nπ sin(nπ/2)
An=4/nπ sin(nπ/2)
Bn = 1/2 
= ½  +
+ 
= ½ [ -2 /nπ cos(nπ/2t) | -1 1 + 2/nπ cos(nπ/2t) | 1 3
= -2/nπ (cosnπ/2 – cos nπ/2) + 2/nπ (cos 3nπ/2 – cosnπ/2)
= 0
Therefore 4/nπ sin nπ/2 = {0 n even
4/nπ = 1,9,13….
-4/nπ 3,7,11,15…….
x(t) = 
= 4/π cos (π/2 t) – 4/3π cos (3π/2 t) + 4/5π cos (5π/2 t) - ………….
= 4/π [ cos (π/2 t) -1/ 3 cos (3π/2 t) + 1/5 cos (5 π/2 t) – 1/7 cos (7π/2 t) + ……….
Key takeaway
The Fourier series of functions is used to find the steady-state response of a circuit.
Consider a periodic signal f(t) with period T. The complex Fourier series representation of f(t) is given as
f(t) =  k ejkw0t
=  k ej2π/T0kt -------- (1)
Let 1/T0 =  f then equation (1) becomes
f(t) =  k ej2π
 kft --------------- (2)
But you know that
Ak = 1/ T0  e-jkw0t dt
Substitute in eq (2)
f(t) = 
 e-jkw0t dt ej2πk
  ft
ft
Let to = T/2 then

 e-j2πkt
  dt ej2πkt
  ft
ft  f
f
As lim T-> ∞  f approaches differential df, k
  f becomes continuous variable hence summation becomes integration
f(t) = lim T-> ∞ { 
 e-j2πk
  ft dt] ej2πk
  ft
ft  f
f
= 
 e-j2π ft dt] ej2π ft df
f(t)= 
 ejwt dw
Where F(w) =  e-j2π ft dt
Fourier transform of a signal is given by
f(t) = F(w) =  e-jwt dt
And Inverse Fourier transform is given by
f(t) =  ejwt dw
Fourier transform are classified into
- Continuous Fourier transform and
- Discrete Fourier transform.
Continuous Fourier Transform
Fourier series was defined for periodic signals. A periodic signal can be considered as a periodic signal with fundamental period
Consider a periodic square wave:
x(t) = 1 for |t| < T1
= 0 T1 < |t| < T0/2
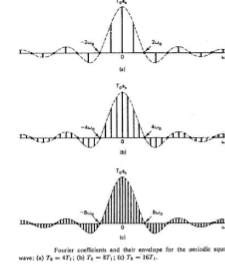
The Fourier series co-efficient is
Ak = 2 sin(kwoT1)
k wo T0
To. Ak = 2 sin(wT1) | w=kw0
w
Discrete Fourier Transform
The discrete-time Fourier transform (DTFT) or the Fourier transform of a discrete–time sequence x[n] is a representation of the sequence in terms of the complex exponential sequence ejωn.
The DTFT sequence x[n] is given by
X(w) =  e-jwn ---------------(1)
Here X(w) is a complex function of real frequency variable w and can be written as
X(w) = Xre (w) + j X img(w)
Where Xre (w), j X img(w) are real and Imaginary parts of X(w)


And | X(w)| can be represented as

Inverse Discrete Fourier Transform is given by

Problems:
Find the four-point DFT of the sequence
x(n) = {0,1,2,3}
Here N=4. W40 = e-j2πn/4 = e-j π/ 2 = cos 0 – j sin = 1 for n=0
W41 = e-j2 π/4 = cos π/2 – j sin π /2 = -j
W42 = e-j π = cos π – j sin π = -1
W43 = e-j2.3 π/4 = cos 3 π/2 – j sin 3 π/2 = j
For k=0
X(k) =  e-j2 π nk/N
X (0) =
X (0) = x (0) + x (1) +x (2) + x (3) = 0 +1+2+3 = 6
X (1) =  e-j2 π nk/N
X (1) =  e-j2 π n/4
= x (0) e0 + x (1) e –j2 π /4+ + x (2) e-j4 π/4+ x (3) e- j 6 π/4
= 0 + 1 –j + 2( -1) + 3(j)
= -2+ 2j
X (2) =  e-j2 π n2/4
X (2) =  e-j π n
X (2) = x (0) 1+ x (1) e-j π + x (2) e-j2 π + x (3) e-j3 π
X (2) = -2
X (3) =  e-j2 π n3/4
X (3) = x (0) e0 + x (1) e-j3 π/2 + x (2) e-j3 π + x(3) e-j9 π/2
X (3) = -2-2j.
DFT = {6, -2+2j, -2, _2-2j}
Properties of Fourier Transform
Linear Property
If x(t) -> X(w)
Y(t) -> Y(w) then
a x(t) + b y(t) -> a X(w) +b Y(w)
Time Shifting Property
If x(t)⟷F. TX(ω)
Then Time shifting property states that
x(t−t0) ⟷F. T e−jω0t X(ω)
Frequency Shifting Property
If x(t)⟷X(ω)
Then frequency shifting property states that
Ejω0t.x(t)⟷X(ω−ω0)
Time Reversal Property
If x(t)⟷X(ω)
Then Time reversal property states that
x(−t) ⟷X(−ω)
Differentiation Property
If x(t)⟷X(ω)
Then Differentiation property states that
Dx(t)dt⟷jω.X(ω)
dnx(t)dtn⟷(jω) n.X(ω)
Integration Property
Integration property states that
∫x(t)dt⟷1jω X(ω)
Then
∭...∫x(t)dt⟷(jω) n X(ω)
Multiplication and Convolution Properties
If x(t)⟷X(ω)
y(t)⟷Y(ω)
Then multiplication property states that
x(t). y(t)⟷X(ω)∗Y(ω)
And convolution property states that
x(t)∗y(t)⟷1/2πX(ω). Y(ω)
Key takeaway
Operation | x(t) | X() |
Scalar multiplication Addition Conjugation Duality Scaling (a real) Time shifting Frequency shifting (  Time convolution Frequency convolution Time differentiation Time integration |            |            |
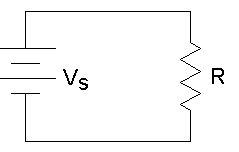
The power for above circuit with R=1Ω is given as
P= 
For R=1Ω
P=V2(t)=I2(t)
This is known as normalized power.
Total energy E= dt Joules
E=
Energy of periodic signal is always infinite.
Now calculating power P=
P= dt
dt
P= dt Watts
Key takeaway:
Power for Non-periodic signal is always zero.
A continuous time signal can be represented in its samples and can be recovered back when sampling frequency fs is greater than or equal to the twice the highest frequency component of message signal.
That is
Fs ≥ 2fm-------------------------(1)
Proof:
Consider a continuous time signal x(t). The spectrum of x(t) is a band limited to fm Hz that is. The spectrum of x(t) is zero for |ω|> ωm.
Sampling of input signal x(t) can be obtained by multiplying x(t) with an impulse train δ(t) of period Ts. The output of multiplier is a discrete signal called sampled signal which is represented with y(t) in the following diagrams:

Fig 9 Sampled Signal
The sampled signal takes the period of impulse. The process of sampling can be explained by the following mathematical expression:
Sampled signal y(t)=x(t). δ(t)......(1)
The trigonometric Fourier series representation of δδ(t) is given by
 = a0 +
  n cos nwst + bn sin n wst) ------------------(2)
Where
a0 = 1/Ts  = 1/Ts δ (0) = 1/Ts -----------------------------(3)
An = 2/Ts  cos nws dt = 2/Ts δ (0) cos n ws .0 = 2/T ----------(4)
Bn = = 2/Ts  sin ws t dt = 2/Ts δ (0 sin n ws =0 ---------------------(5)
Substitute above values in equation 2.
δ(t) = 1/Ts +  cos nws t +0)----------------------------(6)
y(t) = x(t) [ 1/Ts +  cos nws t ] -----------------------------(7)
= 1/Ts [ x(t) + 2  nwst ]--------------------------(8)
y(t) = 1/Ts [ x(t) + 2 cos wst x(t) + 2 cos 2wst x(t) + 2 cos 3wst x(t) +……………… (9)
Taking Fourier Transform on both sides we get
Y(w) = 1/Ts [ X(w) + X (w –ws) + X (w + ws) + X (w – 2ws) + X (w +2ws) + …….]
Y(w) = 1/Ts  where n= 0, ±1, ±2, ±3………….
To reconstruct x(t), you must recover input signal spectrum X(ω) from sampled signal spectrum Y(ω), which is possible when there is no overlapping between the cycles of Y(ω).
Possibility of sampled frequency spectrum with different conditions is given by the following diagrams:
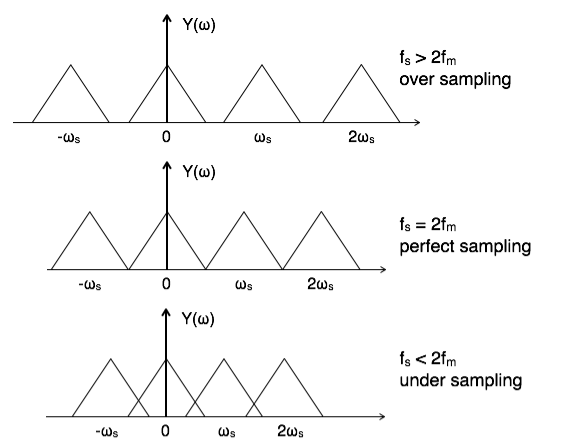
Fig 10 Sampled Signal with conditions
The overlapped region in case of under sampling represents aliasing effect, which can be removed by
- Considering fs >2fm
- By using anti-aliasing filters.
When fs =2fm it is called Nyquist criteria
Problem:
Shown in figure below is a system in which the sampling signal is an impulse train with alternating sign

(a)
The sampling signal p(t), the Fourier Transform of the input signal x(t) and the frequency response of the filter are shown below:
(b)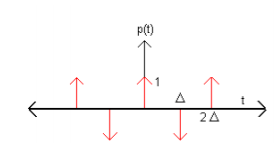
(c) 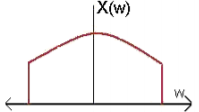
- WM Wm
(d)
Find:
a) For  < π / 2wM sketch the Fourier transform of xp(t) and y(t).
b) For,  < π / 2wM determine a system that will recover x(t) from xp (t) and another that will recover x(t) from y(t).
c) What is the maximum value  in relation to wM for which x(t) can be recovered from either xp(t) or y(t)?
Solution
As xp(t) = x(t) p(t)
By dual of convolution theorem, we have Xp(w) = X(w) P(w)
So, we first find the Fourier Transform of p(t) as follows:
The Fourier Transform of a periodic function is an impulse train at intervals of. Strength of impulse at being:
Ck= π / 
 ej 2π Kt /
  dt ------------(1)
= π /  (1- ej 2π Kt /
 = π /
= π /  ( 1 – e jk π) -------------------(2)
= π /  ( 1 – (-1) k) ------------(3)
Thus P(w) =
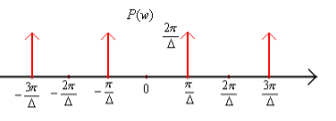
Thus, we sketch Xp(w) and Y(w) as

Which is equal to

To recover x(t) from xp(t):
Modulate xp(t) with cos (π/ . t)
. t)
Cos (π/ . t) has a spectrum with impluses of equal strength at -π/
 and π/
Thus, the new signal will have copies of the original spectrum (modulated by a constant of-course) at all even multiples of π/ .
.
Now an appropriate Low-pass filter can extract the original spectrum!
To recover x(t) from y(t):
Here too, notice from the figures that modulation of cos (π/ . t) with will do the job. Here too, the modulated signal will have copies of the original spectrum at all even multiples of.
π/ .
.
So long as adjacent copies of the original spectrum do not overlap in Xp(w) theoretically one can reconstruct the original signal. Therefore, the condition is:
2wM < 2π/ ---
---  < π/ w M
Types of Sampling
- Ideal Sampling
Impulse sampling or ideal sampling can be performed by multiplying input signal x(t) with impulse train y(t) =  (t – nTs) of period T.
The amplitude of impulse changes with respect to amplitude of input signal x(t). The output of sampler is given by
y(t)=x(t)×y(t) ---------------------(1)
=x(t)× impulse train--------------------(2)
=x(t)×  (t – nTs) -------------------------(3)
y(t) = yδ(t) =  (t – nTs) --------------------------(4)
To get the spectrum of sampled signal, consider Fourier transform of equation (4) on both sides
Y(ω)= 1/Ts  ) ---------------------------------------(5)
This is called ideal sampling or impulse sampling.

Natural Sampling
Natural sampling is similar to impulse sampling, except the impulse train is replaced by pulse train of period T.
Multiplying x(t) by pulse train  )
)
The output of sampler is
y(t)=x(t)×pulse train
=x(t)×p(t) -----------------------------(1)
=x(t)×  -----------------------(2)
The exponential Fourier series representation of p(t) can be given as
p(t) =  n e jnwst -----------------------------(3)
=  n e j2πfst -------------------------------(4)
Where Fn = 1/T  e –jnwst dt --------------------------(5)
= 1/TP (nws)
Substitute Fn in equation (3)
p(t) =  P(nws) ejnwst ------------------------------------(6)
= 1/T  ) ejnwst -------------------------------------------(7)
y(t) = x(t) x p(t)
= x(t) x 1/T  ) ejnwst ------------------------------(8)
y(t) = x(t) x 1/T  ejnwst --------------------------(9)
y(t) = 1/T  x(t) ejnwst --------------------------------------(10)
Consider Fourier Transform on both sides
F.T [y(t)] = 1/T  F.T [x(t) ejnwst ] ------------------------------(11)
F.T [x(t) ejnwst ] = X(w – nws) -----------------------------(12)
Y(w) = 1/T  X(w – nws) ----------------------------------(13)
Natural sampling is similar to impulse sampling, except the impulse train is replaced by pulse train of period T.

Fig 11 Natural Sampling
Flat Top Sampling
At the time of transmission, noise is introduced at top of the transmission pulse which can be easily removed if the pulse is in the form of flat top.
Hence, the top of the samples are flat that is they have constant amplitude. Hence, it is called as flat top sampling or practical sampling. Flat top sampling makes use of sample and hold circuit.

Fig 12 Flat Top Sampling
The sampled signal can be obtained by convolution of rectangular pulse p(t) with ideally sampled signal say yδ(t) as shown in the diagram:

Fig 13 Pulse after convolution
To get the sampled spectrum consider Fourier transform on both sides.
Y[w] = F.T [ P(t) x y δ(t)]
By convolution property
Y[w] = P(w) Y δ (w)
Nyquist Rate
It is the minimum sampling rate at which signal can be converted into samples and recovered back without distortion.
Nyquist rate fN = 2fm hz
Nyquist interval = 1/fN = 1/2fm seconds.
Aperture effect
- The amplitude of the flat top signal must be constant, but sometimes it is not constant due to the high frequency roll off of the sampling signal.
- This results in the attenuation in the high frequency part of the message spectrum.
- Thus, the sampled signal in the flat top sampling consists of attenuated high frequency components and this effect is known as Aperture effect.
- Aperture effect can be improved by selecting value of pulse width τ to be very small and by using equalizer circuit.
If the waveform is under sampled (when. Fs < 2B) then the signal at the output of the filter will be different from the original signal spectrum This results in aliasing.
This implies that whenever the sampling condition is not met, an irreversible overlap of the spectral replicas is produced then there will be spectral overlap in the sample.
Examples
The continuous-time signal x(t) = cos(200πt) is used as the input for a CD converter with the sampling period 1/300 sec. Determine the resultant discrete-time signal x[n].
Solution:
We know,
X[n] =x(nT)
= cos(200πnT)
= cos(2πn/3) , where n= -1,0,1,2……
The frequency in x(t) is 200π rad/s while that of x[n] is 2π/3.
Determine the Nyquist frequency and Nyquist rate for the continuous-time signal x(t) which has the form of:
X(t) = 1+ sin(2000πt) + cos (4000πt)
Solution:
The frequencies are 0, 2000π and 4000π.
The Nyquist frequency is 4000π rad/s and the Nyquist rate is 8000π rad/s.
Consider an analog signal 
Find the Nyquist rate?
Solution.
The frequency in the analog signal

The largest frequency is

The Nyquist rate is

The analog signal 
- What is the Nyquist rate for this signal?
- Using a sampling rate
 . What is discrete time signal obtained after sampling?
 - What is analog signal
 we can reconstruct from the samples if we use ideal interpolation?
Solution.
- The frequency of the analog signal are


- For


For  ,the folding frequency is
Hence  is not effected by aliasing
 Is changed by the aliasing effect
 Is changed by the aliasing effect
So that normalizing frequencies are

The analog signal that we can recover is

Which is different than the original signal 
For 
- Find the minimum sampling rate required to avoid aliasing.
- If
 , what is the discrete time signal after sampling?
 - If
 , what is the discrete time signal after sampling?
 - What is the frequency F of a sinusoidal that yields sampling identical to obtained in part c?
Solution. a. 
The minimum sampling rate is

And the discrete time signal is

b. If  , the discrete time signal is

c. If Fs=75Hz , the discrete time signal is

d. For the sampling rate 
 in part in (c). Hence

So, the analog sinusoidal signal is


Suppose a continuous-time signal x(t) = cos (Ø0t) is sampled at a sampling frequency of 1000Hz to produce x[n]: x[n] = cos(πn/4)
Determine 2 possible positive values of Ø0, say, Ø1 and Ø2. Discuss if cos(Ø1t) or cos(Ø2t) will be obtained when passing through the DC converter.
Solution:
Taking T= 1/1000s
Cos(πn/4) =x[n] = x(nT) = cos (Ø0n/1000)
Ø1 is easily computed as 
Ø1 = 250π
Ø2 can be obtained by noting the periodicity of a sinusoid:
 Ø2n/1000)
Ø2 = 2250π
Band Limited Signal
Let us consider a band-limited signal x(t) having a Fourier Transform X(f). Let the interval for which X(f) is non-zero be -B f B.
Then x(t) =  ej2π ft df -------------------(1) converges.
The RHS of the above equation is differentiable with respect to t any number of times as the integral is performed on a bounded domain and the integrand is differentiable with respect to t.
Further, in evaluating the derivative of the RHS, we can take inside the integral.
Dx(t)/dt =  X(f) e
  df ----------(2)
A signal is band-limited when the amplitude of the spectrum goes to zero whenever its frequency crosses the allowable limits. Thus, its Fourier transform is non-zero only for a finite frequency interval. A finite number of harmonics represents a band-limited signal.
Time Limited Signal
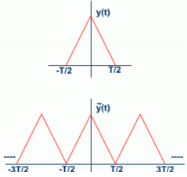
Consider first a signal y(t) that is time-limited, i.e. it is non-zero only in [-T/2, T/2]. Its Fourier transform Y(f) is given by:
Y(f) =  e- j2πft dt ----------------------(1)
 (t) e- j2πft dt -------------------------(2)
Where y^(t) is the periodic extension of y(t).
Band pass signal
Bandpass signals can also be represented by their sampled values. Consider a bandpass signal whose Fourier transform occupies the frequency
Intervals fc−W<f<fc+W, as shown in Figure.
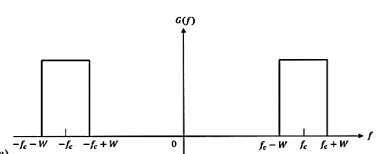
Fig Band pass signal
In other words, the bandpass signal has non-negligible frequency content around fc with a bandwidth of 2W. It can be shown that the minimum sampling rate required for such a bandpass signal is 2fc+Wm, where fc+W represents the signal’s highest frequency component, and m is the largest integer not exceeding the ratio fc+W2W. Figure, in which the shaded regions represent the permissible sampling rates for a bandpass signal, indicates that regardless of passband location, the minimum permissible sampling rate necessary for signal reconstruction always lies between 4W and 8W.
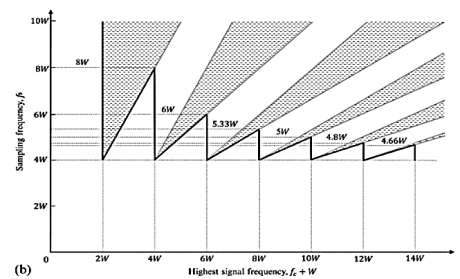
Fig Sampled Signal
Equivalently, the minimum sampling rate is greater than twice the signal bandwidth, but less than four times the signal bandwidth. When we have fc≫W, the minimum permissible sampling rate then approaches twice the signal bandwidth 2W. Another way of sampling a bandpass signal of bandwidth 2W is to decompose it into two lowpass signals (i.e., the in-phase and quadrature components), each with a bandwidth of W. Each of these may be sampled at a minimum rate of 2W samples per second, thus resulting in an overall minimum sampling rate of 4W samples per second.
References:
[1] John G.Proakis, M. Salehi, Communication Systems Engineering, 2nd ed. New
Delhi, India. PHI Learning Private Limited, 2009.
[2] R.P Singh and S.D Sapre, Communication Systems Analog & Digital, 2nd ed. New Delhi, India. Tata McGraw Hill Education Private Limited, 2009.