UNIT 5
AC and DC Fundamentals
Generation of DC voltage :
Direct current is generated by photovoltaic cells and batteries. Direct current generators are rare in major power plants due to the prevalent use of alternating current over direct current in transmission lines. Direct current generation is therefore limited mainly to small-scale generators.
Generation of AC voltage
Consider the stationary coil places inside the uniform magnetic field. The load is connected across the coil with the help of brushes and the slip rings. When the coil rotates in the anticlockwise direction at constant angular velocity ω the electromotive force induces in the coil. The cross-sectional view of the coil at the different position is shown in the figure below.
The magnitude of the emf induced in the coil depends on the rate of the flux cut by the conductor.
The figure below shows that the no current induces in the coil when they are parallel to the magnetic line of forces. i.e., at the position (1), (2) and (3). And the total flux cut by the conductor becomes zero.
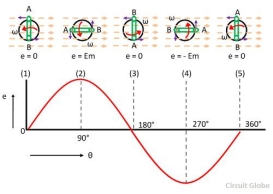
The magnitude of the induces emf becomes maximum when the conductor becomes perpendicular to the magnetic line of force. The conductor cuts the maximum flux at this position.
Waveform
Relation between speed, frequency and pole
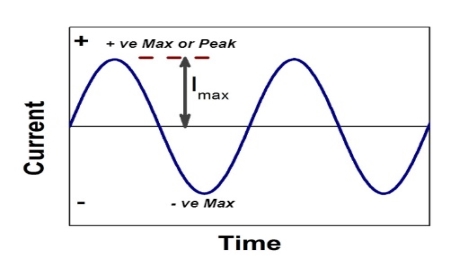
- Instantaneous value: The value of an alternating quantity at a particular instant is known as Instantaneous value.
- Waveform: The graph of Instantaneous values of an alternating quantity plotted against time.
- Cycle: each repetition of set of positive and negative Instantaneous value of an alternating quantity is called as cycle.
- Time period: The time taken by an alternating quantity to complete its on cycle known as time period.
- Frequency: The numbers of cycle completed by an alternating quantity per second known as Frequency.
Measured in cycle/second or that.
6. Amplitude: The maximum value attained by alternating quantity during positive or negative cycle is called as Amplitude.
7. Angular Frequency (w): it is the Frequency expressed in electrical radians per second w = 2 X F or w = 
8. Peat to peak value: the value of an alternating quantity from its positive peak to negative peak

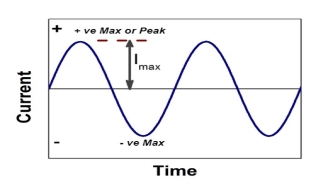
The alternating current can be
Expressed as i = Im Sin 
Im - max value
i = Im Sin wt
Where  = wt
= wt
Alternating voltage can be expressed as V = vm sin wt
- RMS value: Root mean square value
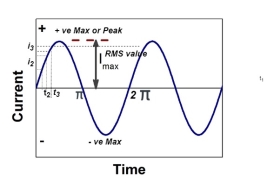
The RMS value of AC current is equal to the steady state DC current that required to produce the same amount of heat produced by ac current provided that resistance and time for which these currents flows are identical.

I rms = 
Direction for RMS value:
Instantaneous current equation is given by
i = Im Sin 
But 
I rms = 
= 
=
=
Solving
=
=
Similar we can derive
V rms=  or 0.707 Vm
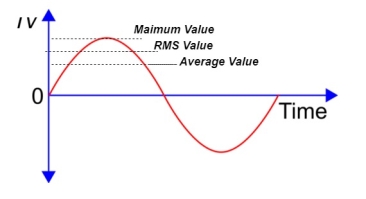
 the RMS value of sinusoidally alternating current is 0.707 times the maximum value of alternating current
- Average Value: Very IMP
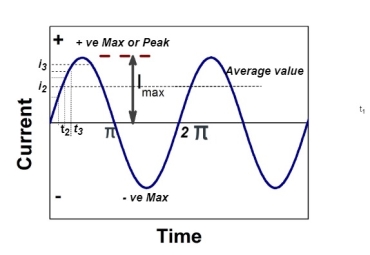
The arithmetic mean of all the value over complete one cycle is called as average value

 =
= 
For the derivation we are considering only hall cycle.
Thus  varies from 0 to ᴫ
i = Im Sin


Solving
We get


Similarly, Vavg=
The average value of sinusoid ally varying alternating current is 0.636 times maximum value of alternating current.
- Peak or krest factor (kp) (for numerical)
It is the ratio of maximum value to rms value of given alternating quantity
Kp = 
 Kp =
Kp = 
 Kp = 1.414
Form factor (Kf): For numerical “It is the ratio of RMS value to average value of given alternating quality”.


Determination of Sinusoidal waveform
- Phases Representation of an Alternating Quantity
- The sinusoidal varying alternating quantity can be represented graphically by a straight line and arrow in the phase’s representation method.
- The length of the line represents magnitude and arrow indicates it direction.
- “The phases are assumed to be rotated in anticlockwise direction with constant Angular speed.”
- One complete cycle of sine wave is represented by one complete rotation of phases as shown below
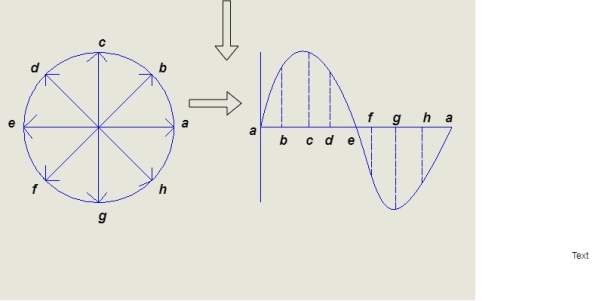
Consider at various position
- At point a the y axis projection is zero

 θ=0
θ=0 
- At point b the y axis projection 0b sin θ

- At point c the y axis projection (0C) represent max value of phase


2. Point D, y axis projection is (0ɖ)

3. At point e, y axis projection is zero

Now at point “ȴ” on words the phases change its direction  cycle also shifts from the half cycle to –v e half cycle.
Determination of non-sinusoidal waveforms:
For non-sinusoidal waveforms
The Fourier series states that any practical periodic function (period T or frequency ωo = 2π/T) can be represented as an infinite sum of sinusoidal waveforms (or sinusoids) that have frequencies which are an integral multiple of ωo.
f(t) = Fo + F1 cos (ωο t+θ1) + F2 cos (2ωο t+θ2) + F3 cos (3ωο t+θ3) + F4 cos (4ωο t+θ4) + F5 cos (5ωο t+θ5) +…………
Usually the series is expressed as a direct term (Ao/2) and a series of cosine terms and sine terms.
f(t) = Ao/2 + A1 cos ωο t + A2 cos 2ωο t + A3 cos 3ωο t + A4 cos 4ωο t + ………… + B1 sin ωο t + B2 sin 2ωο t + B3 sin 3ωο t + B4 sin 4ωο t + …………
f(t) = Ao/2 +  An cosnwot + Bn sin n wot )
Consider a line OA (or phasor as it is called) representing to scale the maximum value of an alternating quantity, say emf i.e., OA = Emax and rotating in counter-clockwise direction at an angular velocity ω radians/second about the point O, as shown in Figure.
The figure shows OA when it has rotated through an angle θ, being equal to ωt, from the position occupied when the emf was passing through its zero value. The projection of OA on Y-axis, OB = OA sin θ = Emax sin ωt = e, the value of the emf at that instant.

Thus, the projection of OA on the vertical axis represents to scale the instantaneous value of emf.
The phase of an alternating current is meant the fraction of the time period of that alternating current that has elapsed since the current last passed through the zero position of reference.
The phase angle of any quantity means the angle the phasor representing the quantity makes with the reference line (which is taken to be at zero degrees or radians).
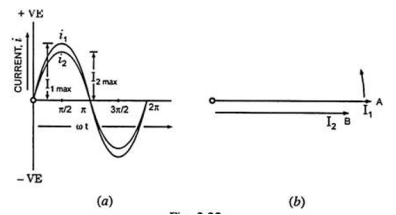
For example the phase angle of current I2, in Figure is (-ɸ).
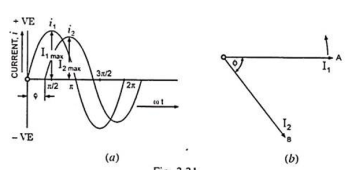
The phase difference is measured by the angular distance between the points where, the two curves cross the base or reference line in the same direction.
The quantity ahead in phase is said to lead the other quantity while the second quantity is said to lag behind the first one.
In Fig. (b) current I1 represented by phasor OA leads the current I2, represented by phasor OB by ɸ or current I2, lags behind the current I1 by ɸ.
The leading current I1 goes through its zero and maximum values first and the current I2 goes through its zero and maximum values after time angle ɸ.
The two waves representing these two currents are shown in fig (a).
If I1 is taken as reference phasor, the two currents can be expressed as:
i1 = I1 max sin ωt
And i2 = I2 sin (ωt – ɸ)
The two quantities are said to be in phase with each other if they pass through zero values at the same instant and rise in the same direction, as shown in Fig.
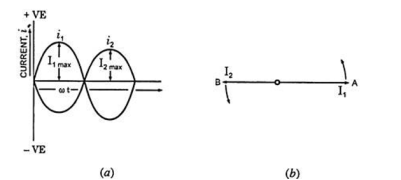
But the two quantities passing through zero values at the same instant but rising in opposite directions, as shown in Fig. Are said to be in phase opposition, i.e., phase difference is 180°. When the two alternating quantities have a phase difference of 90° or π/2 radians they are said to be in quadrature.
References:
- Electronic Devices And Circuits Theory 10th Edition (English, Paperback, Robert L. Boylestad, Louis Nashelsky)
Electronic Principles Textbook by Albert Paul Malvino
How to Diagnose and Fix Everything Electronic, Second Edition Book by Michael Jay Geier
- Principles of Electronics is a 2002 book by Colin Simpson
Starting Electronics Book by Keith Brindley