UNIT – 1
Introduction to Statistics
Concept of Statistics
The word statistics is derived from the Latin word “Status” that means a group of numbers that represent some information of our human interest. In ancient periods, the use of statistics was made to meet the administrative needs of the state. In modern time, the statistics is not only used for administrative of the state alone, also evaluate all those activities in our lives which can be expressed in quantitative terms.
The term “statistics” is defined in two senses: - in singular and in Plural senses.
Firstly, in plural sense, statistics means systematic collection of numerical facts. Secondly in singular sense, the term statistics means the various methods used for collection, analysis and interpretation of numerical facts. It is described as statistical method. In our study we are more concerned with the second meaning of statistics.
Definition
“Statistics is a body of methods for making wise decisions on the face of uncertainty.” —Wallis and Roberts
“Statistics is a body of methods for obtaining and analyzing numerical data in order to make better decisions in an uncertain world.” —Edward N. Dubois
Statistics are numerical statement of facts in any department of enquiry placed interrelation to each other.- Bouly.
The science of Statistics is essentially a branch of applied mathematics and can be regarded as a mathematics applied to observation data.- R.A fisher.
After analyzing the various definitions of statistics, the most proper definition of statistics are as follows:
“Statistics in the plural sense are numerical statements of facts capable of some meaningful analysis and interpretation, and in singular sense, it relates to the collection, classification, presentation and interpretation of numerical data.”
Nature of Statistics
Statistics are numerical statements of facts capable of some meaningful analysis and interpretation, and in singular sense, it relates to the collection, classification, presentation and interpretation of numerical data. It is the science of data collection and analysis.
The nature of statistics can be enumerated as under:
Key Takeaways:
Statistics has become indispensable in every area to day. There is hardly any field where statistics didn’t enter. Statistics is used right from the education till in aeronautical engineering. However, a few identified areas can be depicted as regards use of statistics:
Key Takeaways:
Limitation of statistics
Key Takeaways:
Statistical enquiry refers to statistical investigation where the statistical investigator requires taking the help of an investigator who with the help of enumerator which supposed to gather data. The respondents give information which is inputs to data collection. Statistical investigations test statements that may be true or false after evaluation. These statements are known as hypothesis. Before landing into investigation, the statistical investigator needs to do lot of planning for the statistical inquiry. There are certain preparations to be noted in statistical enquiry which may be as follows:
Key Takeaways:
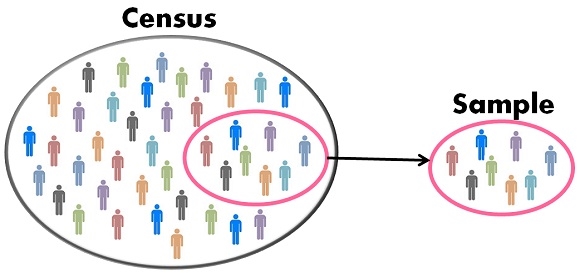
Both census and sampling provide information about a population. In census, each and every unit of population is studies. While in sampling small units are studied which represents the population. Government uses both census and sampling data for various purposes like planning, development programs, etc.
Census method
A well-organized procedure of gathering, recording and analyzing information regarding the members of the population is called a census. Under method census each and every unit of the universe is included in the collection of data. Huge amount of finance, time and labor are required for gathering information. This method is useful to find out the ratio of male to female, the ratio of literate to illiterate people, the ratio of people living in urban areas to the people in rural areas.
Merits
Demerits
Sampling method
The sample is a small segment considered for study which represents the standard of entire population. The selection of sample should give justifiable conclusion about the whole population. When the population size is very large and it is difficult to consider all members then sampling method is used. Under this method selection of appropriate representative sample is utmost important. On the basis of data collected from sample, conclusion is drawn for the whole population.
Key Takeaways:
Types of sampling method
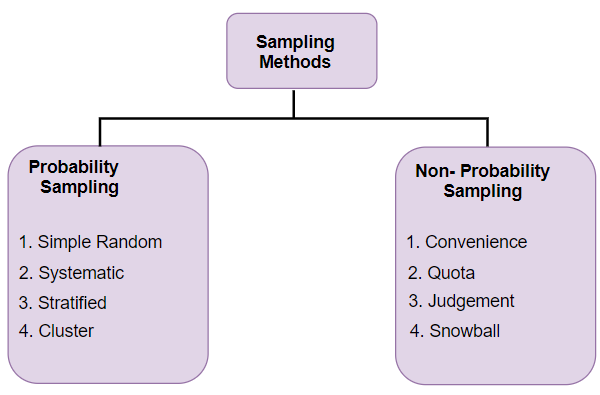
- It is also called as random sampling
- Random sampling is one of the simplest sampling techniques in which each sample have an equal chance of being chosen from the population
- It is an unbiased representation of the population
Types of random sampling
2. Non random sampling –
Types of non-random sampling
Key takeaways:
Classification of data is the process of arranging the data into homogenous groups according to their common characteristics. Raw data cannot be easily understood and not fit for analysis and interpretation. Therefore, arrangement of data helps the user in comparison and analysis.
Example- population of a state can be grouped according to sex, age, etc
Definition
“Classification is the process of arranging data into sequences according to their common characteristics or separating them into different related parts.” - Prof. Secrist
Objectives of data classification
Types of classification
Ex- production of food grains are classified in different states in India
S.No | Name of states | Total food grains (000’ tones) |
1 | Andhra Pradesh | 1093.00 |
2 | Bihar | 12899.09 |
3 | Karnataka | 1834.70 |
4 | Punjab | 41289.00 |
5 | Orissa | 3600 |
2. Chronological classification – classification of data on the basis of time (like months, years, etc) of their occurrence are called chronological classification. This type of classification is suitable for data which takes place in course of time such as population, production, sales, etc.
Ex – profit of a company from 2001 to 2005
S.No | Year | Profits (in 000 Rs) |
1 | 2001 | 77 |
2 | 2002 | 88 |
3 | 2003 | 89 |
4 | 2004 | 94 |
5 | 2005 | 99 |
3. Qualitative classification – under this classification, the data are classified on the basis of some attributes or quality such as sex, color, literacy, honesty, intelligence, religion, etc. In this the attributes cannot be measured. This sort of classification is known as descriptive classification.
For example, Population can be divided on the basis of marital status as married or unmarried etc.
4. Quantitative classification – quantitative classification states that classification of data according to some characteristics that can be measured such as height, weight, income, sales, profit, etc.
Ex – students are classified according to weights
S.No | weight | No. of students |
1 | 30-40 | 77 |
2 | 40-50 | 60 |
3 | 50-60 | 50 |
4 | 60 - 70 | 20 |
5. Alphabetical classification – when data are arranged according to alphabetical order is called alphabetical classification
Ex – state wise classification of population in alphabetical order
S.No | Name of states | Population |
1 | Andhra Pradesh | 157 |
2 | Bihar | 150 |
3 | Karnataka | 200 |
4 | Punjab | 700 |
5 | Orissa | 450 |
Tabulation is a systematic & logical presentation of numeric data in rows and columns, to facilitate comparison and statistical analysis. The method of placing organized data in tabular form is known as tabulation. Tabulation simplifies complex data and facilitates comparison.
Definition
“Table involves the orderly and systematic presentation of numerical data in a form designed to elucidate the problem under consideration” – According prof. L.R Connor
“Table in its broadest sense is an orderly arrangement of data in column and rows” – According to Prof M.M.Blaire
Objectives of tabulation
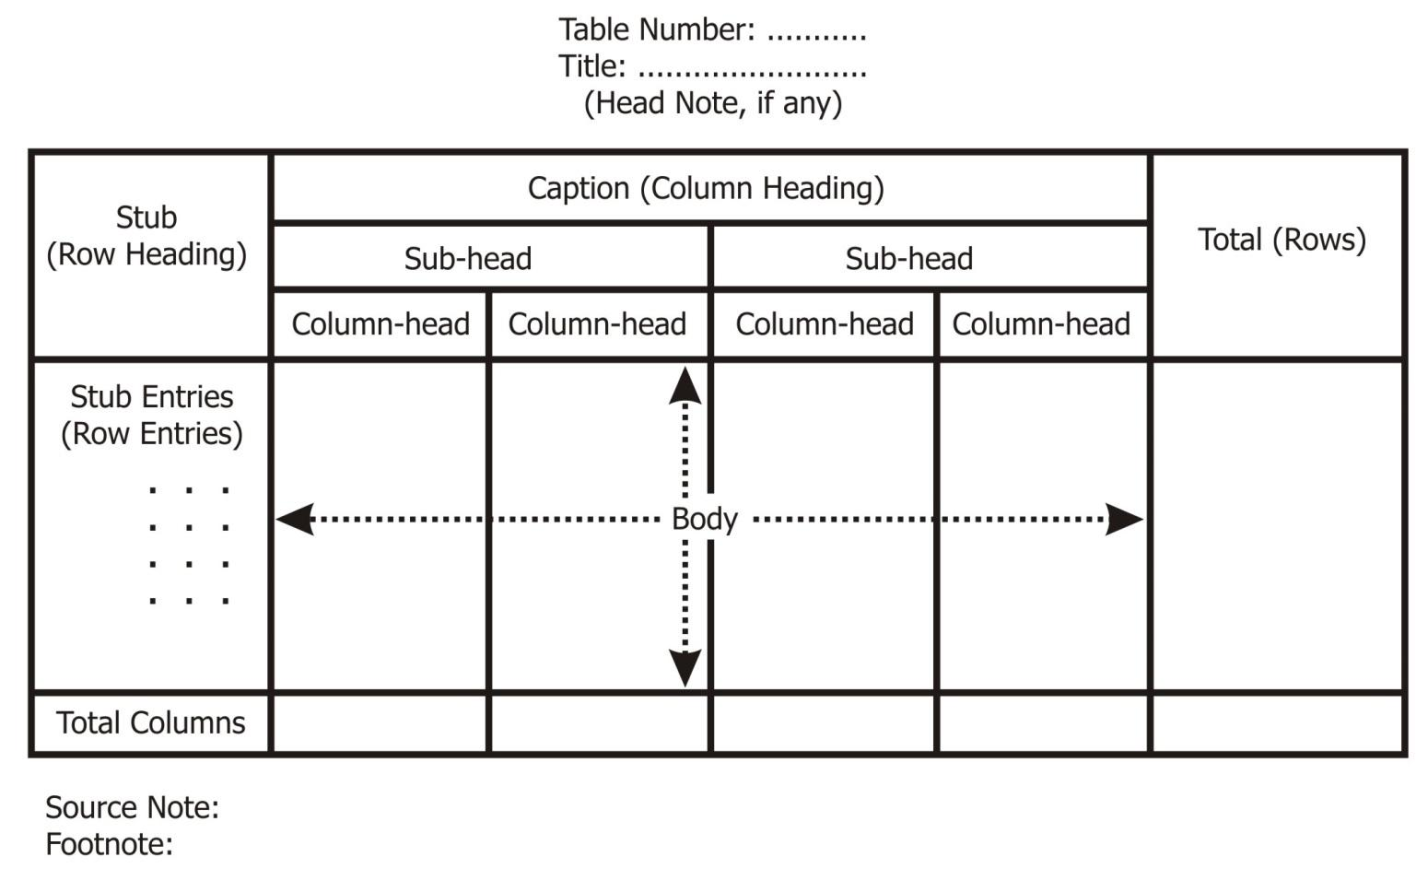
Parts of table
Table number |
|
Title of the table |
|
Caption |
|
Stub |
|
Body |
|
Head note |
|
Source note |
|
Footnote |
|

Types of tabulation
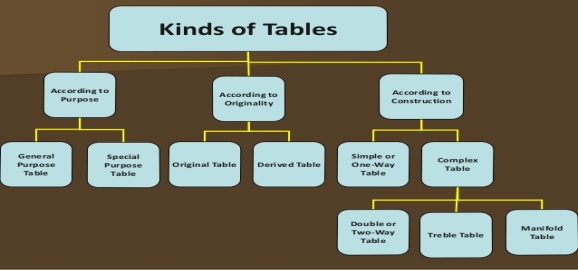
2. According to originality
3. According to construction
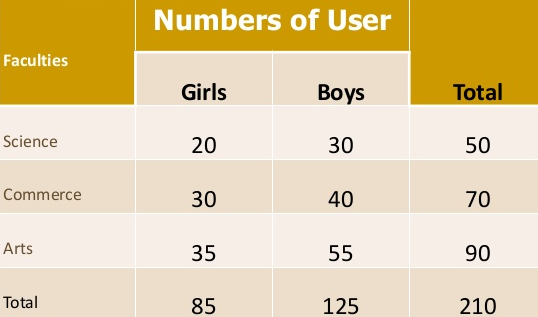
Faculty wise library user
The complex tables are
Two-way table – Under this the variable under study is divided into two characteristics

Three-way table - Under this the variable under study is divided into three characteristics
Manifold table - Under this the variable under study is divided into large number of characteristics.
Key Takeaways:
REFERENCE: