UNIT III
Funds flow and cash flow analysis

Cash Flow and Fund Flow: Overview
There are generally four types of financial statements in accounting: the balance sheet, the income statement, the cash flow statement, and the cash flow statement. Let's take a closer look at the last two.
In financial accounting, a cash flow statement refers to the change in a company's cash and equivalents from one period to the next. However, the flow of money has two different implications. One is for accounting purposes and the other is for investment purposes.
Cash flow
Cash flows are recorded on the company's cash flow statement. This statement (one of the company's key statements) shows the actual inflows and outflows of cash (or cash-like assets) from its investment activities. This is a mandatory report under generally accepted accounting principles (GAAP)
This is different from the income statement, which records data and transactions that may not be fully realized, such as uncollected income and unpaid income. On the other hand, this information is already entered in the cash flow statement, which gives you a more accurate picture of how much cash your company is generating.
The cash flow statement allows you to classify cash flow sources into three different categories:
Specimen of Cash Flow
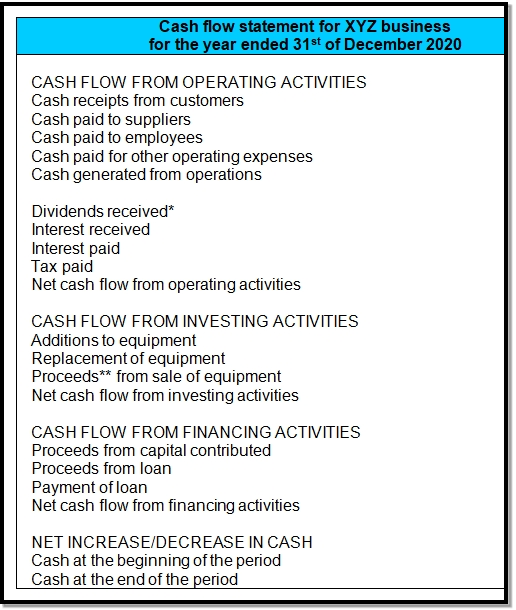
A company receives an inflow of cash income from selling goods, providing services, selling assets, earning interest on investments, renting, acquiring loans, or issuing new shares. Cash outflows can result from purchases, loan repayments, business expansions, payroll payments, or dividend distributions.
Investors and lenders have liquidity and cash on hand because the Securities and Exchange Commission (SEC) requires all listed companies to use accrual accounting and largely ignores the actual balance of cash on hand. It relies on cash flow statements to evaluate flow management. It's a more reliable tool than the metrics companies use to dress up their earnings, such as interest, taxes, depreciation, and earned before interest (EBITDA)
Fund Flow
On the accounting side, GAAP required a cash flow statement between 1971 and 1987. 3 If requested, the cash flow statement is primarily an accountant's change in the company's net working capital, or assets and liabilities over a period of time. Much of this information is currently available on the cash flow statement.
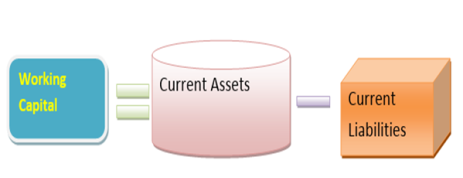
For investment purposes, the flow of funds does not give the company a cash position. If your company wants to do that, create a cash flow statement.
The flow of money emphasizes the cash-only movement. In other words, it reflects the net movement after investigating the inflows and outflows of monetary funds. It also identifies activities that may deviate from the character of the company, such as irregular expenses.
The use of the income statement in investments is more useful today. Investor sentiment is associated with different asset classes and can be measured. For example, a positive stock flow suggests that investors are generally optimistic about the economy, or at least the short-term profitability of listed companies.
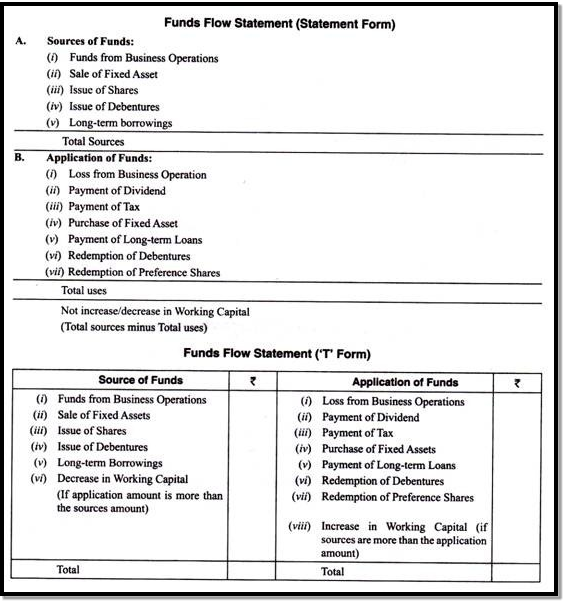
Form of fund flow statement:
You can create a cash flow statement in statement or "T" format. Both formats are shown below:
Main differences
The cash flow statement is an earlier version of the cash flow statement. The cash flow statement is more comprehensive and details the company's multiple cash flows, rather than focusing solely on working capital.
While cash flow statements are most often used to understand a company's liquidity position, fund flow statements are an important tool for investors as they are best suited for long-term financial planning. The cash flow statement can identify the source of cash and its use. The cash flow statement begins by looking at your current cash level and how it leads to your cash balance.
Here, we will explain in detail the difference between cash flow analysis and Fund flow analysis.
1. The concept of a fund refers to the actual or conceptual "cash" in cash flow analysis. However, it means either all financial resources or net working capital in the cash flow analysis.
2. Cash flow analysis deals with real cash or assumed cash-only movements. However, the flow of funds is related to all the items that make up the funds: net working capital. Cash is one of the elements of working assets
3. The cash flow statement only shows the causes of changes in cash and bank balances: cash receipts and payments. The cash flow statement shows the cause of the change in net working capital. This is a flexible device designed to disclose and highlight all significant changes in a company's current assets and current liabilities during the study period.
4. Cash flow analysis is a short-term financial analysis tool, but cash flow analysis is relatively long-term.
5. The income statement is consistent with the actual accounting standards. However, in the cash flow statement, data obtained on an accrual basis is converted to a cash basis.
6. The Fund Flow Statement aggregates funds generated from different sources for different purposes in which they are used. However, the cash flow statement starts with the cash balance at the start and reaches the cash balance at the end by processing it with various sources and uses.
7. In cash flow analysis, changes in various current assets and current liabilities are displayed in a separate statement or schedule of changes in working capital to see net changes in working capital. However, in fund flow analysis, such changes are adjusted to match the cash from operating activities to confirm cash from operating activities.
These were the points of difference between cash flow and cash flow, but both calculations have different advantages and limitations. Nonetheless, a careful analysis of the two has important consequences for the enterprise.
Points of Difference | Cash Flow | Fund Flow |
Meaning
| This represents the inflow and outflow of cash for a specified period of time, and its equivalent. . | It emphasizes the change in the working capital of a company from the end of one period to the end of another. |
Accounting Ways | Cash flows are accounted for only when liquid cash is included in the form of currency or bank transfers. . | The flow of funds is accounted for based on the generation of funds, not the actual payment or collection |
Utility | Cash flows are used to identify the net cash flow of a business over a specific time period. | The use of cash flows extends to an understanding of a company's overall financial situation. |
Business Position | Analysis Cash flow calculations help identify short-term business liquidity positions. | Cash flow calculations help you assess your long-term business position. |
Disclosures Made | All disclosures regarding cash inflows and outflows are made under cash flows. | Funding flows allow disclosure and identification of all sources of funding and their applications. |
Entry in Annual Financial Statements | It is mandatory to include a cash flow statement in the annual financial statements of a particular company. | It is not legally required to include a cash flow statement in the annual financial statements, and companies can do so to build investor confidence or meet investor demands. |
Use in Budgeting | Cash flow statements and analytics help you budget your business cash. | The income statement and analysis are usually useful for a company's regular capital budgeting . |
Comparison:
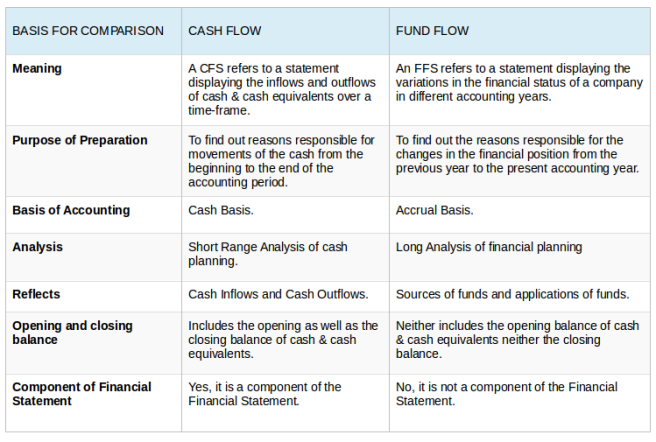
Key takeaways:

Ratio analysis

What is ratio analysis?
Ratio analysis refers to the analysis of financial information that is contained in a company's financial statement. These are primarily used by external analysts to determine various aspects of the business, such as profitability, liquidity and solvency.
Ratio analysis
Analysts obtain data to assess a company's financial performance based on current and historical financial statements. They use the data to determine if a company's financial position is on the rise or down and compare it to other competitors.
Use of ratio analysis
1. Comparison
One use of ratio analysis is to compare a company's financial performance to similar companies in the industry to understand its position in the market. By obtaining financial ratios such as price-earnings ratios from known competitors and comparing them to company ratios, management can identify market gaps and explore competitive advantages, strengths and weaknesses. I can do it. Management can then use that information to make decisions aimed at improving the company's position in the market.
2. Trend line
Companies can also use ratios to see if they are prone to financial performance. Established companies collect data from financial statements over a number of reporting periods. The trends obtained can be used to predict the direction of future financial performance. It can also be used to identify financial disruptions that are expected to be impossible to predict using a single reporting period ratio.
3. Operational efficiency
Company owners can also use financial ratio analysis to determine the degree of efficiency in managing assets and liabilities. Inefficient use of assets such as automobiles, land and buildings brings unnecessary costs to be eliminated. The financial ratio also helps determine if the financial resources are overused or underused.
Ratio Analysis-Financial Ratio Category
There are many financial ratios used in ratio analysis, which fall into the following categories:
1. Current ratio
Quick ratio measures a company's ability to meet its obligations using current assets. If a company is in financial difficulty and unable to pay its debt, it can convert its assets into cash and use that money to settle its pending debt more easily.
Common current ratios include quick ratio, cash ratio, and current ratio. The current ratio is used by banks, creditors, and suppliers to determine if a customer has the ability to meet its financial obligations when it is due.
Current ratio = Current assets / Current liabilities
2. Solvency ratio
The solvency ratio measures a company's long-term financial viability. These ratios compare a company's liability level to its assets, capital, or annual revenue.
The solvency ratio is primarily used by governments, banks, employees and institutional investors.
S. No. | RATIOS | FORMULAS |
1 | Current Ratio | Current Assets/Current Liabilities |
2 | Quick Ratio | Liquid Assets/Current Liabilities |
3 | Absolute Liquid Ratio | Absolute Liquid Assets/Current Liabilities |
3. Profitability ratio
Profitability ratio measures a company's ability to make a profit when compared to the associated costs. A higher rate of return than the previous financial reporting period indicates that the business is improving financially. You can also compare the profitability ratio to the ratio of similar companies to determine the profitability of your business compared to your competitors.
Examples of important rates of return include return on equity, return on total assets, rate of return, gross rate of return, and return on capital used.
S. No. | RATIOS | FORMULAS |
1 | Gross Profit Ratio | Gross Profit/Net Sales X 100 |
2 | Operating Cost Ratio | Operating Cost/Net Sales X 100 |
3 | Operating Profit ratio | Operating Profit/Net Sales X 100 |
4 | Net Profit Ratio | Operating Profit/Net Sales X 100 |
5 | Return on Investment Ratio | Net Profit After Interest And Taxes/ Shareholders Funds or Investments X 100 |
6 | Return on Capital Employed Ratio | Net Profit after Taxes/ Gross Capital Employed X 100 |
7 | Earnings Per Share Ratio | Net Profit After Tax & Preference Dividend /No of Equity Shares |
8 | Dividend Pay Out Ratio | Dividend Per Equity Share/Earning Per Equity Share X 100 |
9 | Earning Per Equity Share | Net Profit after Tax & Preference Dividend / No. of Equity Share |
10 | Dividend Yield Ratio | Dividend Per Share/ Market Value Per Share X 100 |
11 | Price Earnings Ratio | Market Price Per Share Equity Share/ Earning Per Share X 100 |
12 | Net Profit to Net Worth Ratio | Net Profit after Taxes / Shareholders Net Worth X 100 |
4. Efficiency ratio
Efficiency ratio measures how well a company uses its assets and liabilities to generate sales and make a profit. They calculate inventory usage, machine usage, debt turnover, and capital usage. These ratios are important. Because when the efficiency ratio improves, the business will generate more revenue and profits.
Key efficiency ratios include asset turnover, inventory turnover, accounts payable turnover, working capital turnover, fixed asset turnover, and receivable turnover.
Typical efficiency ratios are:
Asset turnover = sales / average total assets
2. Inventory turnover measures the number of times a company's inventory is sold and exchanged over a specific time period.
Turnover Stock = cost of sales / average stock
3. Accounts receivable turnover measures the number of times a company can convert accounts receivable into cash over a period of time.
Accounts Receivable Turnover = Net Loan Sales / Average Accounts Receivable
4. Sales days in inventory ratio measure the average number of days a company holds inventory before selling it to its customers.
Number of sales days in inventory ratio = 365 days / inventory turnover
5. Coverage rate
Coverage measures a company's ability to meet its obligations and other obligations. Analysts can use coverage rates over several reporting periods to depict trends in predicting the future financial position of a company. High coverage means that companies can more easily handle debt and related obligations.
Key coverage rates include debt coverage, interest coverage, fixed rate coverage, and EBIDTA coverage.
Coverage Interest ratio = operating income / interest expense
2. Debt repayment coverage reveals how easy it is for a company to pay its debt.
Debt repayment coverage = operating income / total debt repayment
6. Market outlook ratio
Market outlook ratios help investors predict how much they will earn from a particular investment. Revenues can take the form of higher stock prices or future dividends they may expect to earn.
Key market outlook ratios include dividend yield, earnings per share, price earnings ratio, and payout ratio.
Book value ratio per share = (shareholders' equity – preferred stock) / total number of common shares issued
2. Dividend yield is a measure of the amount of dividends attributable to shareholders relative to the market value per share.
Yield Dividend = Dividend per share / stock price
3. Earnings per share ratio measures the amount of net income earned for each issued share.
Earnings per share = Net income / Total number of issued shares
4. Price earnings ratio compares a company's stock price to earnings per share.
Earnings Price ratio = stock price / earnings per share
Key takeaways:
Cash flow as per accounting standards:

The applicability of the income statement is defined under the businesses Act 2013. As defined by the law, financial statements include:
I. record
ii. Profit and Loss Account / Balance Account
iii. Income statement
iv. Statement of changes in shareholders' equity, etc.
v. Annotation
Therefore, the income statement must be prepared by all companies, but the law also specifies certain categories of companies that are exempt from an equivalent.
For eg: One Person Company (OPC), Small Company, and Dormant Company.
2. Cash and cash equivalents
Cash equivalents are held by a corporation to satisfy its short-term cash commitment on behalf of an investment or other such purpose. For investments that qualify as cash equivalents:
1. The investment must be easily convertible to cash.
2. Must be exposed to a really low level of risk regarding changes in its value.
Therefore, an investment is taken into account a debt instrument as long as such investment features a short maturity within 3 months from the date of acquisition.
The AS 3 income statement states that movements between items that form a part of cash or cash equivalents should be excluded. Because these are a part of a company's cash management, not business, financing, and investment activities.
Cash management consists of investing surplus take advantage cash equivalents.
3. View income
The income statement must represent the cash flows within the amount during which they're categorized as follows:
A. Sales activities
B. Investment
C. Financing activities
Companies got to prepare and present cash flows from operations, financing, and investment activities during a way that suits their business.
Grouping activities provides information that permits users to assess the impact of such activities on the company's overall financial position and to assess the worth of money and cash equivalents.
A. Sales activities
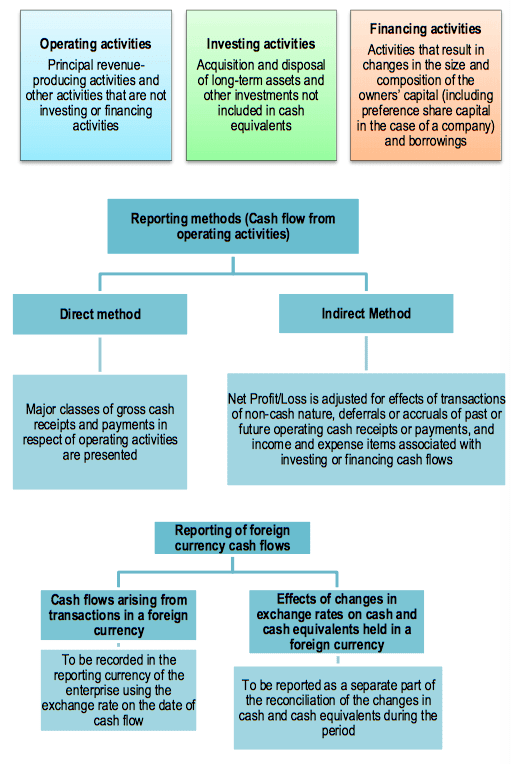
Cash flow from operating activities comes primarily from activities that generate the company's main revenue. For example:
B. Investment activities
Cash flows from investing activities represent outflows for cash flows and resources aimed toward generating future income. For example:
C. Financing activities
Financing activities are activities that change the composition and size of the owner's capital and therefore the company's debt. For example:
4. Income from operating activities
Companies should report cash flows from operating activities using:
1. Direct method-if all major classes of money receipt and payment are presented. Or
2. Indirect method – If net or loss is adjusted as follows:
a) Impact of non-cash transactions like depreciation, deferred taxes and provisions.
b) Income or deferral of future or past operating cash income or payments.
c) Expenses or income related to income financing or investment.
5. Income from investment and financing activities
An entity must separately record all major classes of money receipts and payments resulting from financial and investment activities, except people who got to be reported on a net basis.
Cash flows from any of the subsequent operating, financing or investing activities could also be reported in net form.
Cash flows from each of the subsequent activities of a financial company could also be reported in net form.
B. Foreign currency cash flow
Cash flows from transactions in foreign currencies should be recorded in the company's reporting currency using the following methods:
Foreign currency amount * FX rates the exchange rate between the cash flow date report and the foreign currency.
If the result is similar to using the cash flow date rate, you can use a rate that is close to the actual rate.
The impact of exchange rate fluctuations on cash and cash equivalents held in foreign currencies must be reported as a separate and separate part of the adjustment of changes in cash and cash equivalents during the period.
6. Special items, dividends and profits
Cash flows related to special items should be categorized as originating from operating, financing, or investing activities, as appropriate and clearly disclosed.
Cash flows from receiving and paying dividends and interest must be disclosed separately. For financial companies, cash flows from receiving and paying dividends and interest should be categorized as cash flows from operating activities.
For other companies, cash flows from interest expense should be categorized as cash flows from financing activities, while dividends and interest received should be categorized as cash flows from investing activities.
7. Tax on income
Income tax cash flows must be disclosed separately and reported as cash flows from operating activities unless they may be explicitly related to investment and financing activities.
8. Acquisition and disposal of business divisions including subsidiaries
Total cash flows from acquisitions and disposals of business units, including subsidiaries, must be viewed as investment activity and reported separately.
An entity must provide a complete of the subsequent for both acquisitions and disposals of other business units, including subsidiaries, within the subsequent period:
(A) Total purchase or disposal
(B) Purchase or disposal price discharged as cash and cash equivalents
9. Non-cash transaction
Financing and investment transactions that do not require cash or cash equivalents should not be included in the cash flow statement. These transactions must be presented elsewhere in the financial statements in a way that provides relevant information regarding such financing and investment activities.
10. Disclosure
An entity must disclose the amount of substantial unusable cash and cash equivalents it holds, along with management commentary.
Commitments that may result from discounted bills of exchange and other similar obligations undertaken by an entity are usually disclosed in the financial statements by note, even if the likelihood of loss is low.
Classification of actitivites on the Cash Flow Statement:
11. Main differences between AS3 and IndAS7
Details
| AS3 Cash Flow Statement
| Ind AS7 Cash Flow Statement |
Bank Overdrafts
| AS3 does not have such a requirement
| Ind AS 7 explicitly includes bank overdraft as a part of cash and cash equivalents to be repaid for the asking |
Cash Flows from Extracurricular Activities.
| AS3 requires that cash flows related to extracurricular activities be classified as cash flows from operating activities, financing activities, and investing activities. | IndAS7 does not include such a requirement |
changes in ownership of subsidiary | There are no such requirements for cash flows from changes in ownership of subsidiary AS3
| Ind AS 7 requires a classification of cash flows resulting from changes in ownership of subsidiaries. This will not lose your control as cash. Flow from financial activities |
Accounting for investments in subsidiaries or affiliates .
| AS 3 does not have such a requirement | Ind AS 7 requires the use of the cost method or equity method when accounting for investments in subsidiaries or affiliates |
| AS3 requires less disclosure requirements compared to Ind AS 7. | Ind AS 7 requires more disclosure requirements.
|
Key takeaways:

The income statement is a statement created to analyze why a company's financial position changes between two balance sheets. This indicates the inflow and outflow of funds, that is, the source and use of funds for a specific period of time. In other words, the cash flow statement is created to explain changes in the company's working capital position.
There are two types of inflows:-
If a company's long-term funding requirements are met just outside the long-term funding source, the total funding generated from the investment is represented by an increase in working capital. However, working capital will decrease if the funds generated from the investment are not sufficient to close the gap in long-term funding requirements.
Benefits of the income statement
Funds-Flow Statement
The cash flow statement is useful for long-term analysis. This is a very useful tool in the hands of management to determine a company's finances and performance. The balance sheet and income statement (income statement) do not provide the information provided by the cash flow statement, that is, changes in a company's financial position. Such analysis is very useful for management, shareholders, creditors, and so on.
2. Analyzing the income statement helps managers test whether working capital is being used effectively and whether working capital levels are appropriate or inadequate for business requirements. I will. Working capital positions help management make decisions such as paying dividends.
3. Fund flow statement analysis helps investors determine if a company has managed its funds properly. It also shows the creditworthiness of the company to help lenders decide whether to lend money to the company. This helps management make policy decisions about future funding policies and capital expenditures.
Preparation of fund flow statement
Step I: Create a working capital fluctuation statement
The first step in creating a cash flow statement is to create a working capital statement. There are several possible reasons for changing a company's working capital position, some of which are explained below.
Example: Create a working capital fluctuation statement from X Ltd's balance sheet for the years ending 2010 and 2011.
Particulars | 2010 | 2011 | Change in Working Capital |
Current Assets |
|
|
|
Inventory | 1524 | 1491 | -33 |
Sundry Debtors | 126 | 183 | +57 |
Cash and Bank | 134 | 166 | +32 |
Other Current Assets | 8 | 9 | +1 |
Loans and Advances | 1176 | 1474 | +298 |
| 2968 | 3323 | +355 |
|
|
|
|
(Less) Current Liabilities |
|
|
|
Liabilities | 1776 | 1483 | -293 |
Provision for Tax | 622 | 745 | +123 |
Proposed Dividend | 65 | 207 | +142 |
| 2463 | 2435 | -28 |
|
|
|
|
Working Capital | 505 | 888 | 383 |
Step II: Prepare funds from operations
The next step is to prepare the funds generated only from the business activities of the business, not from the investment / financial activities of the business. The operating funds shall be prepared as follows:
Particulars | Amount |
Net Income | xxx |
ADD |
|
1. Depreciation on Fixed Assets | xxx |
2. Amortization of Intangible Assets | xxx |
3. Amortisation of Loss on Sale of Investments | xxx |
4. Amortisation of Loss on sale of Fixed Assets | xxx |
5. Losses from Other Non-Operating Incomes | xxx |
6. Tax Provision (Created out of Current Profits) | xxx |
7. Proposed Dividend | xxx |
8. Transfer to Reserve | xxx |
|
|
|
|
(LESS) |
|
1. Deferred credit | xxx |
2. Profit on Sale of Investments | xxx |
3. Profit on Sale of Fixed Assets | xxx |
4. Any written back Reserve & Provision | xxx |
Step III: Prepare the income statement
When preparing a cash flow statement, it is necessary to clearly disclose the source and use of the funds and emphasize the source from which the funds were generated and the uses to which these funds were applied. This statement is sometimes referred to as a source and application statement or a statement of changes in financial position.
Funding source
The items displayed under the Funding Source heading are: ---
b. Mortgage: The amount you receive from mortgage financing is displayed under this heading. Short-term loans are not shown here as they have already been processed during the preparation of the working capital fluctuation statement.
c. Sale of investments and other fixed assets: The total amount received for the sale of investments and other fixed assets is displayed under this heading.
d. Funds from Operations: The funds generated from the operations calculated in Step II should also be displayed here.
e. Working Capital Decrease: This is a statement balance chart and is due to a change in the working capital statement.
Application of funds
The items displayed in the fund application are as follows.
3. Dividend and tax payments: Dividend and tax payments are applied for funds when the allowance is excluded from current liabilities and the current allowance is returned to profits to determine "funds from investment". Is considered.
4. Working Capital Increase: This is a statement balance diagram and results from a change in the working capital statement.
As explained above, the cash flow statement summarizes the resources available to fund a company's activities over a specific period of time and the uses for which such resources were used.
Key takeaways:

Meaning:
Ratio analysis is that the process of determining and interpreting numerical relationships supported financial statements. A ratio may be a statistical measure that gives a measure of the connection between two variables or numbers.
These relationships are often expressed as a percentage or a quotient. Ratios are easy to calculate and understand. Those curious about analyzing financial statements are often grouped into three heads.
i) Owner or investor
ii) Creditors and
iii) Treasury executives.
All three groups have an interest during a company's financial position and performance, but the key information it seeks to get from these statements varies widely, reflecting the aim of the statement.
Investors mainly want the idea for estimating profitability. Creditors are primarily curious about liquidity and therefore the ability to pay interest and redeem loans within a specified period of your time. Management is curious about evolving analytical tools that measure cost, efficiency, liquidity, and profitability to form intelligent decisions.
Ratio classification
Ratios are often categorized in two ways:
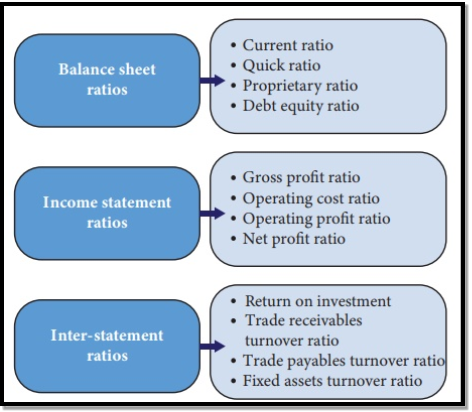
Traditional ratio classification is predicated on the financial statements during which the ratio is calculated. In traditional classification, ratios are divided into
i) Record ratio
If both items within the ratio are from the record, it's classified as a record ratio.
(ii) Earnings report ratio
If the 2 items within the ratio are from the earnings report, it's classified as an earnings report ratio.
(iii) Ratio between statements
When you calculate a ratio using one item on your earnings report and another on your record, it's called the inter-financial statement ratio.
Figure below shows some samples of traditional classification ratios:
2. Functional classification
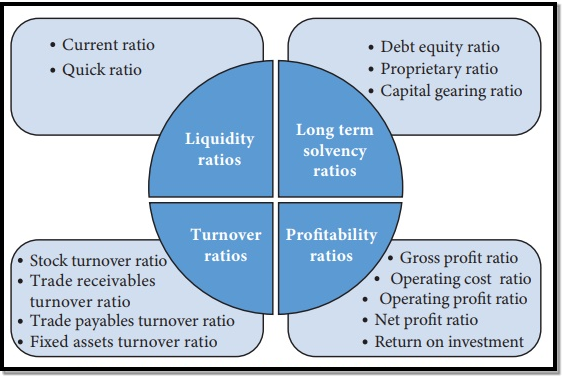
The functional classification of ratios is predicated on the aim of calculating ratios and is that the most ordinarily used classification. Within the functional classification, the ratios are classified as follows.
(I) Current ratio
(II) Long-term solvency ratio
(III) Sales ratio
(IV) Profitability ratio
Figure below shows some samples of ratios by functional classification.
Limitations
The limitations of ratio analysis are as follows:
1. Finding the right criteria is always a challenging task. The conclusions drawn from the ratios are no better than the criteria by which they are compared.
2. If the size, age, and product diversity of the two companies differ significantly, it will be more difficult to compare the two.
3. Changes in price levels can seriously affect the effectiveness of comparisons of ratios calculated over different time periods, especially for ratios where the numerator and denominator are represented by different types of rupees.
4. Differences in conditions such as gross profit, operating profit, and net profit make comparisons difficult.
5. If a company relies on "window dressing", outsiders cannot examine the facts and influence the effectiveness of the comparison.
6. The financial statements are based on some performance and some events that can only guide you to the extent that you can reasonably consider future membership fees.
7. Ratios do not provide a clear answer to financial problems. There is always a question of judgment as to what the numbers should mean. Therefore, you must rely on your common sense when choosing and evaluating ratios.
Key takeaways:
 References:


