Back to Study material
SURVEY

Unit - 3

Tacheometry and Contouring


  • Tacheometry is a branch of surveying in which horizontal & vertical distances are determined by taking angular observation with an instrument known as Tacheometer.
  • The chaining operation is completely eliminated in such a survey.
  • Tacheometric survey is adopted in rough & difficult terrain where direct levelling & chaining are either not possible or very tedious. It is also used in location survey for railways, roads, reservoir's etc.
  • It is very rapid & reasonable contour map can be prepared for investigation works within a short time on the basis of such a survey.
  •  

    Key Takeaways:

    1)  It is a branch of surveying in which horizontal & vertical distances are determined by taking angular observation with an instrument known as Tacheometer.


  • When obstacles such as steep and broken ground, stretches of water or swamps are met with, tachometry is best adapted from the speed and accuracy point.
  • In rough country both horizontal and vertical measurements are tedious and chaining is inaccurate, difficult and slow.
  • In locating contours and filling in detail in a topographic survey, this method is usually the quickest and best.
  •  

    Key Takeaways:

    1)  This method is usually the quickest and best.


  • The principle of tacheometry is to enable horizontal and vertical distances to be computed from readings upon a stadia rod, and thus eliminate chaining operation.
  • The observations that are required for complete location of a point say P with reference to the instrument station O are,
  • The bearing of the line OP.
  • The angle of elevation or depression recorded on vertical circle of the instrument.
  • The readings of three diaphragm hairs upon a stadia rod at P sighted through the telescope; top, middle and bottom.
  • The middle hair reading is known as axial hair reading or central hair reading.
  •  


  • It is not always possible to have a line of sight horizontal, while taking observations with tacheometer.
  • There are three different cases used:
  • Case I: Line of sight is horizontal and the staff is held vertical.
  • Case II: Line of sight is inclined and staff is held vertical.
  • Case I: Line of sight is horizontal and the staff is held vertical.

  • The horizontal distance (x) of the staff from the vertical axis of the instrument is given by:
  • H:\unit 3 survey\IMG_20210526_195932.jpg

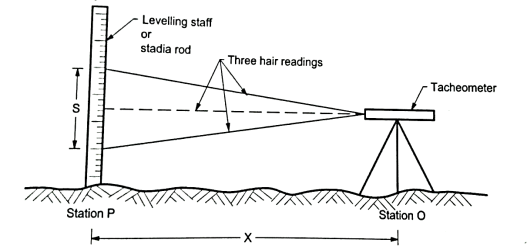
    Fig.3.1: Line of sight is horizontal and the staff is held vertical

    X= s + (f+c)

    RL of station = RL of line of sight – axial hair reading

    RL of line of sight= RL of Benchmrk + B.S

    Case II: Line of sight is inclined and staff is held vertical.

    H:\unit 3 survey\IMG_20210526_195957.jpg

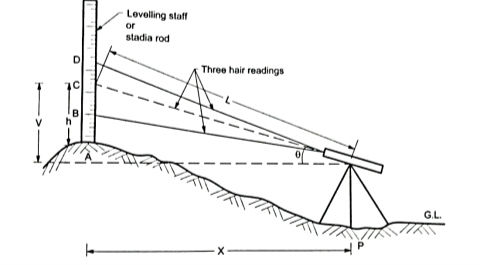
    Fig.3.2: Line of sight is inclined and staff is held vertical

  • Horizontal distance=X=Lcos
  •                                     = S cos2+(f+c) sin

  • Vertical distance=V=Lsin
  • = S+(f+c) sin

  • RL of staff station=RL of plane of collimation
  •  

    Key Takeaways:

    1)  There are three different cases used:

  • Case I: Line of sight is horizontal and the staff is held vertical.
  • Case II: Line of sight is inclined and staff is held vertical.
  •  


  • The values of the constants
    and (f+ c) for a given instrument may be determined experimentally as follows:
  • In this method the value of (f + c) is obtained by measurements.
  • The value of
    is computed as i being too small to be measured accurately.
  • Procedure:

  • Sight any distant object and focus it carefully.
  • With the help of scale measure the distance between the object glasses and plane of cross hairs along the top of telescope.
  • Let (f) be the focal length of objective.
  • Measure the distance (c) from the object glass to the vertical axis of the instrument.
  • Measure distance x1, x2, x3, etc from the instrument.
  • Let the corresponding staff intercepts be S1, S2, S3 etc.
  • In the formula X =
    (S) + (f + c) knowing (f + c) as directly measured in above steps and measured distance X1, X2, X3 etc.
  • Several values of
    is computed.
  • And the mean of the above values give constant
    .
  •  


  • Tacheometric technique is followed for contouring of very steep hills.
  • The steps are as follows:
  • Set up the tacheometer on the pinnacle of the steep hill. Tacheometer is a theodolite equipped with stadia diaphragm. The stadia diaphragm has 3 horizontal parallel hairs in preference to one as observed in a traditional move hair diaphragm.
  • With the assist of a tacheometer, it's far viable to decide the horizontal distance of the factor from the telescope as nicely its vertical degree.
  • The steep hill is surveyed at 3 levels – the bottom of the hill, the mid-degree of the hill and the pinnacle degree of the hill.
  • Using the tacheometer studying are taken all over the hill at identical angular durations on some of these 3 levels.
  • The radial plot therefore acquired is labored withinside the workplace to interpolate factors of identical elevation for contour mapping.
  •  

    Key Takeaways:

    1)  Tacheometric technique is followed for contouring of very steep hills.


    A tacheometer having constant 100 and 0.4 m readings were taken on vertical staff at station P and Q as follows:

    Instrument Station

    Staff station

    Hair reading

    Remark

    A

    P

    Q

    1.200,2.300,3.400

    0.300,2.100,3.900

    RL of P=100.00m

    Calculate the horizontal distance between A and Q and reduced level of Q. Assume line if sight horizontal.

    Step 1: The line of sight horizontal and staff is held vertical.

    X= (S) + (f + c)

    Step 2: The horizontal distance between O and A by observation at A

    X =100 × (3.900-0.300) +0.4

    X=360.4 m

    Step 3: RL of instrument axis = RL of BM+ central hair reading

    =100+2.3

    =102.3 m

    RL of Q = RL of instrument axis –central hair reading

    = 102.3-2.1

    =100.2 m


  • Contouring in surveying is the dedication of elevation of numerous factors at the floor and solving those factors of equal horizontal positions withinside the contour map.
  • To exercising vertical manage leveling paintings is accomplished and concurrently to exercising horizontal manage chain survey or compass survey or aircraft desk survey is to be accomplished.
  • If the theodolite is used, each horizontal and vertical controls may be performed from the equal instrument.
  • Based at the units used one could classify the contouring in unique groups.
  •  

    Key Takeaways:

    1)  Contouring in surveying is the dedication of elevation of numerous factors at the floor and solving those factors of equal horizontal positions withinside the contour map.


  • A contour is an imaginary line on the ground joining the points of equal elevation or reduced level.
  • A contour line:

  • A contour line is a line on the map representing a contour. In a topographic map, the relative altitudes of the points can be represented by contour lines.
  • By means of contour lines, the nature of the ground i.e., sloping, steep slopes and gradual slopes, hills and valley can be shown in the topographic map.
  •  


  • The contour lines have the following characteristics
  • All points on a contour line have the same elevation or R. L’s. Fig. shows the contour lines of equal elevation.
  • H:\unit 3 survey\IMG_20210526_200018.jpg

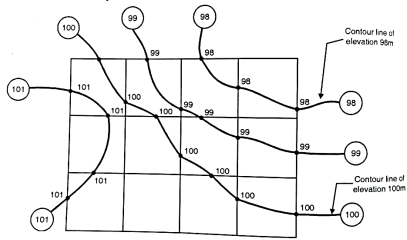
    Fig.3.3: Contour lines of same elevation

  • Two contour lines of different elevations cannot cross each other. However, in case of overhanging cliff two contour lines of different elevations can intersect. For such case, refer the Fig.
  • H:\unit 3 survey\IMG_20210526_200041.jpg

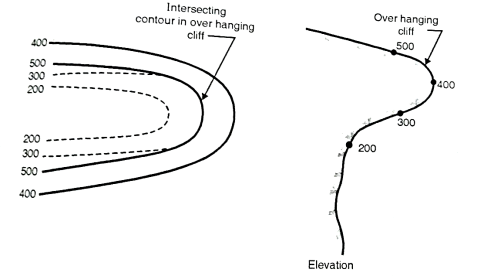
    Fig.3.4: Intersecting contours in overhanging cliff

  • Steep’s slope:
  • (i)When contour lines come close together then it indicates steep slope. Fig. shows steep slope along X-X.

    (ii) Uniform slope: if contour lines are equally spaced, uniform slope is indicated.

    (iii) A series of straight, parallel and equally spaced contours represent a plane surface.

    H:\unit 3 survey\IMG_20210526_200110.jpg

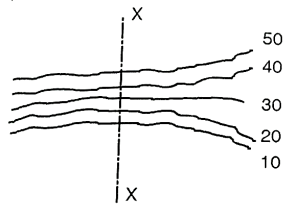
    Fig.3.5: Steep slope along X-X

    H:\unit 3 survey\IMG_20210526_200131.jpg

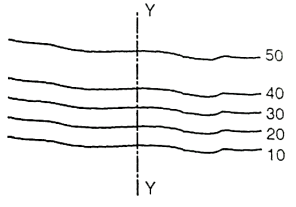
    Fig.3.6: A gentle slope along Y-Y

    H:\unit 3 survey\IMG_20210526_200651.jpg

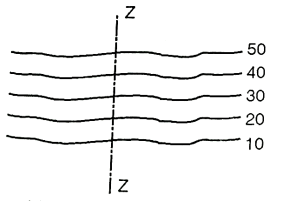
    Fig.3.7: Uniform slope along Z-Z

    H:\unit 3 survey\IMG_20210526_200208.jpg

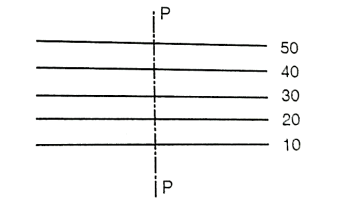
    Fig.3.8: Plane surface slope along P-P

  • Hill: Closed contour lines with higher values inside indicate hill. See Fig.
  • Depression: Closed contour lines with lower values inside indicate a depression.

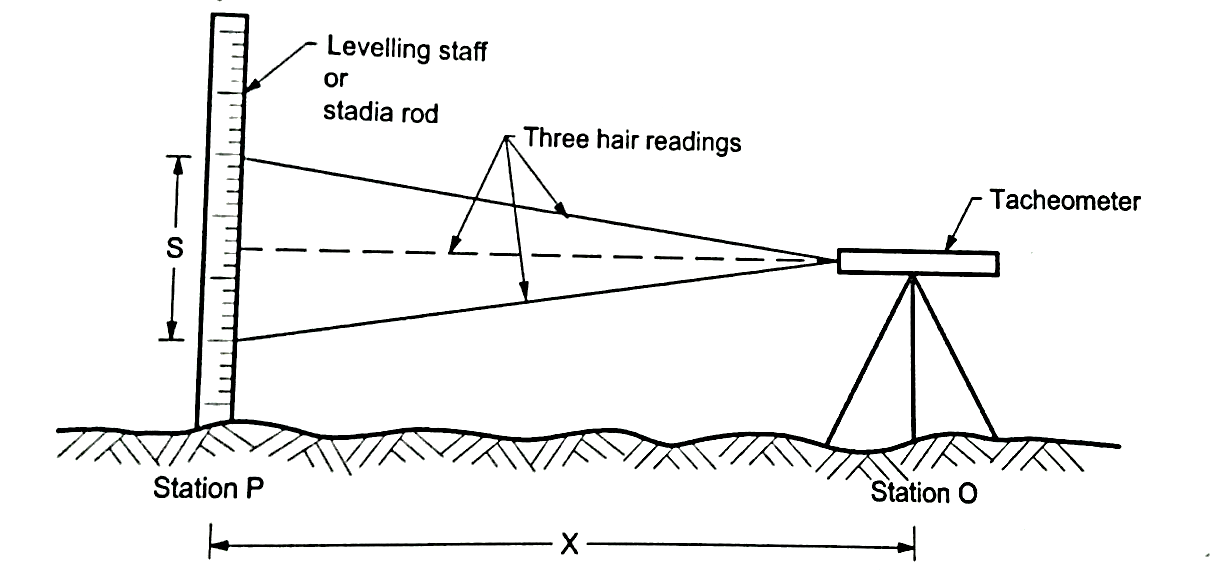
    Fig.3.9: shows depression

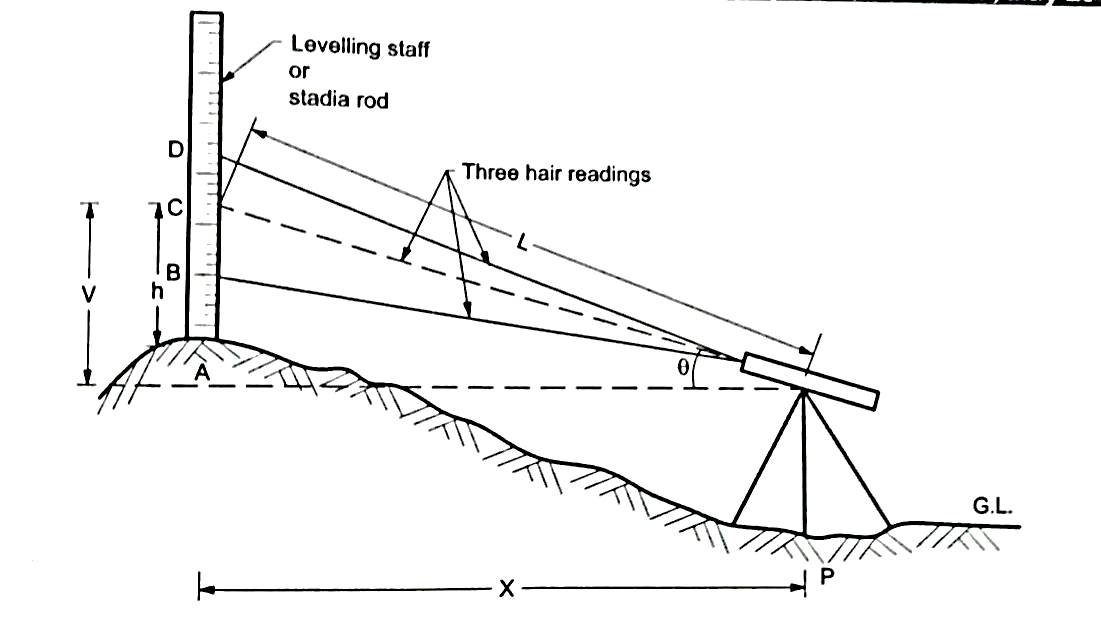
    Fig.3.10: Shows a hill

  • Ridge line:
  • Fig. indicates a ridge line. Contour lines cross ridge at right angles. For ridge line the higher elevation contour is inside the loop or band.

    Valley line

    Fig. indicates a valley line. Contour lines also cross the valley lines at right angles. Valley line is indicated by higher elevation contours outside the loop.

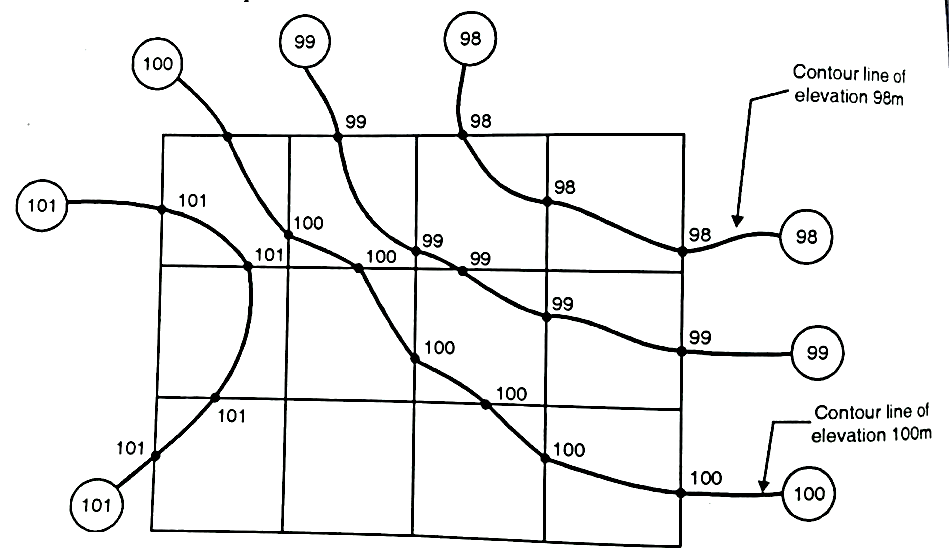
    Fig.3.11: Ridge and valley line


  • Topographic maps additionally display different forms of herbal functions inclusive of mountains, plants and rivers the usage of contour strains, colours, shapes and numbers.
  • Besides presenting records approximately top and gradient, the contour strains on topographic maps additionally imply the landform sorts and panorama patterns.
  •  


    Direct method:

  • In the direct method, the contour to be plotted is actually traced on the ground.
  • These points are plotted on ground and contours are marked through them. This method is followed where great accuracy is required.
  • Procedure:

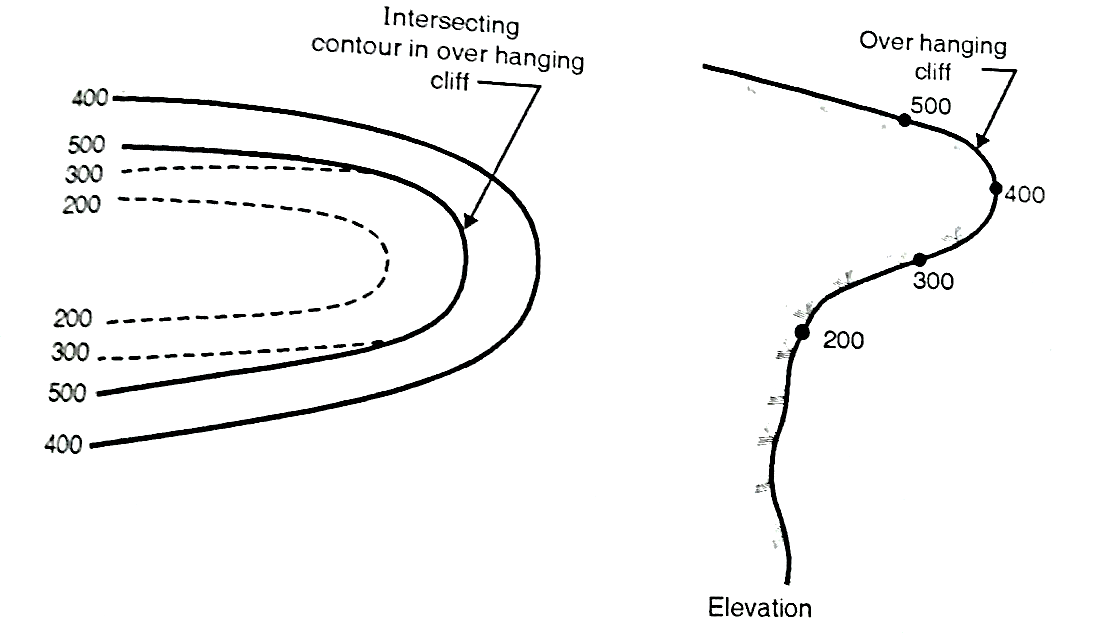
    Fig.3.12: Direct method

  • Consider an area as shown in Fig. which is to be surveyed for contouring.
  • (a)The work is started from B.M. and level is setup at the centre of the area.

    (b) Suppose it is required to find out the contour of 90.000 m then the staff should be moved to various positions on plot where the reading on staff should give R.L. of 90.000 m. on ground. When all the points are located, they are marked on ground directly.

    (c) Similar process is followed for locating the contour of 95.000 m and other contours.

    Indirect method:

  • In this method spot levels are taken at regular interval along predetermined lines on the ground. The work is then plotted on plan and then the required contour lines are drawn by the process of interpolation.
  • The indirect method is less tedious and speedy as compared to direct method.
  • The methods followed in indirect method of contouring are:
  • (a) By cross-section:

  • This method is suitable for roads, railways and canal survey. Consider X, Y, Z as the centre line of the road or railway or canal route as shown in Fig. cross sections are set at every 10 m on the centre line whereas the other dimension to complete a rectangle may be 5 m.
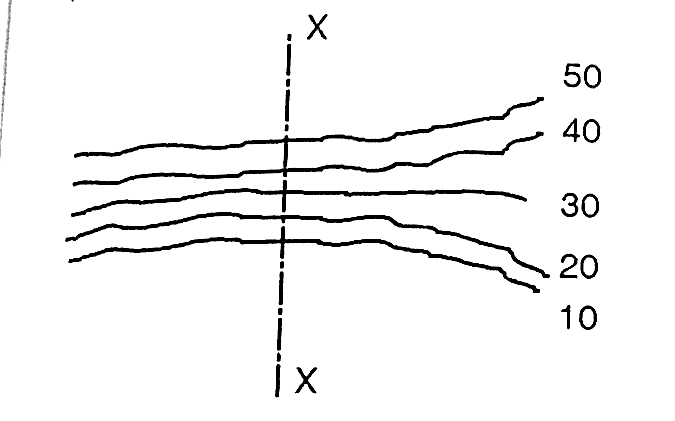
  • Fig.3.13: Method of cross-sections

  • The spacing of the cross-section depends upon the nature of terrain. The cross-sections are more closely spaced where the contours curve abruptly. Staff readings of all the nodal points are determined and the R. L’s are calculated. The same cross-section is plotted on the sheet to a suitable scale. The respective R. L’s are written on the nodal point as shown in Fig. and then the required contours are interpolated between the R. L’s.
  • (b) By squares:

  • In this method the area to be surveyed is divided into a number of squares of size 5 to 20 m depending upon the nature of the ground and contour interval required. The elevations of the corners of the squares (called nodal points here) are determine by means of process of levelling. The calculated reduced level of these nodal points are then written on the respective nodal and contours are interpolated between them.
  • This method is used when the area to be surveyed is small and the ground is not mush undulating because on undulating ground it would be practically impossible to form squares.
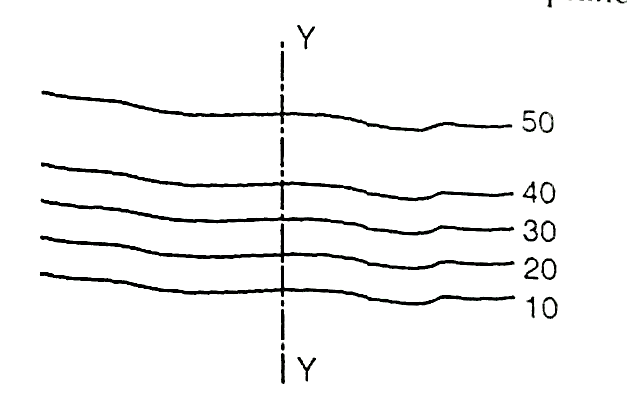
  • Fig.3.14: Method of square

    (c) By tacheometric method:

  • In the case of hilly areas, tacheometric contouring method is used. Here instrument known as tacheometer which is a theodolite, is utilized which determines horizontal distances and elevation of points.
  • As shown in Fig. the tacheometer is set at a point approximately at the centre of the area. Radial lines are set making angles with either the magnetic meridian or with the first radial line. On each radial line staff readings are observed at different points. When the readings along all the radial lines have been observed, it is then plotted on a sheet to a suitable scale. The required contour lines are then interpolated as usual.
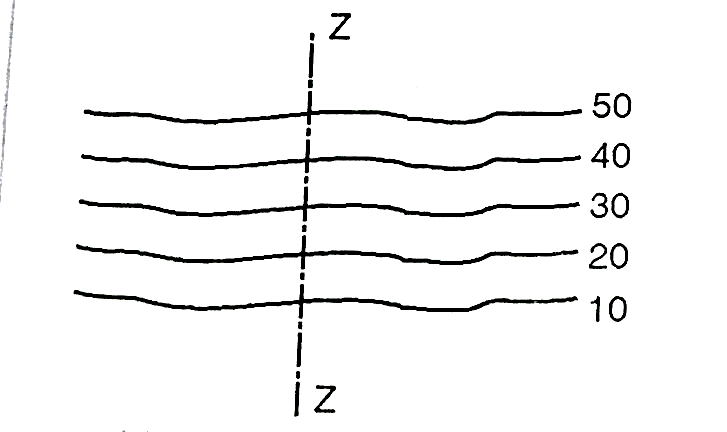
  • Fig.3.15: Tacheometric method


    Key Takeaways:

    1)  Direct method: In the direct method, the contour to be plotted is actually traced on the ground.

    2)  Indirect method: In this method spot levels are taken at regular interval along predetermined lines on the ground. The work is then plotted on plan and then the required contour lines are drawn by the process of interpolation.


    The important uses of contour maps are:

    Intervisibility between two points:

  • A contour map can be used to determine the intervisibility of two points knowing the elevations of two stations at a farther distance. If a contour line passes in between them of more elevation then the stations will not be intervisible.
  • Calculation of reservoir capacity:

  • The contour plan used to calculate the storage capacity of reservoirs. The areas between the contours are found by planimeter and multiplied by contours interval, will give the total volume of water that can be stored in a reservoir.
  • Drawing of sections:

  • If a contours plan is given and a section is drawn along any direction, the general shape of the ground can be known.
  • Fig.  shows section of line PQ.
  • Location of Route:

  • A contour plan is very much useful in locating the route of a highway, railway, canal or any other communication line Fig. show route P to Q at an upward gradient.
  •  

    Key Takeaways:

  • Intervisibility between two points.
  • Calculation of reservoir capacity.
  • Drawing of sections.
  • Location of Route.
  •  


  • A topographic map is a two-dimensional representation of three-dimensional land surface.
  • Topographic maps are differentiated from the other maps in that they show both the horizontal and vertical positions of the terrain.
  • Through a combination of contour lines, colours, symbols, labels and other graphical representations, topographic maps partray the shapes and locations of mountains, forests, rivers, lakes, cities, road, bridges and many other natural and man-made features.
  • The survey of India is responsible for all topographic control, surveys and mapping of India.
  • To identify a map of particular area, a map numbering system has been adopted by survey of India.
  • Topographic maps are generally classified according to the scale as follows:
  • Large scale maps: Scale 1 in 1000 or less than 1000
  • Medium scale maps: Scale from 1 in 1000 to 1 in 10000.
  • Small scale maps: Scale 1 in 10000 or greater than 10000.
  • Uses of Toposheets:

  • Toposheets contain valuable reference information for surveyors and map makers, including bench marks, base lines and meridians and magnetic declination.
  • Toposheets are used in civil engineers, environmental managers and urban planners as well as by outdoor enthusiast’s emergency services agencies and historians.
  • Toposheets are extremely useful for planning various projects as they provide the required data in most convenient form so that the construction can be planned.
  • Toposheets are used for planning of a building complex, an industrial plant, a railway of a highway project, an irrigation projects or a drainage system.
  • Bridges, tunnels and dams are also planned and designed from the toposheets.
  • These are also helpful for directing military operations at the time of war.
  • These are used for the development of hydroelectric schemes, landscape, architecture, environmental protection and agriculture.
  • Toposheets can be used in earth sciences and many other geographic disciplines mining and other earth based endeavors.
  •  

    Key Takeaways:

    1)  A topographic map is a two-dimensional representation of three-dimensional land surface. Topographic maps are differentiated from the other maps in that they show both the horizontal and vertical positions of the terrain.


    Profile leveling:

    The process of determining the elevations of points at measured intervals along a fixed line such as the centre line of a railway, highway, canal or sewer is known as profile levelling.

    Objects: To determine the undulations of the ground surface along a given line for the alignment of canal, pipe line, road and railway.

    Field procedure:

  • Let PQR be the given line of section.
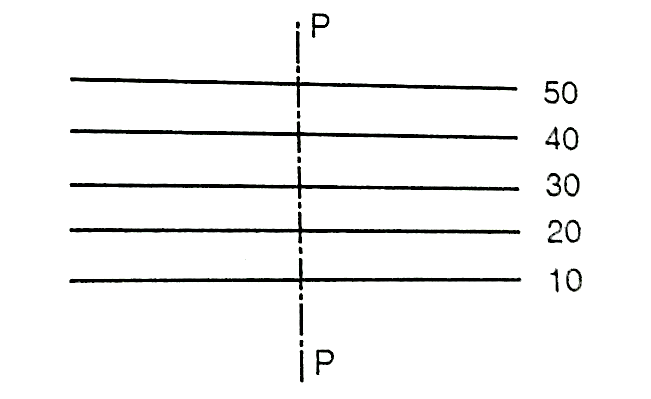
  • Fig.3.16: Profile leveling

    2.   Mark point at 10 m intervals on this line.

    3.   Level is set up on a firm ground at a suitable point I1

    4.   Temporary adjustment of level is done and B.S is taken on the B.M.

    5.   The RL of collimation (HI) is worked out by adding B.S. to the R.L. of B.M. the chain is stretched from P toward the point B.

    6.   Also, the staff readings are taken at 10 m points, and entered in the I.S column against the respective chainages.

    7.   Besides these points, the staff readings are taken at the representative points for example slope of ground surface changes appreciably.

    8.   When it is found necessary to shift the instruments on account of the length of sight exceeding about 100 m or the further points not being possible to be observed owing the irregularities of the ground, CP, is taken at suitable position, and F.S is taken on it and entered in F.S column.

    9.   The instrument is then shifted and set up on firm ground at I2, as before.

    10.             B.S is taken on CP1, and new HI is calculated.

    11.             Chaining and readings are then continued as before until the reading is obtained at the lasp point R.

    12.             B.M should be checked during the progress of the work.

    13.             Therefore, bearing of the line PQ, QR etc are taken with compass at start and noted in the field book.

    14.             Neat sketches of Bench Marks and the features such as nalla, road crossing etc should be drawn in the field book with full description.

    Important points to be remembered while running a profile:

  • The chainage of the staff points is continuous from the beginning to the end of the section line.
  • To eliminate the instrumental errors, the back sight and fore-sight distance should be approximately equal.
  • Bubble must be in the centre of its run when the B.S and F.S readings are taken.
  • The features such as Road, Foot path, nalla, river etc crossed by the line should be fully located by taking bearing of their centre lines, their width or by offsets.
  • Plotting Profile Levelling:

  • When the heights of all the points along the section have been calculated, a profile can be drawn.
  • The horizontal distance is plotted along the horizontal axis to some convenient scale and the distances are also marked. The vertical lines are drawn at these points representing the elevations above the reference level. Each ground point is thus plotted by two coordinates i.e., chainage and elevation. The line joining the top points of these ordinates then represents the ground sections.
  • Since the horizontal distances involved are in general very much greater than the variations in level. Thus, y axis scale is larger than the x axis. In this way irregularities of the ground are made more apparent. The ratio of exaggeration adopted runs from 5 to 15 times.
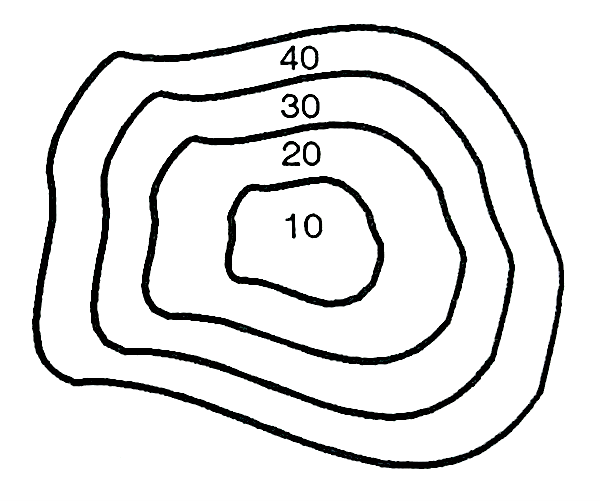
  • Fig.3.17: Plotting profile level

    Cross Sections:

  • The lines of cross-sections are in general perpendicular to the longitudinal section line.
  • The purpose of cross sectioning is to furnish the engineer with sufficient information regarding the levels of the ground on either side of the longitudinal section to enable him to design the intended work. Cross-sections are taken at every 20 m or 30 m distance along the centre line. The length of cross-section may be run at closer intervals to outline the features of road, nala, etc. Electro refining
  • The cross sections are numbered consecutively from the commencement of the centre line and are set out at right angles to the main line of section with the chain and tape, the cross-staff or the optical square and the distances are measured left and right from the centre peg. The length of cross-section depends upon nature of work Refer Fig.
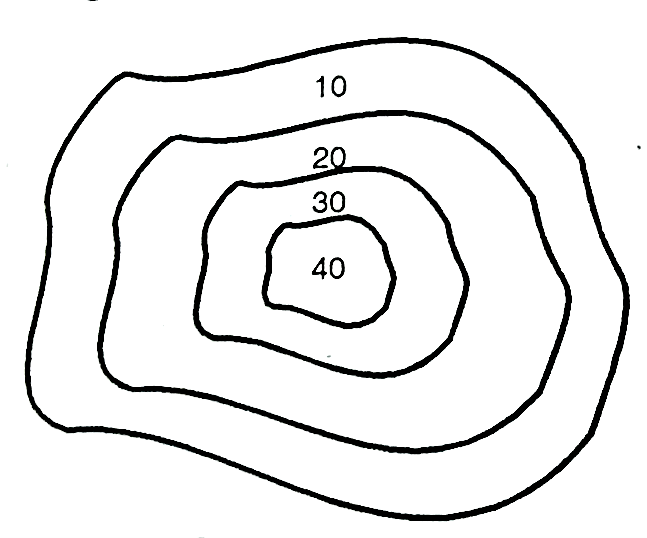
  • Fig.3.18: Cross-section

    Plotting the Cross Section:

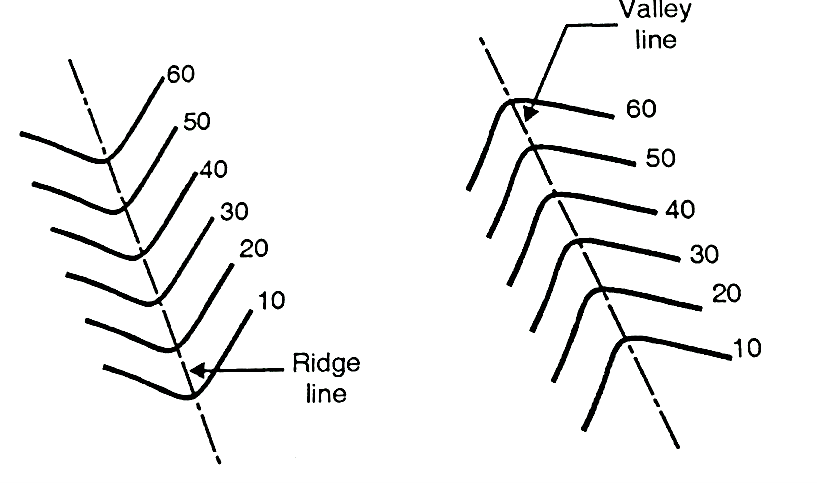
    Fig.3.19: Plotting cross section

  • The plotting of cross sections observed as above is similar to that of profiles, except that, in this case vertical and horizontal measurements plotted to the same scale.
  • The point along the longitudinal section is plotted at the centre of the horizontal axis.
  • The points to the left of center are plotted to the left and those to the right are plotted to right. The points so obtained are joined by straight lines.
  •  

    Key Takeaways:

    1)  Profile leveling: The process of determining the elevations of points at measured intervals along a fixed line such as the centre line of a railway, highway, canal or sewer is known as profile levelling.

    2)  Cross Sections: The lines of cross-sections are in general perpendicular to the longitudinal section line.


    References:

  • Surveying and leveling by r. Subramanian, Oxford Publication.
  • GPS Satellite Surveying-Alfred Leick-Wiley.
  • Surveying and leveling Vol.1 and 2 by T.P. Kanetkar and S.V. Kulkarni Pune vidyarthi Griha Prakashan.
  • Surveying by B.C. Punmia.
  •  


    Index
    Notes
    Highlighted
    Underlined
    :
    Browse by Topics
    :
    Notes
    Highlighted
    Underlined