Unit - 2
Data & Algorithms
Two factors which explain the new boom in the discipline around 2010.
- First to access to massive volumes of data. To be able to use algorithms for image classification and cat recognition, for example, it was previously necessary to carry out sampling. Today, a simple search on Google can find millions.
- Next the discovery of the extremely high efficiency of computer graphics card processors to accelerate the calculation of learning algorithms. The process being very iterative could take weeks before 2010 to process the entire sample. The computing power of these cards which is capable of more than a thousand billion transactions per second has enabled considerable progress at a limited financial cost.
A complete paradigm shift from expert systems. The approach has become inductive: it is no longer a question of coding rules as for expert systems, but of letting computers discover them alone by correlation and classification, based on a massive amount of data.
Among machine learning techniques, deep learning seems the most promising for a number of applications. In 2003, Geoffrey Hinton (University of Toronto), Yoshua Bengio (University of Montreal) and Yann LeCun (University of New York) decided to start a research program to bring neural networks up to date. They conducts experiments simultaneously at Microsoft, Google and IBM with the help of the Toronto laboratory in Hinton and showed that this type of learning succeeded in halving the error rates for speech recognition. Similar results were achieved by Hinton's image recognition team.
This type of learning has also enabled considerable progress in text recognition, hence the smartphones knew how to transcribe an instruction but cannot fully contextualize it and analyze our intentions.
AI in today’s meeting storage requirements is fast and critical. It's what allows so much data to be analysed so quickly and intelligently and avoids bottlenecks, availability issues and security concerns.
AI changes the mission of storage, which means that organizations should be looking at storage and data differently.
Storage is not something you need for database or a particular use case but think of how you can use the access you have to data from different departments in different ways. If you can make that data accessible to data scientists or other people in your organization with crossline responsibilities, you can reach the next tier of data analytics, which really changes one of the key missions of storage.
By focusing on the application instead of the data, you can match the storage and its capabilities to the business. For example, an insurance company that processes a lot of claims (the business process) would identify an application along with claims experts and application developers responsible for the claims system. By putting them all together, they can best decide how to use the data to create an intelligent claims processing system.
Building a successful AI-based storage infrastructure also means addressing each of three distinct phases in the AI storage pipeline:
Data ingestion (ingesting and normalizing data from different environments so you can look across it as a whole), training (using machine learning to examine the data to understand what's really inside of it) and inference (the stage of delivering insights).
Six stages of data processing
1. Data collection
Collecting data is the first step in data processing. Data is pulled from available sources, including data lakes and data warehouses. It is important that the data sources available are trustworthy and well-built so the data collected (and later used as information) is of the highest possible quality.
2. Data preparation
Once the data is collected, it then enters the data preparation stage. Data preparation, often referred to as “pre-processing” is the stage at which raw data is cleaned up and organized for the following stage of data processing. During preparation, raw data is diligently checked for any errors. The purpose of this step is to eliminate bad data and begin to create high-quality data for the best business intelligence.
3. Data input
The clean data is then entered into its destination (perhaps a CRM like Salesforce or a data warehouse like Redshift) and translated into a language that it can understand. Data input is the first stage in which raw data begins to take the form of usable information.
4. Processing
During this stage, the data inputted to the computer in the previous stage is actually processed for interpretation. Processing is done using machine learning algorithms, though the process itself which vary slightly depending on the source of data being processed like data lakes, social networks, connected devices etc. and its intended use like examining advertising patterns, medical diagnosis from connected devices, determining customer needs, etc.
5. Data output/interpretation
The output/interpretation stage is the stage at which data is finally usable to non-data scientists. It is translated, readable, and often in the form of graphs, videos, images, plain text, etc. Members of the company or institution can now begin to self-serve the data for their own data analytics projects.
6. Data storage
The final stage of data processing is storage. After, all of the data is processed, it is then stored for future use. While some information may be used immediately, much of it will serve a purpose later. Plus, stored data is a necessary.
Data visualization uses algorithms to create images from data so humans can understand and respond to that data more effectively. Artificial intelligence development is the quest for algorithms that can “understand” and respond to data the same was as a human can — or better.
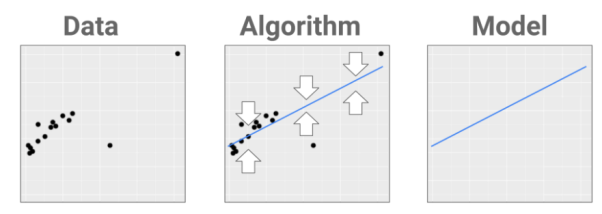
Artificial intelligence development is quite a bit different from typical software development: the first step — writing software — is the same, but instead of someone using the software you wrote, like in normal software development, the AI software you write then takes some data as input and creates the software that ends up being used. This is referred to as the AI system training or learning, and the end result is usually called a model. This two-step process is key to the success of AI systems in certain domains like computer vision: AI software can create computer vision models better than humans can.
On the other hand, the output of the AI development process is often spoken of as a “black box” because it wasn’t created by a human and can’t easily be explained by or to humans. Data visualization has turned out to be critical to AI development because it can help both AI developers and people concerned about the adoption of AI systems explain and understand these systems.
Classification
In order to automate a classification task, create algorithm’s a recipe that separates the data, like so:

The story here was all about separating the good (Yes) bottles of wine from the not-so-yummy (N) bottles.
Here is a dataset that is labeled with two classes (Y and N). In other words, the algorithm must put a fence in the data to best separate the Ys from the Ns. Our goal is to create a model that can be used to classify new examples correctly:

For example, if I get four new bottles of wine, I simply use their input data to figure out where they go on this map, then match them against the recipe’s red and blue regions and label them accordingly.
The algorithm defines WHAT shape will get fitted to the data. The data is used to choose WHERE the best place for that fence is.
Prediction
If classification is about separating data into classes, prediction is about fitting a shape that gets as close to the data as possible.
The object we’re fitting is more of a skeleton that goes through one body of data instead of a fence that goes between separate bodies of data.

So, the input data is one-dimensional here and two-dimensional in the example above.
As before, the algorithm gives you the WHAT and the data gives you the WHERE. When new datapoints come in, they’re plugged into the recipe and the predicted value is read off the line.
Regression
Regression task is preferred instead of prediction task, for at least two reasons:
It’s (yet another) term pilfered by the young field of machine learning from an adjacent older discipline (statistics), apparently without looking up the original meaning.
It creates confusion, since the term “regression” is still used in ML/AI the way centuries of statisticians have used it: to refer to a class of algorithms not tasks.
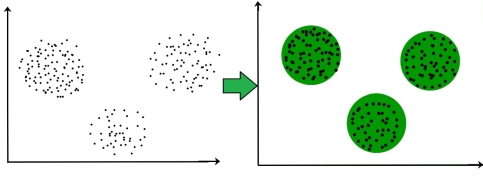
Clustering is the task of dividing the population or data points into a number of groups such that data points in the same groups are more similar to other data points in the same group and dissimilar to the data points in other groups. It is basically a collection of objects on the basis of similarity and dissimilarity between them.
For ex– The data points in the graph below clustered together can be classified into one single group. We can distinguish the clusters, and we can identify that there are 3 clusters in the below picture.

Figure. Clusters
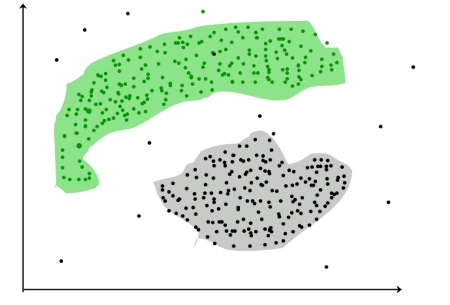
It is not necessary for clusters to be a spherical. Such as:

Figure. DBSCAN: Density-based Spatial Clustering of Applications with Noise
These data points are clustered by using the basic concept that the data point lies within the given constraint from the cluster centre. Various distance methods and techniques are used for calculation of the outliers.
Clustering is important as it determines the intrinsic grouping among the unlabelled data present. There are no criteria for a good clustering. It depends on the user, what is the criteria they may use which satisfy their need. For instance, we could be interested in finding representatives for homogeneous groups (data reduction), in finding “natural clusters” and describe their unknown properties (“natural” data types), in finding useful and suitable groupings (“useful” data classes) or in finding unusual data objects (outlier detection). This algorithm must make some assumptions which constitute the similarity of points and each assumption make different and equally valid clusters.
Recommended systems for clustering is a bit weak, because what we do in fact is we identify user groups and recommend each user in this group the same items. When we have enough data it’s better to use clustering as the first step for shrinking the selection of relevant neighbours in collaborative filtering algorithms. It can also improve the performance of complex recommendation systems.
Each cluster would be assigned to typical preferences, based on preferences of customers who belong to the cluster. Customers within each cluster would receive recommendations computed at the cluster level.
References:
1. Artificial Intelligence: A Modern Approach by Stuart Russell and Peter Norvig, Prentice Hall
2. Artificial Intelligence by Kevin Knight, Elaine Rich, Shivashankar B. Nair, Publisher: McGraw
Hill
3. Data Mining: Concepts and Techniques by Jiawei Han, Micheline Kamber, Jian Pei,
Publisher: Elsevier Science.
4. Speech & Language Processing by Dan Jurafsky, Publisher: Pearson Education
5. Neural Networks and Deep Learning A Textbook by Charu C. Aggarwal, Publisher: Springer
International Publishing
6. Introduction to Artificial Intelligence By Rajendra Akerkar, Publisher : PHI Learning