Unit 2
Energy-Depth relationship
Specific Energy
The concept of specific energy is first introduced by Bakhmeteft and has been proven to be very useful in analysis of open channel flow.
The total energy of a channel flow referred to datum is given by,
H = Z+YcosƟ + V2/2g
If the datum coincides with the channel bed at the cross-section, the resulting expression is known as specific energy and is denoted by E. Thus, specific energy is the energy at a cross-section of an open channel flow with respect to the channel bed.
E = YCosθ + V2/2g
When cosθ =1 and α =1, the equation of specific energy further simplify as:
F =Y+ V2/2g
It indicates that the specific energy is equal to the sum of the depth of water and the velocity head. Therefore, we defined as
• Specific energy is the energy at a cross-section of an open channel flow with respect to the channel bed.
• Specific energy is the height of the energy grade line above the channel bottom.
In other respect, since V=Q/A, the equation of specific energy may be written as:
E=Y+V | αV 2 | = Y + | Q2 |
| ||
| 2g |
| 2gA2 |
| ||
|
|
|
| |||
Here, cross-sectional area A depends on water depth y and can be defined as, A = f(y) and also there is a functional relation between the three variables as, f (= E, y, Q) = 0
In order to examine the functional relationship on the plane, two cases are introduced.
1. Constant discharge: Q = Q1 ⇒ E = f (y, Q). Variation of the specific energy with the water depth at a cross-section for a given discharge Q1.
2. Constant Specific Energy E = E1 ⇒ E = f (y, Q). Variation of the discharge with the water depth at across-section for a given specific energy E.
Constant Discharge Situation
Since the specific energy,
E=Y+V | αV 2 | = Y + | Q2 |
| ||
| 2g |
| 2gA2 |
| ||
|
|
|
| |||
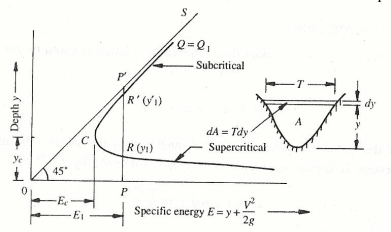
Fig. 1: Specific energy diagram
For a channel of known geometry, E = f (y, Q). Keeping Q = constant = Q, the variation of E with y is represented by a cubic parabola. (Figure 2.1) is called specific energy diagram.
It is seen that there are two positive roots for the equation E indicating that any particular discharge Q1can be passed in a given channel at two depths and still maintain the same specific energy E1.
The depths of flow can be either PR = y1 or PR = y1. These two possible depths having the same specific energy are known as alternate depths.
In Fig. (2.1), a line (OS) drawn such that E = y (i.e. at 45 to the abscissa) is the asymptote of the upper limb of the specific energy curve. It may be noticed that the intercept PR and PR represents the velocity head. Of the two alternate depths, one (PR = y1) is smaller and has a large velocity head while the other (PR= y1) has a larger depth and consequently a smaller velocity head.
Variable Discharge Situation
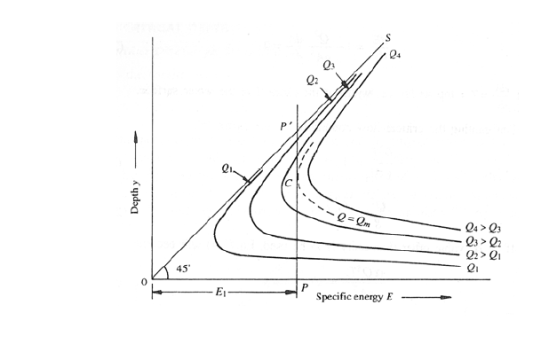
Fig. 2: specific energy diagram for variable discharge
In this condition Q1<Q2<Q3< ------ Qn.
Consider a section PP’, the ordinate PP’=E=E1=constant. Different Q curves give different intercepts. Thus, the alternative depths of a given Q can be computed by considering constant specific energy.
Critical Depth
For a given Q, as the specific energy is increased the difference between the two alternate depths increases. On the other hand, if E is decreased, the difference (y1 – y1) will decrease and a certain value E = Ec, the two depths will merge with each other (at point C in Fig. 2.1). No value for y can be obtained when E < E1 denoting that the flow under the given conditions is not possible in this region. Thus this condition of minimum specific energy is known as the critical flow condition and the corresponding depth yc is known as critical depth.
At critical depth, the specific energy is minimum, if differentiating the equation of specific energy with respect to y (keeping Q constant) and equating to zero,

 Designating the critical flow condition by suffix
It is the basic equation governing the critical flow conditions in a channel. It may be noted that the critical flow condition is governed solely by the channel geometry and discharge. Other channel characteristics such as the bed slope and roughness do not influence the critical flow condition for any given Q. If the Froude number of the flow is defined as,
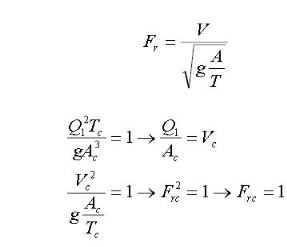
The critical flow corresponds to the minimum specific energy and at this condition the Froude number of the flow is unity
This is the criterion for critical flow, which states that at the critical state of flow the velocity head is equal to half of hydraulic depth.
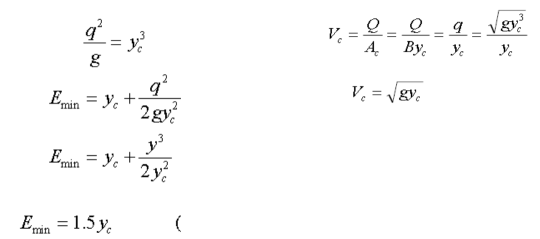
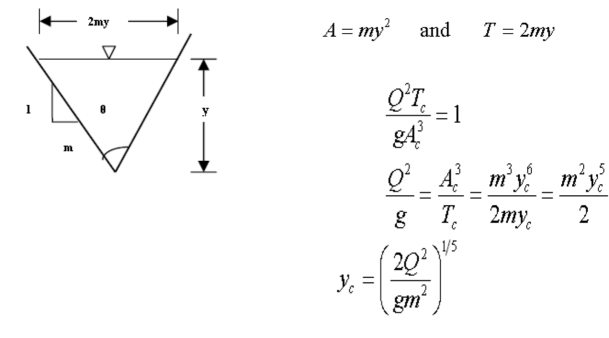
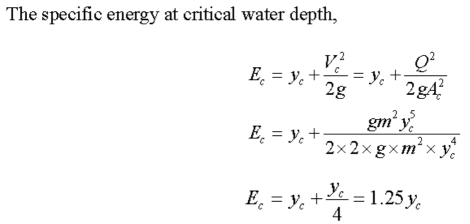
Computation of Critical Depth
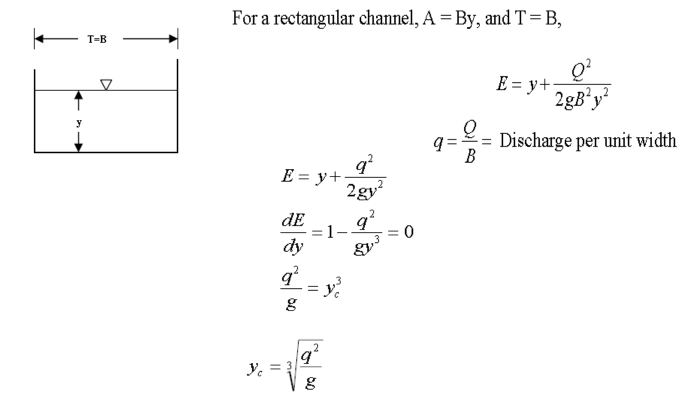 A) Rectangular Channel
B) Triangular Channel
Discharge-Depth Curve
An alternative way of viewing the change in flow is a discharge function. The discharge function for a given constant specific energy (E1) is defined by
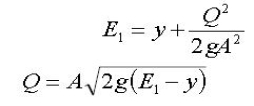
The plotting of the variation of discharge with the water depth is called Discharge –Depth curve
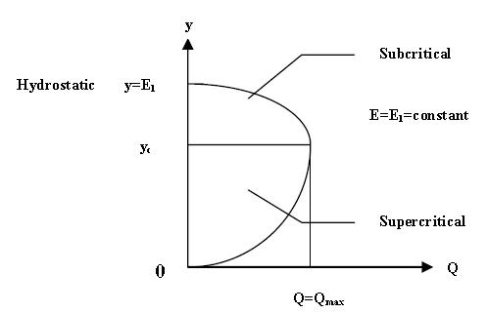
Fig 2.3: Variation of Discharge with water depth
The condition for maximum discharge can be obtained by differentiating the discharge function equation with respect to yc and equating it equal to zero while keeping E= constant
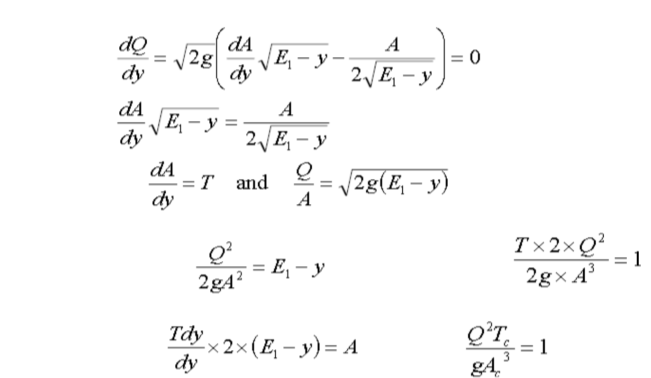
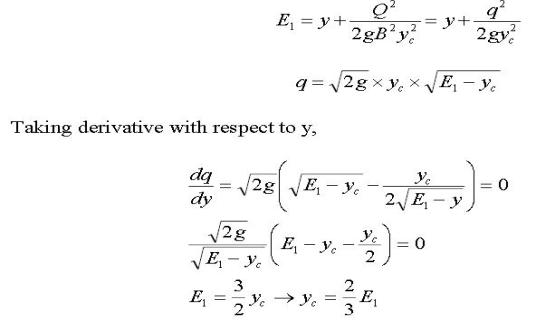
Hence the critical flow condition also corresponds to the maximum discharge in a channel for a fixed specific energy.
Consider Rectangular channel section for a given Specific Energy E =E1
Occurrence of Critical Depth
The analysis of open channel flow problems usually begins with prediction of points in the channel at which the critical depth yc will occur. Those points feature a change from subcritical to supercritical flow, are known as controls since their occurrence governs, or controls, the liquid depths in the reach of channel upstream from these points. The most obvious place where critical depth can be expected are
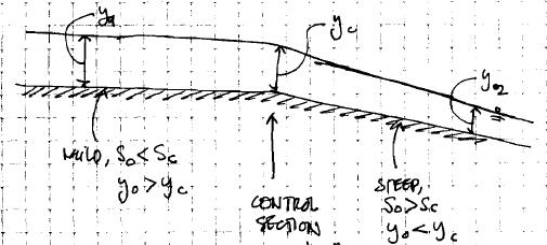
Fig. 3: Change from mild to steep slope in a channel
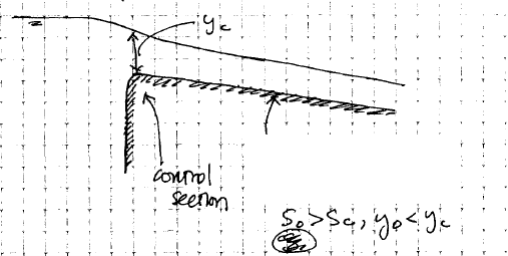
Fig. 4: Entrance of flow from a reservoir into steep slope channel
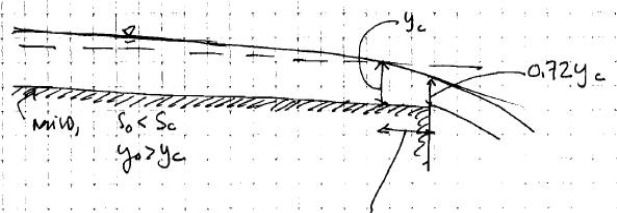
Fig. 5: Free-fall from mild slope channel
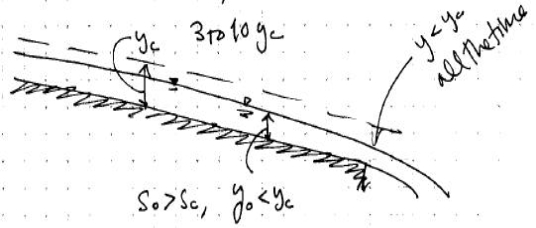
Fig. 6: Free-fall from steep –slope channel
Key Takeaways:
- Hump: Bed is raised in the form of hump. There is no frictional force between fluid and surface.
- Specific Energy: Specific energy is the energy at a cross-section of an open channel flow with respect to the channel bed.
- Alternate Depth: In open channels, two alternate depths of flow have the same energy for the same flow rate.
Most important application is for analysis of flow through channel transition, flow over raised channel floor-broad crested Weir, through sluice gate opening sector etc.
Two important transition are there -
- Vertical contraction or channel width with a hump (raised bed of channel at certain location).
Horizontal contraction or width contraction
2.3.1 Flow through Vertical Contractions
We will discuss two conditions
a) Subcritical flow
Suppose horizontal frictionless rectangular channel of width B & carrying discharge Q at depth y1.
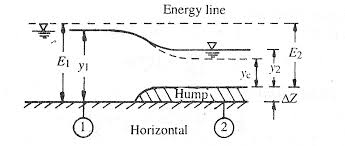
Fig.2.8: Vertical contraction
Flow is subcritical and at section 2 to a smooth hump of height delta Z is built. There is no loss of energy between 1 and 2 and also hump causes of specific energy at 1 and 2 and also come causes specific energy at section 2 to decrease by ▲Z.
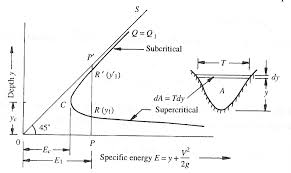
Fig.2.9: Energy diagram
Specific energy at section 1-------E1 = Y1 + V2/2g
Specific energy at section 2-------E2 = E1 - ▲Z
Also,
E2 = Y2 + V2/2g
As ▲Z increases, y2 decreases at point C the value of hump height will be maximum (▲Zm), Here
Y2= Yc& E2 = Ec
E2 = E1 -▲Zm or Ec = Yc + Q2/2gB2yc2
If ▲Z >▲ Zm then flow is not possible even with given specific energy.
When O <▲z>▲Zm upstream water level will be constant at, when y1 while y2 decreases ▲Z and goes on increasing till YC at ▲Zm.
When ▲Z>▲Zm, y1 will change to y1 and y2 will continue to remain Yc.
Minimum size of hump for critical flow
When ▲Z = ▲Zm, the critical flow occurs at section 2 but as ▲Z>▲Zm the specific energy at section 1 will be changing,
Thus ▲Zm is called minimum size of ham for critical flow to occur.
At▲Z = ▲Zm, E2 = Ec = 3/2yc
E1 = Ec + ▲Zm
▲Zm = E1 - 3/2yc
▲Zm / y1 = E1 / Y1 – 3Yc / 2Y1
E1 / Y1 = 1 + f12/2 & Yc = (q2/g) 1/3---------put in equation
▲Zm / y1 = (1 + f12/2 – 3/2 (q2/g) 1/3 X 1/Y1)
▲Zm / y1 = (1 + f12/2 – 3/2 f1 2/3)
When there is energy loss due to hump
Let h1 be energy loss
E1 = E2 + ▲Z+ HL
Then,
▲Zm / y1 + hL/Y1 = (1 + f12/2 – 3/2 f1 3/2 X f/2)
b) Supercritical flow
If y1 is in supercritical flow condition then depth of flow will increase due to reduction in specific energy.
At Yc
▲Z = ▲Zm
Or
▲Z >▲Zm
The death over hump y2=YC will remain constant and upstream
Depth y1 will change. It will degrees to have higher specific energy.
2.3.2 Flow through Horizontal Contractions
Consider a frictionless horizontal channel of width B1 carrying discharge Q at depth Y1. At section 2 in the channel width is constricted to B2 by smooth transition. There is no energy loss, the specific energy at section 1 is equal to specific energy at section 2.
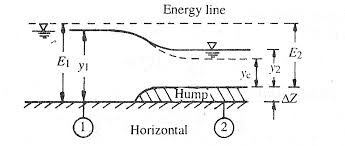
Fig.2.10: Contraction diagram
E1 = Y1 + V12/2g = Y1 + Q2/2gB12Y12
E2 = Y2 + V22/2g = Y2 + Q2/2gB22Y22
At Section 1 -------q1 = Q/B1
At Section 2 -------q2 = Q/B2
Since B2< B1 so, q2> q1
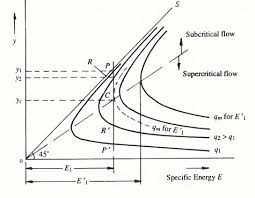
Fig.2.11: Specific energy diagram
In Specific energy diagram,
P on the curve q1 corresponds to death Y1& specific energy E1.
At section 2, E1 = E1 and q= q2, here the point P will move vertically downward to point R on the curve to reach depth Y2.
If B2 is smaller, q2 will increase, and Y2 will decrease.
When B2 is contracted till its last limit B2 = B2min, then discharge intensity is maximum, q2 = q2max; critical flow conditions prevailed.
At B2 = B2min,
Y2 = critical depth at section 2
E1 = Emin = Yc + Q2/2g (B2min) 2 Yc2
For rectangular channel at critical depth:
Yc = 2/3 Ec
But as E1 = Ec
Y = Yc = 2/3 Ec = 2/3 E1
Yc = (Q2/ (B2min) 2)1/3 or B2min = (Q2/gYc) 1/2
B2min = (27 Q2/ 8g E13) ½ Put Yc = 2/3 E1
If B2 < B2min, the discharge intensity will be larger than qmax.
Now, the death will have to increase to Y1 so that
E1’ = Y1’ + Q2/2g B12Y12 --------is formed which will be sufficient to cause critical flow section 2.
Now critical depth is given by
Yc2 = (Q2/ B22g) 1/3 = (q22/g) 1/3
Ec2 = Yc2 + Vc 22/2g = 1.5
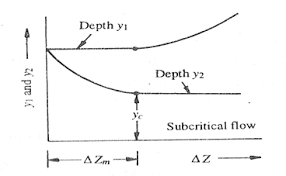
Fig.2.12: Energy depth diagram
As B2< B2min, Yc2 will be larger than Yc also,
E1'= Ec2 = 1.5 Yc2
Depth at section 2 is not constant but increases as Y1' and hence E1' rises.
Dynamic equation of gradually varied flow:
Consider B width of wide regular channel and y is the depth of flow
Mean hydraulic radius 
By manning’s formula
 ------1

Manning’s constant n is assumed same for uniform and non-uniform flow
Dividing equation 1 to 2 we get

We know that 
For wide channel

Substituting equation 4, we get

This is dynamic equation of GVF in a wide channel.
Key Takeaways
Gradually Varied Flow: When the change of the fluid depth Along the channel dy/dx is much less than one.
Classifications of Surface Profile:
Mild slope:
Mild Slope is less than the critical slope and the normal depth is greater than critical depth (yn>yc). The flow is subcritical and controlled downstream. M1 profiles are common where mild slope streams enter a pool. M2 profiles can occur upstream of a sudden enlargement in a channel or where the slope becomes steeper.
Mild Slope is less than the critical slope and the normal depth is greater than critical depth (yn>yc). The flow is subcritical and controlled downstream.M1 profiles are common where mild slope streams enter a pool.M2 profiles can occur upstream of a sudden enlargement in a channel or where the slope becomes steeper.
Horizontal Slope:
The normal depth  is not defined in a horizontal bed channel, it may be less than
  or greater than
 , and such slope of water surface is called as horizontal slope profile.
Critical Slope:
Critical slope is a key parameter occurring in the analysis of varied flow in open channels. The analysis of varied flow under various operating conditions is required for design of canals.
When  then the flow is known as critical flow and slope is called as critical slope.
Steep Slope:
When , then the flow is known as rapid flow and slop of free water surface is known as steep slope profile.
CHUTE is a channel having steep slopes. These Kinds of Open Channel DROP is similar to a chute, but the change in elevation is affected in a short distance.
Adverse Slope:
When the slope of the channel is increase in the direction of flow. The slope of water at bottom is called as adverse slope.
When  , then the slope is adverse slope.
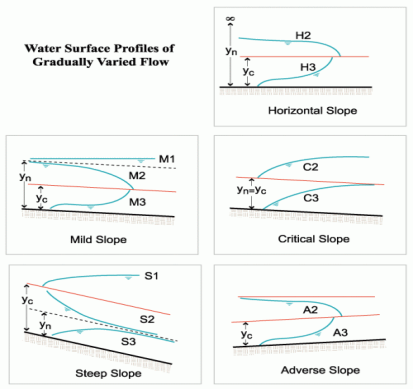
Fig.2.13: Water surface profile of gradually varied flow
Characteristics of Surface Profile:
a) Normal depth ( ): Normal depth is the depth of flow in a channel or culvert when the slope of the water surface and channel bottom is the same and the water depth remains constant. Normal depth occurs when gravitational force of the water is equal to the friction drag along the culvert and there is no acceleration of flow. It is depth of water in the channel when discharge Q is under uniform flow.
b) Critical depth ( ): Critical depth is defined as the depth of flow where energy is at a minimum for a particular discharge. Critical depth is a quantity of fundamental importance to understanding the flow characteristics. If the actual depth is greater than critical depth, then the flow is considered "subcritical". Subcritical flow is "slow flow" and is impacted by downstream conditions.
c) Actual depth ( ): The actual depth of flow is the depth of channel measured normal to the direction of flow. Normal depth is the particular depth for which the channel has uniform flow for a given slope and discharge. It is the depth of water in the channel when discharge Q.
Key Takeaways
- Chute: This type of spillways carries supercritical flow through the steep slope of an open channel flow.
- Critical Depth: The variation of specific energy with depth at a constant discharge shows a minimum specific energy.
2.6.1 Analytical Method
Analytical method for computation of water surface profile is applicable for a very wide rectangular channel.
A very common method of open-channel flow involves the use of a hydraulic structure such as a weir or flume. Measuring flow into a reservoir is a common application where open-channel flow measurement comes into play. Open-channel flow occurs when liquid flows in a conduit or channel with a free surface.
The energy equation is the base for all methods of steady, gradually varied flow computations in open channels. Assuming abscissa x directed opposite the flow.
Z +  - z + dz +
  – sdx
– sdx
Where, z– water surface elevation, α–coefficient, v– mean velocity in a cross-section, g–gravity, S– energy line slope (hydraulic slope), original integral one:
 +
+  –
–
Where, z1 and z2are elevations and v1 and v2are mean velocities in cross-sections positioned at x1and x2 respectively.
Considering the rectangular bed cross-section, Eq. (1) can be written as follows:
 -
-
Where, h is depth, hc – critical depth, S0– bed slope. Solution of Eq. (3) requires specification for the energy loss function. Assuming the concept of the infinitely wide channel with a constant bed slope as a base for further considerations, at constant value of Chezy’s coefficient where the normal depth [m], while Manning’s approach leads to the equation:
 = -
= -
The analytical solution of Eq. (4) is known as the Bresse formula which is for the given initial condition (x0, h0) and at the following denotations:
 = y,
= y,  =
=  =
= 
2.6.2 Graphical Method
Graphical method of computation of water surface is very useful method.
It is used for both prismatic as non-prismatic channel.
Using differential equation of GVF,
 =
= 
For a given discharge Q, channel shape parameter A, T and  are the function of depth of flow y.
We can write dx = f(y) dy
Consider depth of flow  and
and  at a distance
  and
and  from the control section, then
( -
-  ) =
) =  =
= 
Several values of d are assumed and corresponding value of f(y) is calculated.
A curve of h versus f(y) is the plotted.
The area under this curve between y =  and y =
  is then calculated.
The longitudinal distance between two points  and
and  is then determined.
If  and
and  are very close to each other, then
( ) =
) = 

Fig.2.14: Computation of Water Surface Profile by Numerical Approach.
In this method the length of channel is divided into number of short reaches and the computations are carried out step by step from one end of the reach to the other.
Consider a short reach of channel of length dx between section 1-1 and 2-2 as shown in fig.
Applying Bernoulli’s Equation,
 +
+  +
+  =
=  +
+  +
+  +
+ 

( -
-  ) = (
) = ( -
-  ) +
) + 
Slope of bed  =
= 
( -
-  ) = dx
Slope of energy line  =
= 
Dx( -
-  ) =
) = 
Dx = 
This equation is used for step method of integration. Using the equation of above are computed and total length of curve x =  +
+  +
+  + ....... Is obtained.
The computations are carried out in the upstream direction in case of subcritical flow and downstream direction if the flow is supercritical.
This method is very simple, by choosing proper number of steps, the accuracy of the method can be controlled to the desired degree.
2.6.3 Numerical Method
- Calculate area of section A, velocity of head, to find specific energy
- Calculate average velocity, velocity of head, to find specific energy.
- Slope of energy line by Chezy’s formula or Manning’s formula.
- Assume new depth at another section. This section should be close to the first section and the increment in d should be small. Compute all the quantities for this new depth as in step, step2, step3.
- Compute change in energy from E1 to E2.
- The value of energy gradient in equation which is taken as average of energy slope at the two sections 1-1 and 2-2.
- Compute difference between bed slope and average energy slope.
- Compute length of the curve between two section dx.
- Repeat the computation from reach to reach, till the required depth at the other end is reached.
Key Takeaway
Weir: It is basically an obstruction in the flow path.
2.7.1 Venturi Flume
Venturi flume is device in which the velocity of flow at at that throat is less than the critical velocity, so that no standing wave will occur in the flume.
It is the artificial hydraulic structure constructed in an open channel.
Consider A, B, H, V and a, b, b, v are the area of section, width, depth of flow and velocities at entrance of flume and at the throat respectively.
At the throat, the velocity is increase due to reduction in channel cross-section, which will lead to drop in water level at the throat.
By Continuity equation,
Q = AV = av
V =  v
v
By Bernoulli’s equation,
H +  = h +
= h + 
 -
-  = H - h
 -
-  = 2g(H - h)
 –
–  = 2g (H – h)
 = 2g (H – h)
 -
-  = 2g (H – h)
v = 
Theoretical Discharge  = av = aA
Where  = Coefficient of discharge
Key Takeaway
Venturi Flume: - These are provided to measure flow rate in open channel flow.
2.7.2 Standing Wave Flume
- Modular Flume or standing flume is a device in which the velocity of flow at the throat is greater than the critical velocity, resulting in the formation of standing wave in the flume.
- In this type of venture-flume, the value of b and h are decrease upto critical depth. Therefore, velocity of throat will be equal to critical velocity.
- Downstream of throat section is followed by flared transition section design to restore the stream to its original width.
- Since the velocity of throat is greater than the critical velocity, the depth of flow at a section upstream remains unaffected by variations in the downstream depth until the downstream depth become greater than about 0.7 of the upstream depth.
- The discharge through a standing wave flume is the function of only depth of flow H and it is expressed by the relationship.
Q = 
Where, b = width of throat
 = coefficient of discharge of flume = 1.706
Key Takeaways
Modular Flume: These are also used to measure flow rate in open channel flow.
2.7.3 Parshall Flume
- The Parshall flume is an open channel flow metering device that was developed to measure the flow of surface waters and irrigation flows. The Parshall flume is a fixed hydraulic structure. It is used to measure volumetric flow rate in industrial discharges, municipal sewer lines, and influent/effluent flows in wastewater treatment plants.
- The Parshall flume accelerates flow through a contraction of both the parallel sidewalls and a drop in the floor at the flume throat. Under free-flow conditions the depth of water at specified location upstream of the flume throat can be converted to a rate of flow. Some states specify the use of Parshall flumes, by law, for certain situations (commonly water rights).
- The design of the Parshall flume is standardized under ASTM D1941, ISO 9826:1992, and JIS B7553-1993. The flumes are not patented and the discharge tables are not copyright protected.
- A total of 22 standard sizes of Parshall flumes have been developed, covering flow ranges from 0.005–3,280 cfs (0.1416–92,890 l/s).
- Submergence transitions for Parshall flumes range from 50% (1–3 in sizes) to 80% (10–50 ft sizes), beyond which point level measurements must be taken at both the primary and secondary points of measurement and a submergence correction must be applied to the flow equations. It is important to note that the secondary point of measurement (Hb) for a Parshall flume is located in the throat, measuring Hb can be difficult as flow in the throat of the flume is turbulent and prone to fluctuations in the water level. 90% is viewed as the upper limit for which corrections for submerged flow are practical.
- Under laboratory conditions Parshall flumes can be expected to exhibit accuracies to within ±2%, although field conditions make accuracies better than 5% doubtful. A modified version of the Venturi flume is the Parshall flume. Named after it creator, Dr. Ralph L. Parshall of the U.S. Soil Conservation Service, the Parshall flume is a fixed hydraulic structure used in measuring volumetric flow rate in surface water, wastewater treatment plant, and industrial discharge applications. The Parshall flume accelerates flow through a contraction of both the parallel sidewalls and a drop in the floor the flume throat. Under free-flow conditions the depth of water at specified location upstream of the flume throat can be converted to a rate of flow. The free-flow discharge can be summarized as Q = C

Where,
Q is flow rate
C is the free-flow coefficient for the flume
H is the head at the primary point of measurement
n varies with flume size
- When the downstream depth is high enough that the transition to subcritical flow advances upstream into the throat and the hydraulic jump disappears, the flume is operating in a "submerged flow" regime, and the discharge is instead given by
Q = C –
– 
- Where,
 is the submergence correction, and is found using pre-determined tables for a particular flume geometry.
- The Parshall flume is an empirically calibrated device, so interpolation between listed sizes is not an accurate way to make intermediate size flumes. The flumes are not scale models of each other. 22 standard sizes of Parshall flumes have been developed, covering flow ranges from 0.005 cfs [0.1416 l/s] to 3,280 cfs [92,890 l/s].
- Submergence transitions for Parshall flumes range from 50% (1–3 in sizes) to 80% (10–50 ft sizes),[6] beyond which point level measurements must be taken at both the primary and secondary points of measurement and a submergence correction must be applied to the flow equations.
- Under laboratory conditions Parshall flumes can be expected to exhibit accuracies to within ±2%, although field conditions make accuracies better than 5% doubtful.
- Not all Parshall flumes have the energy-recovering divergence section. These flumes, called Montana flumes, or short section Parshall flumes, must instead have a free-spilling discharge at all expected flow rates, which increases the drop along the whole flume system. The measurement calculations are the same as for free-flow in a standard Parshall flume, but submerged flow cannot be adjusted for.
- Differences between the Venturi and Parshall flume include: reduction of the inlet converging angle, lengthening the throat section, reduction of the discharge divergence angle, and introducing a drop through the throat (and subsequent partial recovery in the discharge section).
Key Takeaways
- Parshall Flume: It is fixed hydraulic structure used to measure flow rate in open channel.
- Throat: The width at the entry of the flume is known as throat.
2.7.4 Broad Crested Weir
Broad crested weirs are robust structures that are generally constructed from reinforced concrete and which usually span the full width of the channel. They are used to measure the discharge of rivers, and are much more suited for this purpose than the relatively flimsy sharp crested weirs.
Function:
Commonly, weirs are used to prevent flooding, measure water discharge, and help render rivers more navigable by boat. In some locations, the terms dam and weir are synonymous, but normally there is a clear distinction made between the structures. Usually, a dam is designed specifically to impound water behind a wall, whilst a weir is designed to alter the river flow characteristics.
A common distinction between dams and weirs is that water flows over the top (crest) of a weir or underneath it for at least some of its length. Accordingly, the crest of an overflow spillway on a large dam may therefore be referred to as a weir. Weirs can vary in size both horizontally and vertically, with the smallest being only a few inches in height whilst the largest may be many meters tall and hundreds of meters long. Some common weir purposes are outlined below.
Flow measurement:
Weirs are allows hydrologists and engineers a simple method of measuring the volumetric flow rate in small to medium-sized streams/rivers or in industrial discharge locations. Since the geometry of the top of the weir is known and all water flows over the weir, the depth of water behind the weir can be converted to a rate of flow. However, this can only be achieved in locations where all water flows over the top of the weir crest (as opposed to around the sides or through conduits or sluices) and at locations where the water that flows over the crest is carried away from the structure. If these conditions are not met, it can make flow measurement complicated, inaccurate, or even impossible.
The discharge calculation can be summarized as:
Q = 
Where:
- Q is the volumetric flow rate of fluid (the discharge)
- C is the flow coefficient for the structure (on average a figure of 0.62).
- L is the width of the crest
- H is the height of head of water over the crest
- n varies with structure (e.g., 3/2 for horizontal weir, 5/2 for v-notch weir) However, this calculation is a generic relationship and specific calculations are available for the many different types of weir. Flow measurement weirs must be well maintained if they are to remain accurate.
Key Takeaway
Broad Crested Weir: It is widely used to measure flow rates and regulation of water depth in river canals.
2.7.5 Current Meter
The current velocity meter allows you to measure stream flow velocity in feet or meters per second and measure water depth in hundredths of a foot up to three feet. The average stream flow velocity times the cross-sectional area of the stream determines the stream flow measurement in cubic feet or meters per second.
The current meter is used to measure water velocity at predetermined points (subsections) along a marked line, suspended cableway, or bridge across a river or stream. The depth of the water is also measured at each point.
The velocity of flow at any point in the open channel can be most accurately and conveniently determined by means of a mechanical device named current-meter. Current-meter of common use may be classified in two categories according to the type of revolving part used.
Figures 15.6 and 15.7 give clear idea about two types of current-meters. In Fig. 15.6 Price current-meter is shown in which a wheel of conical cups (6 to 8) is mounted on arms of a vertical axis. In Fig. 15.7 Amsler current-meter is shown in which a series of helicoidal vanes is mounted on a horizontal axis.
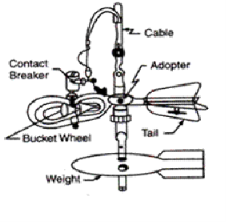
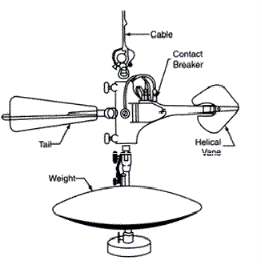
Fig.2.15: Current Meter
The first type of current-meter is better in the following respects:
i. Frictional resistance is usually less.
Ii. It starts working even in a current of small velocity.
Iii. It does not revolve too rapidly under high velocity flow.
Iv. It tends to measure full velocity of flow even if it is not oriented very accurately.
v. In turbulent flow it over-registers the velocity. On the other hand, propeller type current meter under registers velocities by about same amount.
Only disadvantages of conical type current-meter are that while lowering the cup wheel starts rotating even if the water is still.
The current-meter with conical cups is more popular because of its accuracy and efficient working.
In principle the working of the two types is based on the same theory and can be outlined as mentioned below:
Working of Current-Meters:
When the meter is lowered in water and when it faces the current of water in the channel the wheel rotates. To keep the meter facing the direction of flow a tail is attached. This tail aligns the meter in the direction of flow. The meter is also fitted with a streamlined weight (fish weight) which keeps the meter in a vertical position. The rate of rotation of the wheel depends on the velocity of flow. A dry battery is kept on the shore or in a boat and an electric current is passed to the wheel from it. A commutator is fixed to the shaft of the revolving wheel.
It makes and breaks the contact in an electrical circuit at each revolution. An automatic revolution counter is kept in the boat or on the shore with the battery which registers the revolutions. When an electric circuit is broken an electric bell in the boat rings or a head phone m the boat buzzes. Then the time taken for a required number of revolutions may be noted. The velocity of flow can be read from a rating table. The rating table is always provided with the meter.
Rating of Current-Meter:
The speed of rotation of the cup wheel is a function of the velocity of flow. The cup wheel rotates due to relative velocity between water and the cup wheel. This fact is utilized in calibration of the current-meter. Current-meter is rated in a long tank (say 150 m long) with sectional area 4 m x 2.5 m. On both sides of the tank rails are provided.
A trolley runs over the rails with known velocities. Generally, equipment is provided on the trolley to automatically record the current-meter revolutions, time and distance travelled.
A current-meter is lowered in the still water of the tank from the trolley by a suspension rod. The trolley is run over the tank at different known velocities for number of times. The number of rotations of the current-meter cup wheel for various velocities is noted.
From the readings a rating curve is prepared. It comes out to be a straight line and the equation is of the form V = M R + C where V is velocity, R is revolutions of cup wheel per second and M and C are constants. Every current-meter whether new or old should be rated before putting it into use. In addition, it is essential to calibrate every current-meter periodically.
Methods of Supporting Current-Meters:
So far as possible the current-meter should be suspended in the similar way as it done for ratings. When the depth of water in the channel is more, the current-meter is suspended by means of a fine cable or a wire rope and lowered to the required depth.
The boat is moored to the wire rope which is stretched across the river, at the determined point in the river. When the channel carries water at shallow depths the suspension cable and the weight is removed and the current-meter is mounted on a wading rod. The rod is made to rest on the channel bed at required position for taking measurements. In this method as the water is shallow boat is not required. The current-meter may be fixed at any depth on the wading rod for observing velocity.
Methods of Measuring Velocity:
When the velocity is measured by the current-meter at 0.5 D then to get mean velocity of the section the observed velocity should be multiplied with a coefficient 0.96. Alternatively, to obtain mean velocity of flow at a particular section, velocities may be observed at 0.2 and 0.8 of depth from water surface.
The mean of these two readings gives mean velocity of flow at that section. Generally mean velocity of flow at a section is obtained by keeping the meter at 0.6 B. In the observed velocity corrections are made for any obliquity of the current with the cross-section line and also for drift. It is necessary to conduct vertical velocity distribution experiment at each site to decide point of average velocity.
Key Takeaway
Current meter: It is the discharge measurement device.
2.7.6 Floats
A subsurface float consists of a submerged float attached to a surface float by an adjustable line and it measures directly the mean velocity. The float method is used especially in the measurement of flood discharge where excessive velocities, depths and floating debris prohibit the use of other methods.
This method measures surface velocity. Mean velocity is obtained using a correction factor. The basic idea is to measure the time that it takes the object to float a specified distance downstream, velocity V = travel distance/ travel time because surface velocities are typically higher than mean or average velocity.
- V mean = k V surface where k is a coefficient that generally ranges from 0.66 to 0.75, depending on channel depth.
- Choose a suitable straight reach with minimum turbulence (ideally at least 3 channel widths long).
- Mark the start and end point of your reach.
- If possible, travel time should exceed 20 seconds.
- Drop your object into the stream upstream of your upstream marker. Start the watch when the object crosses the upstream marker and stop the watch when it crosses the downstream marker.
- You should repeat the measurement at least 3 times and use the average in further calculations.
Key Takeaway
Float: This involves measuring the surface velocity of the water with a floating object.
References:
- Chow, V.T. “Open Channel hydraulics” McGraw Hill Publication
- Subramanya, K., Flow through Open Channels, TMH, New Delhi
- Ranga Raju, K.G., Flow through open channels, T.M.H. New Delhi
- Rajesh Srivastava, Flow through Open Channels, Oxford University Press
- Streeter, V.L.& White E.B.,” Fluid Mechanics” McGraw Hill Publication
- Modi & Seth “Hydraulics & Fluid Mechanics” Standard Publications.
- RK Bansal “Fluid Mechanics and Hydraulic Machines” Laxmi Publication
- AK Jain “Fluid Mechanics” Khanna Publication.
- Houghtalen, “Fundamentals of Hydraulics Engineering Systems” 4/e Pearson Education, Noida