Unit - 1
Digital Image Fundamentals
The basic steps in a digital image processing system are stated below;
1) Image Acquisition
2) Image Storage
3) Image Processing
4) Display
5) Transmission
Let us look at each one in detail
1) Image Acquisition:
Image Acquisition is the first step in any image processing system. The general aim of image acquisition is to transform an optical image into an array of numerical data which could be later manipulated on a computer.
Now image acquisition is achieved using the correct visual perception devices for different applications. For example, if we need an X-ray we can use an X-ray sensitive camera. For our normal images, we use a camera that is sensitive to the visual spectrum.
2) Image Storage:
All video signals are essentially in the analog form i.e., Electrical signals convey luminance and color with continuous variable voltage. The cameras alter the interfaced image to a computer where the processing algorithm is written.
3) Image Processing:
Systems ranging from microphones to general-purpose large computers are used in image processing. Dedicated image processing systems connected to host computers are very popular. The processing of digital images involves procedures that are usually expressed in algorithmic forms due to which most image processing functions are implemented in software.
4) Display
A display device produces and shows a visual form of numerical values stored in a computer as an image array. Principal display devices are printers, TV monitors, CRTs, etc. Any erasable raster graphics display can be used as a display unit with an image processing system. However, monochrome and color TV monitors are the principal display devices used in the modern image processing system.
5) Transmission
There are a lot of applications where we need to transmit images. Image transmission is the process of encoding, transmitting, and decoding the digitized data representing an image.
Key takeaway
The basic steps in a digital image processing system are stated below;
1) Image Acquisition
2) Image Storage
3) Image Processing
4) Display
5) Transmission
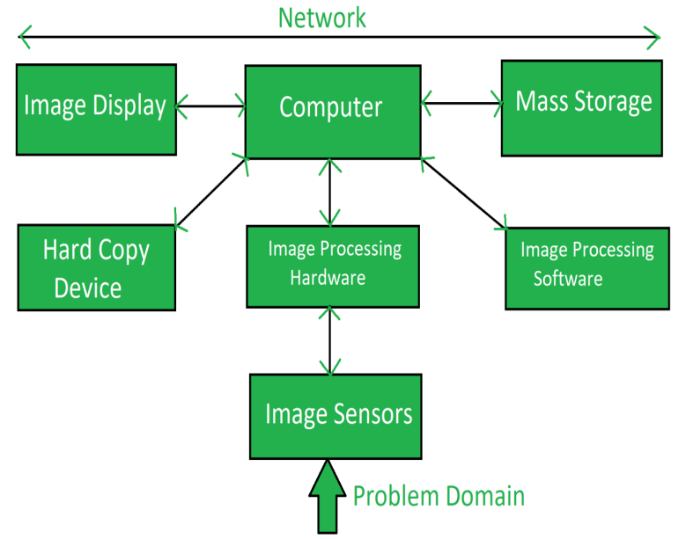
An image Processing System is the combination of the different elements involved in digital image processing. Digital image processing is the processing of an image through a digital computer. Digital image processing uses different computer algorithms to perform image processing on digital images.
It consists of the following components: -
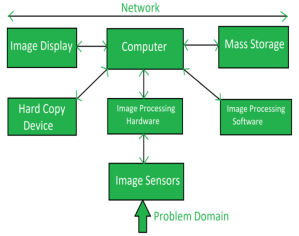
Fig 1 - Components
Image sensors sense the intensity, amplitude, co-ordinates, and other features of the images and pass the result to the image processing hardware. It includes the problem domain.
Image processing hardware is the dedicated hardware that is used to process the instructions obtained from the image sensors. It passes the result to a general-purpose computer.
The computer used in the image processing system is the general-purpose computer that is used by us in our daily life.
Image processing software is the software that includes all the mechanisms and algorithms that are used in the image processing system.
Mass storage stores the pixels of the images during the processing.
Once the image is processed then it is stored in the hard copy device. It can be a pen drive or any external ROM device.
It includes the monitor or display screen that displays the processed images.
The network is the connection of all the above elements of the image processing system.
Key takeaway
An image Processing System is the combination of the different elements involved in digital image processing. Digital image processing is the processing of an image through a digital computer. Digital image processing uses different computer algorithms to perform image processing on digital images.
Human Intuition and analysis play a central role in the choice of techniques of digital image processing. Hence developing a basic understanding of human visual perception is the first step. Factors such as how human and electronic imaging devices compare in terms of resolution and ability to adapt to changes to illumination are not only interesting but are also important from a practical point of view
1.3.1 Structure of Human Eye
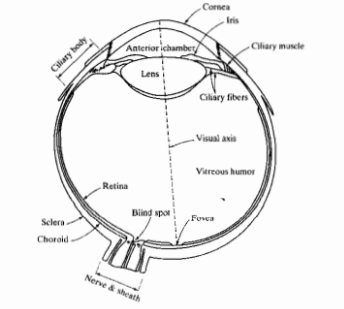
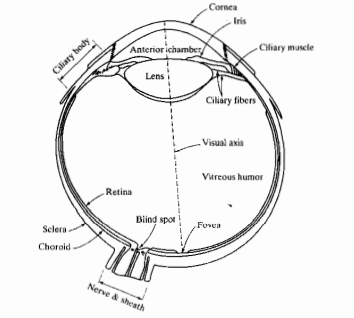
Fig 2 The simplified cross-section of a human eye
Figure 2 shows a simple cross-section of the human eye. The eye is nearly a sphere with an average diameter of approximately 20mm. Three membranes enclose the eye; the cornea and sclera outer cover, the choroid, and the retina. The cornea is a tough, transparent tissue that covers the anterior surface of the eye. Continuous with the cornea, the sclera is an opaque membrane that encloses the remaining the optic globe
The choroid lies directly below the sclera. This membrane contains a network of blood vessels that serve as the major source of nutrition for the eye. At the anterior extreme, the choroid is divided into the ciliary body and iris. The iris contracts or expands to control the amount of light entering the eye.
The lens is made up of concentric layers of fibrous cells and is suspended by fibers that attach to the ciliary body.
The innermost membrane of the eye is the retina, which lines the inside of the wall’s entire posterior portion. When an eye is properly focused light from an object outside the eye is imaged on the retina. The pattern vision is afforded by the distribution of discrete light receptors over the surface of the retina. There are two classes of receptors cones and rods.
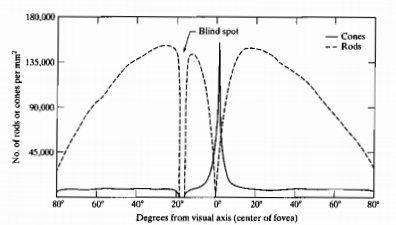
Fig 1.2 shows the density of rods and cones for a cross-section of the right eye passing through the region of the emergence of the optic nerve from the eye. The absence of receptors in this area results in a blind spot.
Except for this region, the distribution of receptors is radially symmetric about the fovea.
The fovea is a circular indention in the retina of about 1.5mm in diameter.
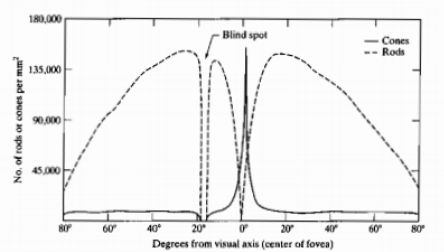
Fig 3 Distribution of rods and cones in Retina
1.3.2 Image Formation in the Eye
In an ordinary camera, the lens has a fixed focal length, and focusing at various distances is achieved by varying the distances between the lens and the imaging plane where the film is located. In the human eye, however, the opposite is true. The distance between the lens and imaging region is fixed and the focal length needed to achieve proper focus is obtained by varying the shape of the lens. The fibers in the ciliary body accomplish this flattening or thickening the lens for distance or near objects respectively. The distance between the center of the lens and the retina along the visual axis is approximately 17mm. The range of focal length is approximately 14mm to 17mm.
The geometry in Fig 4 illustrates how to obtain the dimensions of an image formed on the retina.

Fig 4 Graphical Representation of an eye looking at the palm tree
Key takeaway
Human Intuition and analysis play a central role in the choice of techniques of digital image processing. Hence developing a basic understanding of human visual perception is the first step. Factors such as how human and electronic imaging devices compare in terms of resolution and ability to adapt to changes to illumination are not only interesting but are also important from a practical point of view
Most of the images in which we are interested are generated by the combination of an “illumination” source and the reflection of energy from that source by the elements of the scene being imaged. We enclose illumination and scene in quotes to emphasize the fact that they are considered more general than the familiar situation in which a visible light source illuminates a common everyday 3-D scene. For example, the illumination may originate from a source of electromagnetic energy such as radar, infrared, or X-ray system. But, as noted earlier it could originate from less traditional sources such as ultrasound or even a computer-generated illumination pattern. Similarly, the scene elements could be familiar objects, but they can Justas easily be molecules buried in rock formations or a human brain. Depending on the nature of the source, illumination energy is reflected from a transmitted through objects. An example is the first category is light reflected from a planar surface. An example is the second category is when X-rays pass through the patient’s body to generate a diagnostic X-ray film. In some applications, the reflected o transmitted energy is focused onto a photo converter which converts the energy into visible light.
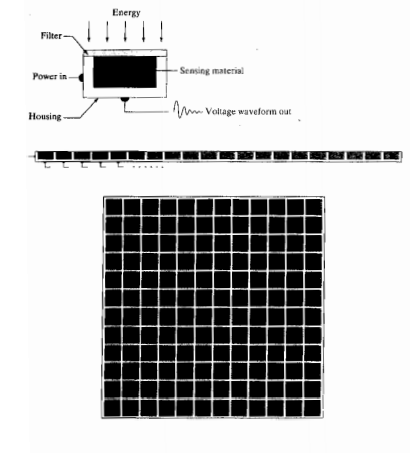
Fig 5 (a, b, c) shows three principle arrangement used to transform illumination energy into digital images. The idea is simple, incoming energy s transformed into a voltage by the combination of input electrical power and sensor material that is responsive to the particular type of energy being detected. The output voltage waveform is the response of the sensors and a digital quantity is obtained from each sensor by digitizing its response.
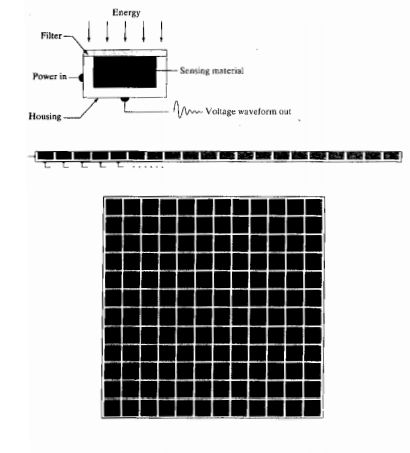
Fig 5 a Single Imaging Sensor
b Line Sensor
c Array Sensor
Key takeaway
Most of the images in which we are interested are generated by the combination of an “illumination” source and the reflection of energy from that source by the elements of the scene being imaged. We enclose illumination and scene in quotes to emphasize the fact that they are considered more general than the familiar situation in which a visible light source illuminates a common everyday 3-D scene. For example, the illumination may originate from a source of electromagnetic energy such as radar, infrared, or X-ray system. But, as noted earlier it could originate from less traditional sources such as ultrasound or even a computer-generated illumination pattern. Similarly, the scene elements could be familiar objects, but they can Justas easily be molecules buried in rock formations or a human brain. Depending on the nature of the source, illumination energy is reflected from a transmitted through objects.
An image is a 2D representation of the 3D world. Images can be acquired using a vidicon or a CCD camera or using scanners. The basic requirement for image processing is that images obtained to be in digital format. For example, one cannot work with or process photographs on identity cards unless he/she scans them using a scanner.
The scanner digitizes the photograph and stores it on the hard disk of the computer. Once this is done, one can use image processing techniques to modify the image as per the requirement. In Vidicon too, the output which is in analog form needs to be digitized to work with the images. To cut long story short, to perform image processing we need to have the images on the computer. This will only be possible when we have digitized the analog pictures.
Now that we have understood the importance of digitization, let us see what this term means.
The process of digitization involves two steps:
1) Sampling
2) Quantization
That means, Digitization=Sampling+Quantization
The values obtained by sampling a continuous function usually comprise an infinite set of real numbers lining from a minimum to maximum depending upon the sensor calibration. These values must be represented by a finite number of bits usually used by a computer to store or process data. In practice, the sampled signal values are represented by a finite set of an integer values. This is known as quantization. The rounding of a number is a simple example of quantization.
With these concepts of sampling and quantization, we now need to understand what these terms mean when we look at an image on the computer monitor.
The higher the special resolution of the image, the greater the sampling rate i.e., lower is the image area. Similarly, the higher the grey level resolution more the number of quantized levels.
Key takeaway
An image is a 2D representation of the 3D world. Images can be acquired using a vidicon or a CCD camera or using scanners. The basic requirement for image processing is that images obtained to be in digital format. For example, one cannot work with or process photographs on identity cards unless he/she scans them using a scanner.
The scanner digitizes the photograph and stores it on the hard disk of the computer. Once this is done, one can use image processing techniques to modify the image as per the requirement. In Vidicon too, the output which is in analog form needs to be digitized to work with the images. To cut long story short, to perform image processing we need to have the images on the computer. This will only be possible when we have digitized the analog pictures.
Consider a pixel p (x, y). This pixel p has two horizontal and two vertical neighbors. This set of four pixels is known as 4 neighbourhood of pixel p (x, y) where each pixel is said to be at a unit distance from p (x, y). This set of pixels is denoted as N4(p).
N4 (p)
Similarly, apart from these 4 neighbours there are another four diagonal pixels that touch P (x, y) at corners ND(p). This set of eight pixels is called 8 neighbourhood of p (x, y) and is denoted as N8(p)
To establish if the two pixels are connected or not it must be determined if they are neighbours and if their grey levels satisfy specific criteria.
ND (p)
Key takeaway
Consider a pixel p (x, y). This pixel p has two horizontal and two vertical neighbors. This set of four pixels is known as 4 neighbourhood of pixel p (x, y) where each pixel is said to be at a unit distance from p (x, y). This set of pixels is denoted as N4(p).
The use of color in image processing is motivated by two principal factors. The first color is a powerful descriptor that often simplifies object identification and extraction from a scene. Second, humans can discern thousands of color shades and intensities compared to about only two dozens of shades of gray. This second factor is particularly important in manual image analysis.
Color image processing is divided into two major areas; full color and pseudo color processing. In the first category, the images in question typically are acquired with a full-color sensor such as a color TV camera or color scanner. In the second category, the problem is one assigning a color to a particular monochrome intensity or range of intensities. Until relatively recently most digital color image processing was done at the pseudo color level.
Key takeaway
The use of color in image processing is motivated by two principal factors. The first color is a powerful descriptor that often simplifies object identification and extraction from a scene. Second, humans can discern thousands of color shades and intensities compared to about only two dozens of shades of gray. This second factor is particularly important in manual image analysis.
Color image processing is divided into two major areas; full color and pseudo color processing.
The purpose of the color model is to facilitate the specification of colors in some standard generally accepted way. In essence, a color model is a specification of a coordinate system and a subspace within that system where each color is separated by a single point.
1.8.1 The RGB Color model
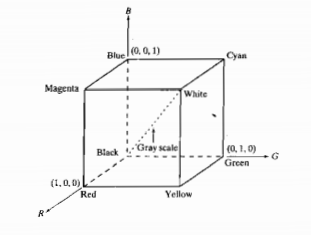
In the RBG Color model, each color appears in its primary spectral components of red-green, and blue. This model is based on a Cartesian coordinate system. In this model, the grayscale extends from black to white along the line joining these two points. The different colors in this model are points on or inside the cube and are defined by vectors extending from the origin. For convenience, the assumption is that all color values have been normalized so that the cube shown in fig 6 is the unite cube. That is all the values of RG&B are assumed to be in the range [0,1]
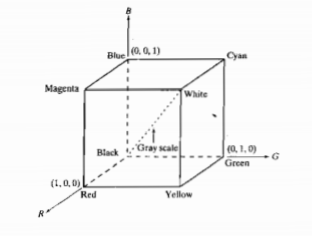
Fig 6 Schematic of RGB Colour Cube
The image represented in the RGB color model consists of three component images one for each primary color. When fed into an RGB monitor these three images combine on the screen to produce a composite color image.
1.8.2 HSI color model
When humans view color objects, we describe them by hue, saturation, and brightness. Brightness is a subjective descriptor whereas saturation gives a measure of the degree to which pure color is diluted by white light. And hue is a color attribute that describes a pure color. HIS model is considered as an ideal tool for developing image processing algorithms based on color descriptions that are natural and intuitive to humans who after all are the developers and users of these algorithms. We can say that RGB is ideal for image color generation but its use for color description is much more limited.
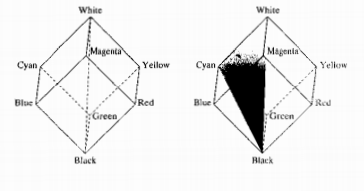
Fig 7 Conceptual Relationship between RGB and HIS color model
Key takeaway
The purpose of the color model is to facilitate the specification of colors in some standard generally accepted way. In essence, a color model is a specification of a coordinate system and a subspace within that system where each color is separated by a single point.
Image Transforms
Many times, image processing tasks are best performed in that of a domain other than the spatial domain.
Key steps:
(1) Transform the image
(2) Carry the task(s) in the transformed domain.
(3) Apply inverse transform to return to the spatial domain
Fourier series Theorem
Any periodic function f(t) can be expressed as a weighted sum (infinite) of sine and

Discrete Fourier Transform (DFT)
Forward DFT

Inverse DFT

Discrete Cosine Transform
A discrete cosine transform (DCT) expresses as a finite sequence of that of the data points in terms of a sum of cosine functions oscillating at the different frequencies.
DCT is a Fourier-related transform same as that of the discrete Fourier transform (DFT), but using only real numbers. DCTs are equivalent to DFTs of roughly twice the length, operating on the real data with even symmetry. Types of DCT are listed below with eleven samples.
Key takeaway
Many times, image processing tasks are best performed in that of a domain other than the spatial domain.
References:
1. Rafael C. Gonzalez, Richard E. Woods, Digital Image Processing Pearson, Third Edition, 2010
2. Anil K. Jain, Fundamentals of Digital Image Processing Pearson, 2002.
3. Kenneth R. Castleman, Digital Image Processing Pearson, 2006.
4. Rafael C. Gonzalez, Richard E. Woods, Steven Eddins, Digital Image Processing using MATLAB Pearson Education, Inc., 2011.
5. D, E. Dudgeon, and RM. Mersereau, Multidimensional Digital Signal Processing Prentice Hall Professional Technical Reference, 1990.
6. William K. Pratt, Digital Image Processing John Wiley, New York, 2002
7. Milan Sonka et al Image processing, analysis and machine vision Brookes/Cole, Vikas Publishing House, 2nd edition, 1999