Unit 4
Introduction to radar
Radio detection and Ranging is called RADAR. It is a system that uses radio waves to detect and to fix the position of objects or targets at a distance. The radar was developed during world war II. The system utilizes the fact that electromagnetic waves are reflected from objects. If a radio wave encounters a sudden change in the conductivity, permittivity, or permeability in the medium a part of the electromagnetic energy is absorbed by the second medium and is reradiated.
This sudden change in the electrical property of the medium then constitutes the target. This re-radiated energy on being received back at the radar station gives information about the location of a target. For the satisfactory location of the target, the power received back must be appreciable. There are two categories of radar Continuous-wave radar and Pulsed radar.
Key takeaway
The radar may be used in military and civilian use. The main purpose of civilian use is navigation. Various regions such as mountains, plains reflect high-frequency radio waves unequally. The radar equipment in aircraft provides information regarding the terrain and helps in navigation.
The block diagram for radar is shown below. The function of each block is explained below.
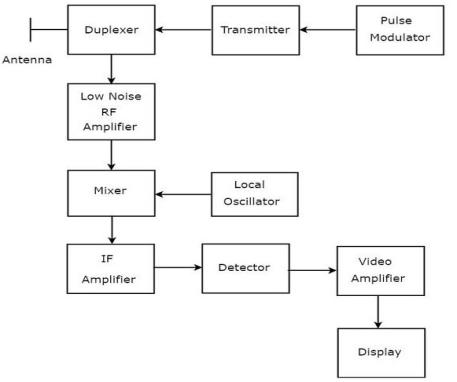
Fig 1 Block Diagram
a) Transmitter: This consists of a radio frequency oscillator that is controlled by a modulator in such a way so that it produces periodic pulses of high power.
b) Antenna System: The output of the transmitter is fed to the antenna which radiates it efficiently in the desired direction. The antenna is directional and capable of rotating in azimuth or vertical plane. Mostly a single antenna is used for transmission and reception.
c) Duplexer: This controls the transmitting and receiving operation. When there is an interval in the pulse the duplexer connects the transmitter to the antenna and isolates the sensitive receiver from damage.
d) Timer: This controls the generation of pulse in the transmitter. The receiver and the indicator are in sync with the timer.
e) Indicator: The output is displayed when the receiver output is applied to the indicator.
f) Scanner: The scanning system rotates both the antenna and the indicator deflection coil.
g) Receiver: The radar receiver has high sensitivity ultra-high frequency having the lowest possible noise figure and having bandwidth adequate for handling the pulses involved.
Key takeaway
The transmitter sends the train of high power and high-frequency pulses through the duplexer to the antenna. When the signal is reflected from the target the echo comes back to the antenna and then through the duplexer to the receiver.
The frequency band for radar is shown below
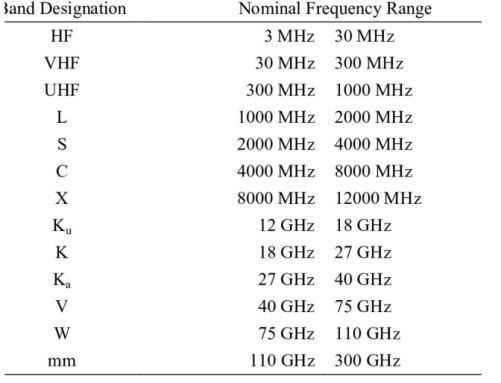
The application of radar in various fields which are listed below.
1) In the military application for aiming guns and ships. For giving warning regarding approaching aircraft. For assisting fighter aircraft in locating and attacking enemy aircraft during night.
2) They have a major contribution to air traffic control. The aircraft are directed during bad weather and to detect and display the aircraft position at the airport terminal.
3) For proper routing of ships by monitoring sea ice.
4) The traffic police use radar surveillance for controlling the traffic and finding the speed of vehicles.
5) They also contribute to space observations like detecting the satellite and tracking it. For monitoring meteors.
4.5.1 The Radar Equation
The range equation gives the relation between the transmitter, receiver, antenna, and target characteristics with the range of the radar. If the isotropic antenna receives the power PT from the transmitter.
Then power density at range R= 
The power density from the directional antenna will be = 
The target is described in terms of  which is the cross-sectional area.
The power density of the echo signal at radar will be = 

The power delivered to the receiver will be Pr = 
Due to insufficient power when the signal beyond a particular range cannot be detected is called its maximum range denoted by Rmax. The minimum detectable signal is the minimum power that the receiver can detect Smin.
Smin = 
Rmax = [ ]1/4
]1/4
Where:
Ae= effective area
GT = gain of the antenna
The GT for a circular paraboloid antenna is GT = 
Now the radar range equation will be
Rmax = [ ]1/4
]1/4
The above equation is the required equation.
4.5.2 Detection of signals in noise
Below shown is the functional diagram of noise radar with the existing signal types in real operating conditions. There is object 1 which transmits the desired signal SR(t) and other signals such as SI(t). The signals which are the radar transmitter noise signal are leakage 1, leakage2, and an interfering signal.
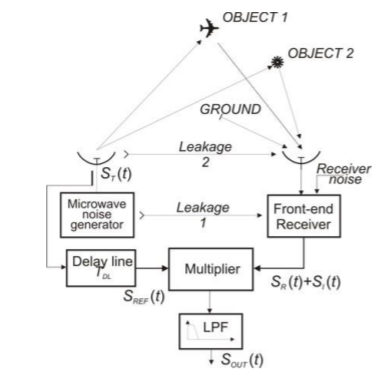
Fig 2 Functional diagram
For simplification, only two noise signals are considered in correlation with the reference signal SREF(t) which is the signal from object1, and SI(t) the interference signal. The power of the interfering noise signal is given by
PI = PLC +PLA +PR2 + PC + PN,R = PN,T +PN,R
PLA = receiving antenna power
PC = total power of radar
PN, R =power of self-noise
Key takeaway
The radar range equation is given by Rmax = [ ]1/4
]1/4
The unwanted signals which interfere with the actual signal and distort it are called noise. Types of noise are discussed
Internal Noise
Also called fundamental noise which is originated within electronic devices or circuits. They are called fundamental sources because they are an integral part of the physical nature of the material used for making electronic components.
This type of noise follows certain rules. Therefore, it can be eliminated by properly designing electronic circuits and equipment.
The fundamental noise sources produce different types of noise. They are as follows.
(i) Thermal noise
(ii) Shot noise
(iii) Partition noise
(iv) Low frequency or flicker noise
(v) High frequency or transit time noise
Shot Noise
It is produced due to the shot effect. Due to the shot effect shot noise is produced in all the amplifying devices rather than in all the active devices.
The shot noise is produced due to the random variations in the arrival of electronics (or holes) at the output electrode of an amplifying device.
Therefore, it appears as a randomly varying noise current superimposed and the output. The shot noise “Sounds” like a shower of lead shots falling on a metal sheet.
The shot noise has a uniform spectral density like thermal noise
The mean square shot noise current for a diode is given as
In2 = 2 ( J + Io ) qB Amp2
Where I = direct current across the junction in amperes
Io = reverse saturation current in ampere
q = electron charge = 1.6 X 10⁻¹⁹ C
B = Effective noise Band width in Hz
Thermal Noise Also known as Johnson Noise.
The free electrons within a conductor are always in random motion.
This random motion is due to the thermal energy received by them. The distribution of these free electrons within a conductor at a given instant of time is not uniform.
An excess number of electrons may appear at one end or the other of the conductor
The average voltage resulting from this non-uniform distribution is zero but the average power is not zero
This power results from the thermal energy are called the “Thermal noise power”
The average thermal noise power is given by
Pn = KTB Watts
Where: k = Boltzmann’s constant = 1.38 X 10⁻²³ J/K
B = Bandwidth of the noise spectrum (Hz)
T = Temperature of the conductor in K
The thermal noise power Pn is proportional to the noise BW and conductor temperature
Flicker noise: Also known as low-frequency noise
The flicker noise appears at frequencies below a few kHz it is sometimes called 1/f noise in the semiconductor devices, the flicker noise is generated due to the fluctuations in the carrier density.
These fluctuations in the carrier density will cause a fluctuation in the conductivity of the material. This will produce a fluctuating voltage drop when a direct-current flow through a device this fluctuating voltage is called flicker noise voltage.
The mean square value of flicker noise voltage is proportional to the square of direct current flowing through the device.
High-frequency noise Also called Transit time noise
If the time taken by an electron to travel from the emitter to the collector of a transistor becomes comparable to the period of the signal which is being amplified then the transit time effect takes place.
This effect is observed at every high frequency. Due to the transit time affect some of the carriers may diffuse back to the emitter. This gives rise to an input admittance, the conductance component of which increases with frequency.
The minute current induced in the input of the device by the random fluctuations in the output current will create random noise at high frequencies.
Partition noise- Partition noise is generated when the current gents are divided between two or more paths. It is generated due to the random fluctuations in the division.
Therefore, the partition noise in a transistor will be higher than that in a diode.
Noise figure: It is the ratio of the noise power input to noise power output due to source resistance. The noise figure is a quantity that compares the noise in an actual amplifier with that in an ideal (noiseless) amplifier. Noise figure is expressed in decibels.
Spi (Svi) = Signal power (voltage) input
Npi (Nvi) = noise power (voltage) input due to Rs
Spo (Svo) = Signal power (voltage) output
Npo(Nvo) = noise power (voltage output due to Rs and any noise source within the active device
 Noise figure, NF = 10 log total noise power input
Noise power output due to Rs
 Npo
Npo
 = 10 log
Ap Npi
Where the power gain of the active devices is
 Ap = Spo
Spi

 Hence, Npo Spi
 = 10 log
Spo Npi

 Spi
Spi
 = 10 log Npi
 Spo
Spo
Npo
The quotient Sp/Np is called the signal to noise power ratio.
The noise figure is the Input signal to noise signal to noise power ratio


 Spi
Spi


 NF = 20 log Npi = 20 Log Svi = 20 log Svo
 Spo Nvi Nvo
Npo
 Where: Sv is called the signal to noise Voltage ratio
Nv
Losses
An audio sinusoidal generator Vs with source resistance Rs is connected to the input of Q. The active device is cascaded with a low noise amplifier and filter and the output of this system is measured on a true rms reading voltmeter M. The experimental procedure for determining NF is as follows-
i) Measure Rs and calculate Nvi = Vn
Ii) Adjust the audio signal voltage so that it is 10 times the noise voltage
V/s = 10 Vn or Svi = 10 Nvi
Measure the output voltage with M.
A system is used to measure the noise figure of an active device Q.
Large signal to noise ratio, we may neglect the noise and assume that the voltmeter reading gives the signal output voltage Svo
Iii) Set Vs = 0 and measure the output voltage Nvo with M. The low noise amplifier is required only if the noise output of Q is too low to be detected with M.
Friis Formula:- This formula was named after Danish American Electrical Engineer Harald T. Friis. His formula is used in telecommunications engineering to calculate the signal to noise ratio of a multistage amplifier.
He gave two formulas on relates to noise factor while the other relates to noise temperature.
Friis formula is used to calculate the total noise factor of a cascade of the stage each with its noise factor and power gain.
The total noise factor can then be used to calculate the total noise figure.
The total noise figure is given as


 Ftotal = F1 + F2-1 + F3-1 + ---------- + Fn-1
G1 G1 G2 G1G2-Gm1
Where Fi and Gi are the noise factor and available power gain respectively of the stage and ‘n’ is the number of stages
Derivation – Let us consider a 3-stage cascaded amplifier that is n=3
A source outputs a signal of power Si and noise of power Ni
Therefore, the SNR at the input of the chain
 SNRi = Si
Ni
This Si gets amplified by all the 3 amplifiers and the output is given as
So = Si G1 G2 G
Using the definition of the Noise factors of the amplifiers we get the final result


 Ftotal = 1+ Na1 + Na2 + Na3
NiG1 NiG1G2 NiG1G2G3

 = F1 = F2-1 = F3-1
G1 G1G2

 Ftotal = F1 = F2-1 = F3-1
G1 G1G2
Note – Friis formula for noise temperature is given as

 Teq = T1 + T2 + T3 + ------
G1 G1G2
Key takeaway
The noise power at the output of the chain consists of the following 4 parts
i) Amplified noise i.e. Ni G1 G2 G3
Ii) The output noise of the first amplifier Na1 which gets further amplified by the 2nd and 3rd amplifier i.e. Na1 G2 G3
Iii) Similarly output noise of 2nd amplifier Na2 amplified by 3rd i.e. Na2 G3
Iv) Output noise of 3rd amplifier Na3
Therefore, the total noise power at the output equals
No = NiG1G2G3 + Na1G2G3 + Na2G3 + Na3
And the NSR at output becomes
 SNRo = SiG1G2G3
NiG1G2G3+Na1G2G3+Na2G3+Na3
The Total noise factor or noise figure may now be calculated as

 Ftotal = SNRi = Si
 SNRo Ni
 SiG1G2G3
NiG1G2G3+Na1G2G3+Na2G3+Na3


 = 1+ Na1 + Na2 + Na3
NiG1 NiG1G2 NiG1G2G3
Numericals:-
1) A noise generator using a diode is required to produce 15µV noise voltage in a receiver which has an input impedance of 75Ω (Purely resistive). The receiver has a noise power bandwidth of 200KHz to calculate the current through the diode.
Sol- Given Vn = 15µV
R = 75Ω
B = 200 KHz
Noise current flowing through 75Ω is
 In = Vn = 15X10-6
R
= 0.2X10-6
= 0.2µa
Diode current –short noise current is given by
In2 = 2 (I +Io) qB
In2 = 2I X Q X B (negelecting Io)
(0.2 X 10⁻⁶) 2 = 2I X 1.6 X 10-19 X 200 X 103
I = 0.625 A = 625 µA
2. A receiver has a noise power bandwidth of 12KHz. A register that watches with the receiver input impedance is connected across the antenna terminals what is the noise power contributed by this register in the receiver bandwidth. Assume temperature to be 30ºC
Sol – Given: B = kHz; T = 30ºC = 30+ 273 = 303 K
Pn = KTB
= 1.38 X 10-23 X 303 X 12 X 103
= 5.01768 X 10⁻¹⁷ W
4.7.1 Probabilities of false alarm
A false alarm is noticed when the noise voltage is above the threshold voltage Vt. The probability can be defined by integrating the PDF
Pr (Vt <R<
 dR
dR
The average time crossing the threshold is a false alarm
Tfa= 
Tk = time between crossing the threshold.
Then the probability of false alarm is given by
Pfa = 1/Tfa 
 = Bandwidth
For  =
=  IF
IF
Tfa= 
The above equation is the required equation
4.7.2 Probabilities of detection
Let there be a sine wave with A amplitude with noise at IF input. The PDF at the output of the envelop detector will be
Ps(R) =  I0 (RA/
 )
)
The probability that the signal will be detected is the same as the probability that envelops R will exceed threshold Vt
pd =  dR
dR
The above equation cannot be calculated directly. Techniques like series approximation or numerical techniques are used.
When a target is illuminated by the radar beam it normally reflects numerous pulses. The radar probability of detection is normally enhanced by summing all of the returned pulses. The process of adding radar echoes from many pulses is called radar pulse integration. Pulse integration can be performed on the quadrature components before the envelope detector. This is called coherent integration or pre-detection integration. Coherent integration preserves the phase relationship between the received pulses, thus a build-up in the signal amplitude is achieved. Alternatively, pulse integration performed after the envelope detector is called non-coherent or post-detection integration.
Coherent Integration
The integrator used should have high accuracy otherwise there will be integration loss. If the accuracy of the integrator is high then SNR will be improved by the integration pulse np. The value of mth pulse is given by
ym(t) = s(t) +nm(t)
s(t) = radar return of interest
The value of the coherent integration of np pulse gives
z(t) =  =
=  = s(t) + =
The single pulse noise power is given by
 =
=  =
=  =
= 
From the above two equations, we see that SNR after coherent integration is improved by np.
Non-Coherent Integration
Non-coherent integration is often implemented after the envelope detector, also known as the quadratic detector. A block diagram of radar receiver utilizing a square-law detector and non-coherent integration. The block diagram of non-coherent integration is shown below.

Fig 3 Block Diagram of Non-Coherent Integration
f(yn) = f(rn)|drn/dyn|
The output of square law detector is
xn = ½ (yn2)
The random variables xn are independent then the pdf for the variable z is
f(z) = f(x1) f(x2) f(x3)…….. f(xnp)
The non-coherent integration efficiency E(np)
E(np)= (SNR)1/np(SNR)np <1
The integration improvement factors I(np) for a specific Pfa is defined as
I(np) = (SNR)1/(SNR)np
Key takeaway
Note that (SNR)np corresponds to the SNR needed to produce the same as in the case of a single pulse when pulses are used. It follows that (SNR)np<(SNR)1.
The radar cross-section of a target is the area intercepting that amount of power which when scattered equally in all direction produces an echo at the radar equal to that from the target
 =
= 
The above equation is equivalent to the radar equation. When the EM wave scatters from the object the scattered field is defined as the difference between the total field in presence of the object and field. The radar cross-section can be obtained by the maxwells equation. The cross-section of the sphere is shown below where the Rayleigh region is seen. The Rayleigh region exists when the wavelength is more than the size of the sphere.
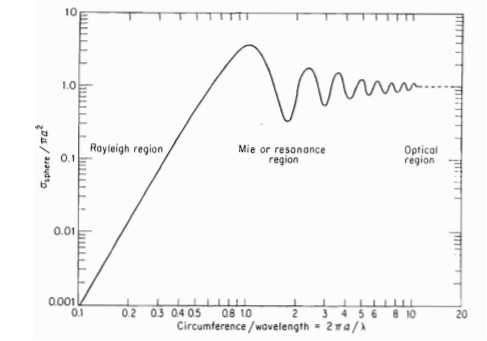
Fig 4 Radar cross-section of a sphere
As the cross-section of meteorological particles falls in the radar frequency region hence, we require the Rayleigh region. These particles are invisible for radars which work for very high wavelength.
When the dimension of the sphere is larger than the wavelength of a sphere it is called an optical region. The resonant region lies between the optical and Rayleigh region. Most of the reflecting objects have a radar cross-section of frequency as a sphere.
There are some more objects whose scattering pattern is a cone below shown is radar cross-section of a cone. Scattering occurs from discontinuities. The backscattering in a cone is observed from the tip and the joint between the cone and the sphere. The nose-on cross-section of the cone-sphere varies, but its maximum value is approximately 0.4 2 arid its minimum is 0.01
 2 for a wide range of half-angles for frequencies above the Rayleigh region.
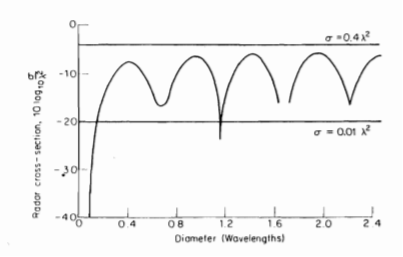
Fig 5 Radar cross-section of a sphere
Cone-sphere shaping is very helpful for reducing the target cross-sectional area. A comparison of a nose-on cross-section of several cone-shaped objects is shown below.
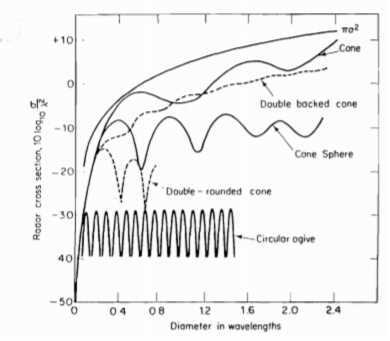
Fig 6 Comparison of a nose-on cross-section of different cone-shaped objects.
The radar cross-section of complex targets such as ships, aircraft, cities, and terrain is complicated. A complex target can be considered as comprising of independent objects that scattering energy in all directions. The relative phases and amplitudes of the echo signals from the individual scattering objects as measured at the radar receiver determines the total cross-section.
Let us consider scattering from a simple complex target having two equal isotropic objects separated by distance l as shown below.
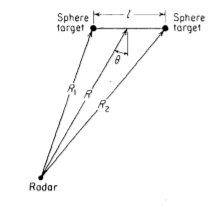
Fig 7 Geometry of two-scatter complex target
The separation l < c /2. Assuming cross-section of two targets equal and
  0. The composite cross-section is given by
 = 2[1 + cos (
 )]
)]
Where:
 = Pulse duration
c= velocity of propagation
R = distance of radar from the target
The radar cross-section of actual targets is far more complicated to indicate the type of behaviour than those expected from practical radar targets.
Key takeaway
Assuming cross-section of two targets equal and  0. The composite cross-section is given by
 = 2[1 + cos (
 )]
)]
There can be fluctuations in the cross-section of radar due to meteorological conditions. The cross-section of complex targets is more sensitive to these conditions. To manage these fluctuations, the probability density function and the correlation properties with time must be calculated for the given target.
The PDF gives the probability of finding any particular value of the target cross-section between  and
and  +d
+d while the autocorrelation function describes the degree of correlation of the cross-section with time or number of pulses. The four fluctuation models are explained below
i) The echo pulses received from the target on anyone's scan are of constant amplitude throughout the entire scan but are independent of the scan to scan. An echo fluctuation of this type is referred to as scan fluctuation. The pdf for this is given by
P( =
=  exp(-
exp(- )
)
Ii) The pdf for the target is given by the above equation but the fluctuations are more rapid than in case 1 and are taken to be independent of the pulse to pulse instead of from scan to scan.
Iii) The fluctuation is assumed to be independent of the scan to scan as in case 1 but the pdf is given by
P( =
=  exp(-2
 )
)
Iv) The function is a pulse to pulse as shown in the above equation.
The pdf in cases 1 and 2 are for complex targets which are having many independents scatters of almost equal echoing areas. The S/N ratio for achieving a specified probability of detection without exceeding a specified false alarm probability can be calculated from each model. The comparison of these cases is shown in the below figure.
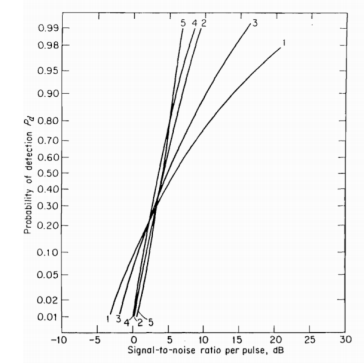
Fig 8 Comparison of detection probability for above cases
The relation between the transmitted and peak power is given below. The average radar power is nothing but the average transmitter power over the pulse repetition period.
Pav =  = Pt
= Pt fp
fp
The radar equation in terms of average power will now be
 =
= 
Where:
 = Pulse duration
 fp = duty cycle
Ei = energy = Pav/fp
Key takeaway
The above relation shows that the radar range does not depend upon the wavelength or the pulse repetition frequency.
The prf is determined by the maximum range at which the targets are expected. If the value of prf is kept too high the target echoes from the wrong pulse transmission are increased. Let us consider the targets as shown below. The proper target echoes cannot be distinguished from the multiple-time around echoes from A-scope within the range.
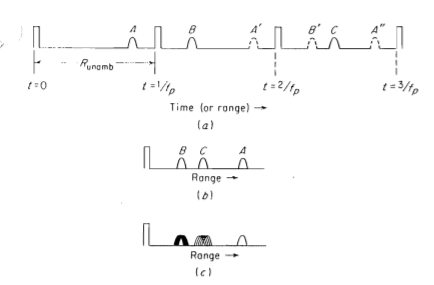
Fig 9 Multiple time around echoes
We can distinguish these echoes by varying pulse repetition frequency. The prf can be changed within the prescribed limits or it can be changed discretely among several predetermined values. The number of separate prf will depend upon the degree of multiple time targets. The second time target only needs two separate prf to be resolved.
The successive frequencies can be marked instead of modulating the prf. Ambiguities can be theoretically resolved by observing the variation of echo signal with time.
Key takeaway
It is difficult to be precise about any model for any particular target. If the mathematical model for any target is known but then also in some cases it does not match with the actual radar measurement. The uncertainty in fluctuations of target models makes the use of constant cross-section in the radar equation.
In transmission and reception mostly, directive antennas are used as they channel the radiated energy into a beam to enhance the energy concentrated in the direction of the target. The power gain of the antenna used for transmission is given by
G( ) =
) = 
According to the theory of reciprocity which the antenna follows states that properties of the antenna are not affected whether it is used in transmitter or receiver. When there is a requirement to measure the angular position of the target continuously, we use pencil beams. This beam can be generated by a metallic reflector surface shaped in form of a paraboloid of revolution with the EM energy fed from a point source.
A fan beam can be generated using a parabolic reflector shaped to yield the proper ratio between azimuth and elevation beamwidths. The more slowly the radar antenna scans the more pulses will be available for integration. Some methods can be used to modify antenna patterns to radiate more energy at higher angles.
In cosecant squared antenna the gain is given by
G( = G(
= G(
From  = 0 to
  =
=  0 the pattern obtained is similar to normal antenna pattern and for
  =
=  0 to
0 to  =
=  m the antenna gain varies as
  . The cosecant squared antenna may be generated by a distorted section of a parabola or by a true parabola with a properly designed set of multiple feed horns. The main property of the cosecant antenna is that the echo power Pr received from the target of the constant cross-section at constant altitude h is independent of the target range R from the radar. Now, the equation for receiver power will be
Pr =  = K1
= K1  /R4
/R4
If the height of the target is constant csc = R/h
= R/h
Pr = K1/h4 = K2
The maximum gain of antenna related to physical area A is
G = 
Where:
 = antenna efficiency
 = wavelength of radiated energy
Key takeaway
The cross-section  varies with the viewing aspect of the earth being not flat and the radiation pattern of any real antenna can be made to only approximate the desired cosecant squared pattern.
Some losses cannot be ignored like antenna beam shape loss, collapsing loss, and losses in microwave plumbing, etc. These are explained briefly below.
a) Plumbing Loss: There are some losses in the transmission line which are connected to the output of the transmitter to the antenna. There is less loss at low frequency in the transmission line. There can be losses in the connectors in the line and at the antenna, rotary joint if present. There is attenuation in the signal when it passes through the duplexer. The more isolation required from the duplexer on the transmission line the more is the insertion loss.
b) Beam shaped Loss: The antenna gain that appears in the radar equation is assumed to be a constant equal to the maximum value. But in reality, the train of pulses returned from a target with a scanning radar is modulated in amplitude by the shape of the antenna beam. The beam shaped loss is given as
Beam shaped loss= 
NB = number of pulses received
n= total number of pulses integrated
c) Limiting Loss: The probability of detection is lowered in the radar receiver due to limiting. Limiting results in a loss of only a fraction of a decibel for a large number of pulses integrated for a large value of limiting ratio.
d) Collapsing Loss: When the radar integrates the additional losses along with the S/N pulses then collapsing losses occur. It can occur in displays that collapse the range of information. If the square-law detector is used than the collapsing loss is given as
Li (m, n) = 
e) Operator Loss: The operator needs to be attentive all the time to notify or rectify an error if it occurs. The operator’s efficiency can be calculated by  0 = 0.7(Pd)2 where Pd is a single scan probability of detection. This is justified if the operator is alert and well trained. When the operator does not introduce loss into the system it is not easy to select a proper value to account for it.
f) Field Degradation: When the radar is operated under field conditions the performance deteriorates more than the expected value. The field degradation can occur if the radar is not supervised by any experienced personnel. To reduce field degradation there should be built-in automatic performance monitoring equipment. The radar characteristics that might be monitored include transmitted pulse, transmitter power, receiver noise level the shape of the spectrum, and decay time of the TR tube.
g) Other Losses: There is a complete loss of sensitivity for certain values of target velocity relative to the radar. These are called blind speeds. The straddling loss accounts for the loss in the S/N ratio for targets not at the centre of the range gate.
Key takeaway
These losses discussed cannot be ignored and needs to be taken into account for better performance of the system.
Reference:
1. Merrill I. Skolnik “Introduction to Radar Systems”, Mc Graw- Hill.
2. J.C.Toomay, Paul J. Hannen “Principles of Radar”, PHI Learning.
3. B.Pratt, A.Bostian, “Satellite Communications”, Wiley India.
4. D. Roddy, “Satellite Communications”, McGraw-Hill Education.