Unit 5
Tracking Radar
As we already know that radars are used to track targets and are also known as tracking radars. Any object can be tracked using some parameters like angle, range, and Doppler frequency. Sequential lobbing is a technique in which the radar tracks the target using the tracking of angle principle. It is a type of angular tracking.
Angular tracking is nothing but tracking target by taking the antenna axis as the reference direction and if the target has a direction other than the reference direction then there is an angular error. This angular error is the difference between the two directions.
Sequential lobbing is used for finding errors in one coordinate. In this technique, the beam of the antenna is switched between two patterns alternately for tracking the target. It is also known as lobe switching.
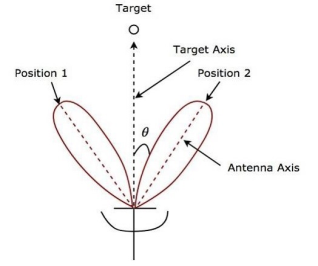
Fig 1 Sequential Lobbing
Key takeaway
Both the magnitude and direction of angular error can be known using sequential lobbing.
There is zero angular error if the axis of the radar antenna and the direction of the target coincide.
This technique is also a type of angular tracking. In this case, the error signal is then applied to a servo motor which then finds the exact position, location, and movement of the target. This scan system has a rotating beam of cone shape which is formed by the rotation of feed which is driven by the motor.
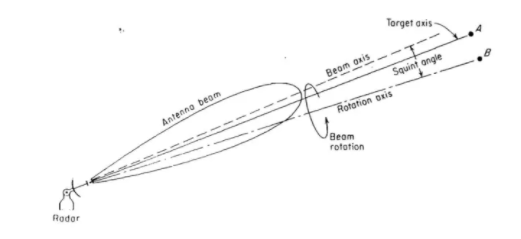
Fig 2 Conical Beam
As we can see from the above figure there is a target axis at point A. When we see the lobe from this point it appears to be a circle. If we move or change our position from point A then our position relative to the axis changes and which also changes the amplitude in the signal which is reflected. This data from the echo signal is sent to an angle-error detector circuit. The data from this circuit drives the servo motors that control the antenna.
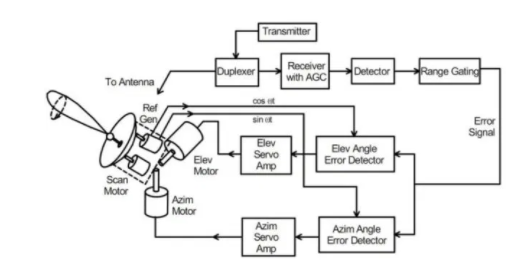
Fig 3 Block Diagram for conical Scan
The block diagram of the conical scan radar is shown above. The received echo signal is fed to the rotary joint from the antenna where the azimuth movement and elevation movements are controlled. There is a superheterodyne receiver. The second detector performs the task of extracting the error signal.
Key takeaway
When there is a change in the amplitude of voltage in the signals which are coming from two switching beams angular error occurs. As the rotating beam of the conical scan traces the shape of the cone so it is called a conical scan.
A single signal pulse is used to track the exact location of the target. This is the reason it is called as Mon0-pulse tracking radar. The sum and difference signals are obtained by the off-set antennas used. The phase-sensitive detector is used for finding magnitude and direction. The amplitude comparison of a mono-pulse block diagram is shown below.
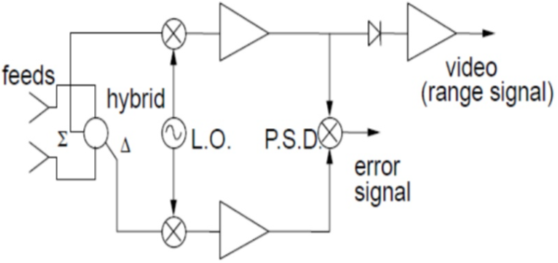
Fig 4 Amplitude Comparison Mono-pulse Tracking
As seen from the above figure the hybrid junction is connected with two antenna feeds and also with sum and difference signal. The error is produced when there is a difference in the amplitude of voltages and is proportional to the angular deviation of the target. The direction of the angle of error is determined by comparing the phases of sum and difference signals.
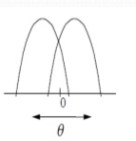
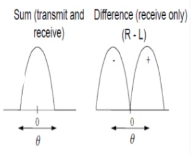
Fig 5a Overlapping antenna Fig 5b Sum and difference Patterns
Patterns
The servo motor drives the antenna back to the target according to the error signal which is fed to the motor. The phase of two signals is used to compare the phase of two signals. The mono-pulse two angles coordinate system is shown below.
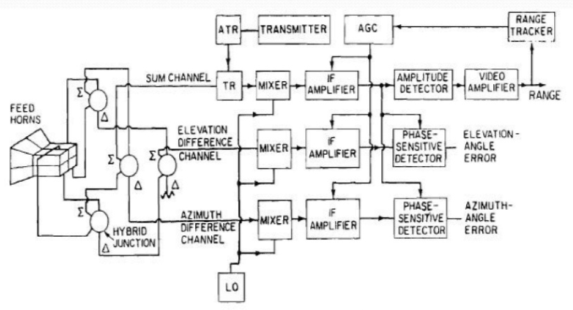
Fig 6 Two angle coordinate of mono-pulse
The pattern for the sum is generated by using four feeds A+B+C+D. This is also shown in the figure below. The difference between the phase of sum and elevation channel is called an elevation angle error. The difference between the phase of sum and azimuth difference channel is called azimuth angle error.
The Azimuth difference channel is (A+B)-(C+D).
The value of elevation difference channel s (B+D)-(A+C).
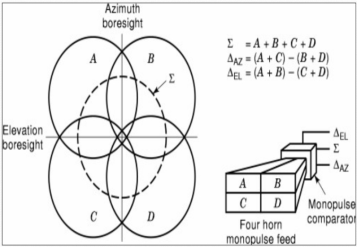
Fig 7 Two angle coordinate of mono-pulse
We compare the phase difference of two signals and calculate the angle of arrival of a target for phase comparison of mono-pulse. In the phase comparison technique, the echo from the boresight comes in the antennas at the same time making the phase difference zero. If there is a phase difference then the echo from the target at an angle will reach at a different time in both antennas. The delay in one signal will be because of the extra distance it travels.
The extra distance traveled is X = dsin
The phase difference is given by  = 2
= 2
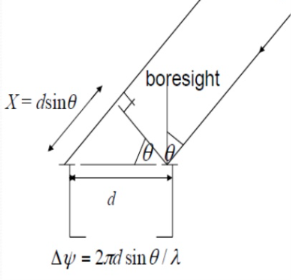
Fig 8 Phase difference of mono-pulse
The block diagram for the phase comparison of mono-pulse is shown below. The phase detector is used to calculate the phase difference.
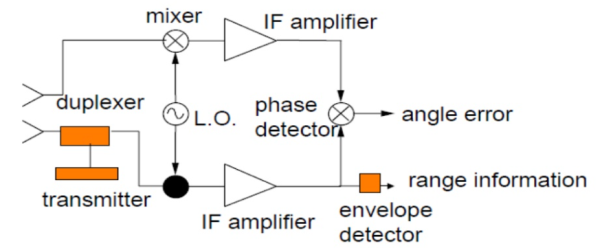
Fig 9 Block diagram for phase comparison of mono-pulse
The phase comparison of mono-pulse has a grating effect which means high sidelobes are produced in the sum patterns which shows uncertainties in the angle measurements.
Key takeaway
In phase comparison, the beams are not squinted and are in the same direction. Whereas in amplitude comparison squinted beams are used and it has high SNR.
5.4.1 Low angle tracking
The radar tracks the low elevation angles with different paths. They are tracked by two paths one from radar to target and the other from earth’s surface. The one signal is above the ground and the other below the target. At small angles, over a perfectly reflecting surface, the reflection coefficient from the surface is approximately 1.

Fig 10 Low angle Tracking
Since they are almost in line, the phase is equal to 180 degrees and the magnitude is equal to 1. Thus, the amplitudes of the incident signal are equal to the amplitude of the reflected signal.
5.4.2 Tracking in range
The target can be tracked in range or angle. It can be done manually by using A-scope or J-scope. If the speed to target is more it is difficult to handle it manually and tracking in the range is not possible. The split range gate is an automatic tracking technique implemented.
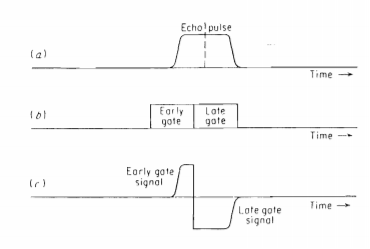
Fig 10 b Split range gate tracking
The echo pulse is shown above. If the output of two gates is subtracted error signal is generated. The magnitude of the error signal is different between the centre of pulse and centre of the gates. The sign of the gates determines the position of the gate. The range gating necessary to perform automatic tracking offers several advantages as by-products. It isolates one target. Excluding targets at other ranges. This permits the boxcar generator to be employed. It also improves the S/N ratio.
5.5.1 Introduction to Doppler Radar
Doppler shift is an apparent change in frequency due to the relative motion of two objects. Either one or both of the objects may be moving with respect to the ground. Radar systems exploit the Doppler shift to indicate relative speed. When the two objects are approaching each other, the Doppler shift causes a shortening of wavelength - or increase in frequency. When the two objects are receding from each other, the Doppler shift causes a lengthening of wavelength - or decrease in frequency. In the case of an MTI RADAR, when the target is moving towards the RADAR, the frequency of the echo received from the target increases whereas if the target is moving away from the RADAR, the frequency of the echo received from the target decreases. The difference in the transmitted frequency and received frequency from the target is called doppler frequency and is denoted by fd.
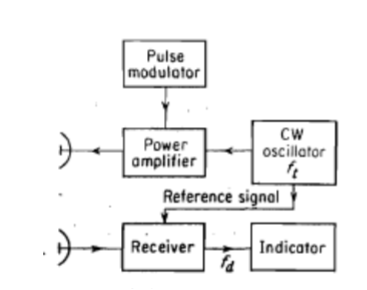
Fig 11 Block diagram of Doppler Radar
As we can see the system consists of a transmitter, receiver, indicator, and antennas. The continuous wave oscillator voltage is given by
Vref = A2 sin2 ftt
ftt
The Doppler shifted echo signal is given by
Vecho = A3 sin[2 (ft±fd)t -
Where:
A2 = amplitude of reference signal
A3 = amplitude of signal received from a target at a range R,
fd = doppler frequency shift
t = time
c = velocity of propagation
5.5.2 Introduction to MTI Radar
The target can be stationary or moving to track the moving target doppler effect is used and such radars are called moving target indicator radar (MTI Radar). If the target moves closer to the radar the frequency of the received signal increases and vice versa.
The block diagram of MTI radar is shown below.
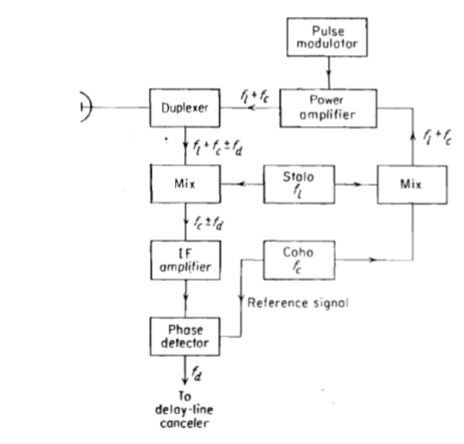
Fig 12 MTI Radar block diagram
From the above diagram, it is clear that a pulse modulator, power amplifier, local oscillator, mixer, and phase detector are used. The pulse modulator produces the pulse modulated signal which is then applied as input to the power amplifiers. The signal of frequency (stable frequency) fl is produced by the local oscillator. The output of LO is fed to the mixer. The intermediate frequency fc is produced by the coherent oscillator and is used as the reference signal.
The duplexer is a microwave switch, which connects the Antenna to either the transmitter section or the receiver section based on the requirement. The antenna transmits the signal having frequency fl+fc when the duplexer connects the Antenna to the power amplifier. Similarly, Antenna receives the signal having a frequency of fl+fc±fd when the duplexer connects the Antenna to Mixer.
The phase detector generates a signal with frequency fd and is connected to the delay line canceller.
Key takeaway
In the case of an MTI RADAR, when the target is moving towards the RADAR, the frequency of the echo received from the target increases whereas if the target is moving away from the RADAR, the frequency of the echo received from the target decreases. The difference in the transmitted frequency and received frequency from the target is called doppler frequency and is denoted by fd.
The main aim of pulse modulator delay is to generate a delay i.e time delay which has to be equal to the pulse reception interval. The delay time for ground-based surveillance will be up to some milliseconds. We can achieve this delay by converting EM waves into acoustic signals. When we achieve the delay required, we gain to convert the acoustic signal back to EM waves. There were analog delay lines but now with advancement in technology digital delay lines are used.
The figure for the delay line is shown below. For the implementation of the delay line, we need the digital output from the MTI radar. The output of the phase detector is quantized into a digital signal.

Fig 13 Block diagram of Delay line canceller
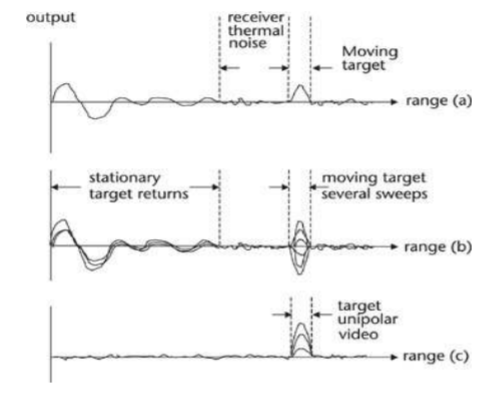
Fig 14 Delay line canceller
The dc components of clutter are rejected by the delay line canceller. The signal from the target at range R will be
V1 = k sin( )
)
Φ = phase shift
k = amplitude of video signal.
After the delay of T interval, the equation becomes
V2 = k sin[ ]
]
The output which is from the subtractor is given by
V = V1 -V2
V = 2k sin[ cos[
cos[ ]
]
The amplitude of the canceled video output is a function of the doppler frequency shift and the pulse repetition interval.
The use of more than one pulse repetition frequency offers additional flexibility in the design of MTI doppler filters. The sharp low-frequency cut-off is seen and the blind speed is also reduced with a cascade of single-delay-line cancelers with sin nf, T response. If the pulse repetition frequencies of the two radars are different if their blind speed at the same frequency is different. If any radar is blind to one target it doesn't need to be blind to another target. We can restrict the use of multiple radars to only if its timeshares its pulse repetition frequency within two or three values. It is called pulse repetition frequency when the pulse is shifted from pulse to pulse.
The doppler filters are used to identify the magnitude of the doppler frequency of the echo signal. The doppler filter banks are used in moving target detector which has a mono-pulse technique. The ADC converter output is input to the filter banks. These inputs to the bank are then processed using FFT. The output is in the frequency domain so that the sidelobes could be reduced. These doppler filters perform the function of coherent integration. There is flexible operation possible when the Doppler frequency domain is divided into the N section band. Due to this division offers to differentiate between fixed and moving objects. The threshold at the output of various doppler filters can be changed if there is a non-zero mean doppler shift.
The digital MTI processor block diagram is shown below. The output of the intermediate frequency amplifier is fed to two-phase detectors. Amongst the two-phase detector one has an in-phase channel denoted by I and the other is a quadrature channel which is shifted (900) denoted by Q.
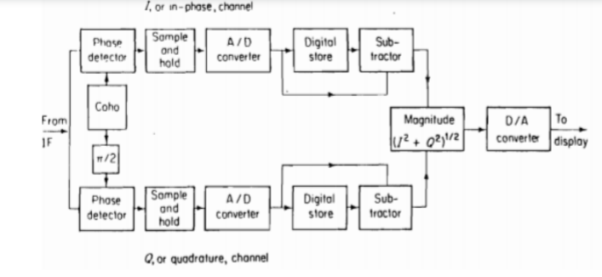
Fig 15 Digital MTI processing
The blind speed is estimated through the Q channel. The relative target velocities which result in zero MTI response are called blind speeds.
Discussed in the above sections.
The performance of the MTI radar is affected by some factors which are listed below.
i) Antenna Scanning modulation: The relation between the scanning rate and the antenna frequency is given by
 =
= 
Nb=number of pulses received
Fp=pulse repetition frequency
Өb=antenna beamwidth in degrees
Өs=antenna scanning rate in degree/second
As we can see that the time duration and the bandwidth of the frequency spectrum are inversely proportional. The limitation occurs when the clutter scatterer is stationary but then also there is finite spectral spread because of the finite duration of the echo signal.
Ii) Internal fluctuations of clutter: As the object or clutter can be a station or moving or can be small or big, but the wide frequency response is observed due to the wind blow. This limits the MTI performance.
Iii) Equipment Instabilities: If there is a change in frequency or phase of coherent oscillator and also if the pulse-to-pulse characteristics of transmitted signals result in clutter then it limits the performance.
Iv) Limiter: For reducing the clutter to the level of receiver noise the limiters are used. If the limiter is set above the receiver noise by MTI radar improvement factor.
Reference:
1. Merrill I. Skolnik “Introduction to Radar Systems”, Mc Graw- Hill.
2. J.C.Toomay, Paul J. Hannen “Principles of Radar”, PHI Learning.
3. B.Pratt, A.Bostian, “Satellite Communications”, Wiley India.
4. D. Roddy, “Satellite Communications”, McGraw-Hill Education.