Unit – 3
Equation Of Motion for Laminar Flow Through Pipes
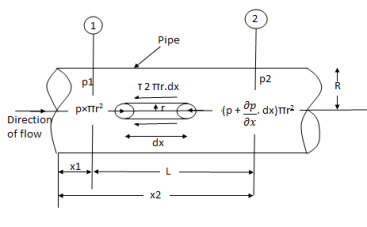
Fig: Circular pipes
Fig. Shows a horizontal circular pipe of radius R, having laminar flow of fluid through it.
Consider a small concentric cylinder of radius r and length dx as a free body.
If  is the shear stress, the shear force F is given by
F =  x 2
x 2  r x dx
Let P be the intensity of pressure at left end and the intensity of pressure at the right end be (
Thus, the force acting on the fluid element are:
i) The shear force,  x 2
x 2 r x dx on the surface of fluid element.
Ii) The pressure force, P x  on the left end.
Iii) The pressure force, ( on the right end.
For steady flow, the net force on the cylinder must be zero.
 [ p x
[ p x  - (
- ( ] –
] – 
 -
-  -
-

Shear stress is zero at the centre of pipe (r = 0) and maximum at the pipe wall given by
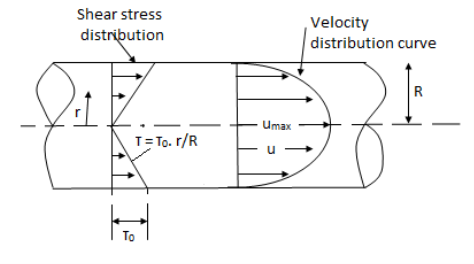
Fig: When shear stress is zero
 (
( )
)
From Newton’s Law of viscosity

In this equation, the distance y is measured from the boundary. The radial distance r is related to distance y by the relation.
y = R-r ordinate y = -d r

Comparing two values of 
 =
= 
 du =
du =  (
( )r.dr
)r.dr
Integrating the above equation w. r. t. ‘r’ we get
 u =
u =  .
.  r2 + C --------------- (ii)
Where C is the constant of integration and its value is obtained from the boundary conditions.
At r = R, u = 0
 0 =
0 =  .
.  R2 + C or C =
 .
.  R2
R2
Substituting this value of C in eqn. (ii) we get,
 u =
u =  .
.  r2
r2 .
.  R2
R2
 u = -
u = -  .
.  (R2 – r2)
Shows that velocity distribution curve is a parabola.
The maximum velocity occurs, at the centre and is given by.
 umax = -
  R2
R2
Key Takeaways:
The velocity distribution curve is a parabola and maximum velocity occurs at the middle centre
 umax = -
  R2
R2
Turbulent flow occurs when the Reynolds number exceeds 4000.
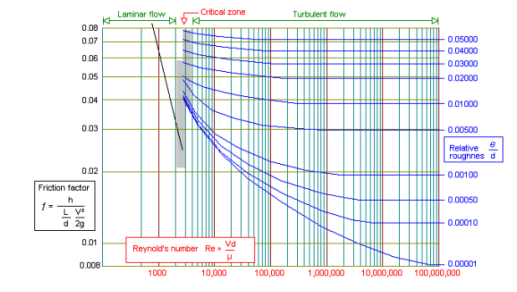
Eddy currents are present within the flow and the ratio of the internal roughness of the pipe to the internal diameter of the pipe needs to be considered to be able to determine the friction factor. In large diameter pipes the overall effect of the eddy currents is less significant. In small diameter pipes the internal roughness can have a major influence on the friction factor. The relative roughness of the pipe and the Reynolds number can be used to plot the friction factor on a friction factor chart. The friction factor can be used with the Darcy-Weisbach formula to calculate the frictional resistance in the pipe. Between the Laminar and Turbulent flow conditions (Re 2300 to Re 4000) the flow condition is known as critical. The flow is neither wholly laminar nor wholly turbulent. It may be considered as a combination of the two flow conditions. The friction factor for turbulent flow can be calculated from the Colebrook-White equation:

Turbulence is caused by excessive kinetic energy in parts of a fluid flow, which overcomes the damping effect of the fluid's viscosity. The mixing action of the turbulent flow enhances the temperature averaging effect in addition to the transfer of energy from the hot water to the surrounding fluid. When a hot object is cooled, the mixing action of turbulent flows in the fluid surrounding the object plays an important role in cooling it.
Key Takeaways:

The velocity fluctuations are invariant to axis rotation and reflection and are independent of the reference axis.
By definition, isotropic turbulence is always homogeneous.
The gradient of the mean velocity does not exist in this circumstance, and the mean velocity is either 0 or constant throughout.
The direction of reference has no effect on the variations in isotropic turbulence.
 or
or 
It should be emphasised that even if the rms fluctuations at any moment are the same, their instantaneous values will always change.
Key takeaway
Isotropic Turbulence: There is no directional preference in the statistical properties, and perfect disorder endures.
Anisotropic Turbulence has a directional preference in statistical properties and a gradient in mean velocity
The term homogeneous turbulence denotes that the system's velocity fluctuations are random, but that the average turbulent features are independent of the fluid's position, i.e., invariant to axis translation.
Consider the variations in root mean square velocity.

The rms values of u', v', and w' in homogeneous turbulence can all be different, but each value must be constant over the whole turbulent field. Even though the rms fluctuation of any component, say u' s, is constant throughout the field, the instantaneous values of u must change from point to point at any given time.
Key takeaway
Homogeneous Turbulence: Turbulence in all sections of the flow field has the same quantitative structure.
The turbulence intensity, also often referred to as turbulence level, It is defined “The relative magnitude of the root mean square value of the fluctuating components with respect to the time averaged main velocity describes the intensity or degree of turbulence in a flow.as:”

Where  is the root-mean-square of the turbulent velocity fluctuations and U is the mean velocity

The amount of turbulence in a wind tunnel can be reduced by installing fine mesh screens at the bell mouth entry.
In general, turbulence in a wind tunnel becomes isotropic at a given distance from the screens, i.e. the mean oscillation in the three components is equal.


Therefore,

Even when turbulence is not isotropic, this simplified measure of turbulence intensity is frequently employed in practise.
Common estimations of the incoming turbulence intensity:
High-turbulence case: turbulence intensity is between 5% and 20% seen in turbines and compressors
Medium-turbulence case: turbulence intensity is between 1% and 5% seen in less complex devices like large pipes, ventilation flows
Low-turbulence case: turbulence intensity is very low, well below 1%., seen in wind-tunnels, across cars, ships in open environment
Fully developed pipe flow

It is also denoted by I

Where Re is found out by hydraulic diameter
Scale
The Reynolds number determines the distance between the largest and smallest sizes. The flow geometry, such as the depth of the boundary layer, usually dictates the longest length scales. The "energy-containing" range is so named because turbulent kinetic energy is taken from the mean flow at the biggest sizes.
The viscosity and the rate at which energy is provided by the largest-scale eddies determine the smallest scales. The inertial subrange scales, which are intermediate between these scales, do not generate or eliminate turbulent kinetic energy, but rather transmit it from larger to smaller scales.
The nonlinear process of vortex stretching is used to generate smaller-scale eddies from bigger eddies. On a timescale of around one large-eddy cycle, energy is typically transmitted from the largest to the smallest eddies.
For each of the eddy scale sizes, there are standard turbulence length scales: integral length scales for energy-containing eddies, Taylor microscale for inertial subrange eddies, and Kolmogorov microscale for dissipation range eddies.
Key takeaway
In simpler metrics turbulence intensity is given by 
Different methods to measure turbulence
- Laser Doppler Anemometry (LDA),
- Particle Image Velocimetry (PIV),
- Constant Temperature Anemometer (CTA)
- Positron Emission Particle Tracking (PEPT),
- Piezoelectric Vibration Sensor (PVS)
- Electrical Resistance Tomography (ERT)
Laser Doppler Anemometry (LDA)
Laser Doppler Anemometry (LDA) also known as Laser Doppler Velocimetry (LDV), is an optical technique used to evaluate velocity and turbulence distribution in free and internal flows in non-intrusive 1D, 2D, and 3D point measurements.
An LDA's basic configuration includes a continuous wave laser.
A beam splitter and a focusing lens are part of the transmitting optics.
A signal conditioner and a signal processor are included in the receiving optics, which include a focusing lens, an interference filter, and a photo detector.
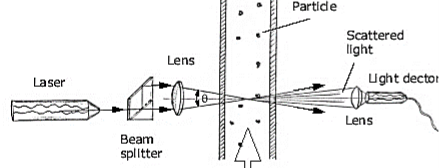
Because of the intensity profile of the laser beams, the photo-detector converts the fluctuating light intensity to an electrical signal. In the signal processor, the Doppler bursts are filtered and amplified, and the fD for each particle is determined, usually through frequency analysis using the robust Fast Fourier Transform technique. The particle's distance travelled is calculated using the fringe spacing df. The Doppler frequency fD offers the following time information: 1/fD = t.
Because velocity equals distance divided by time, the velocity expression is:
u= df  fD
fD

Two extra beams in a plane perpendicular to the first beams can be added to the optics to measure two velocity components.
Two different probes measuring two and one component can measure all three velocity components, with all the beams intersecting in a common volume as shown below. The detected components are separated using different wavelengths.
The mean shear stress has both viscous and turbulent parts. The most popular type of turbulence model is an eddy-viscosity model (EVM) which assumes that turbulent stress is proportional to mean-velocity gradient in a manner similar to viscous stress. J. Boussinesq provided a mixing coefficient for the Reynolds stress term, defined as in the same way as the coefficient of viscosity for laminar flow.

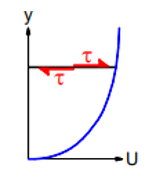
Using  the shearing stresses can be written as


The term is known as eddy viscosity and the model is known as eddy viscosity model
v is a measurable physical characteristic of the fluid; v𝑡 is a hypothetical property of the flow that must be modelled. It varies depending on position, at high Reynolds numbers, v𝑡 ≫ v throughout much of the flow
Key takeaway
The most popular type of turbulence model is an eddy-viscosity model (EVM) which assumes that turbulent stress is proportional to mean-velocity gradient in a manner similar to viscous stress

Consider the water flow from one reservoir to the next, as depicted in Fig. The water levels in the two reservoirs A and B are kept constant. The distinction between these two levels is depicted in the diagram. Water flows from reservoir A to reservoir B as a result.
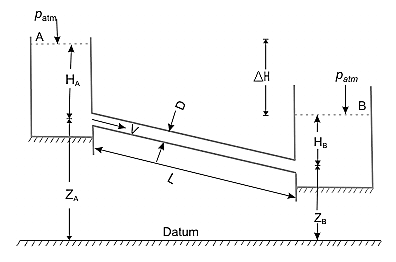
Applying Bernoulli's equation


 is the loss of head
As a result, the equation above states that in a steady state, the head causing flow equals the total head loss due to the flow.
The overall loss of head can be described in terms of its multiple components, taking into account probable hydrodynamic losses.

Where first term is Loss of heat at entry to the pipe from reservoir A, second Friction loss in pipe over its length L and third Exit loss to the reservoir B and where, V is the average velocity of flow in the pipe. Because the flow rate remains constant throughout the pipe even if its diameter changes in steady state, the velocity V in the preceding equation is commonly substituted in terms of flow rate Q.

We finally get


The term R is defined as the flow resistance
When f is independent of Re, the flow resistance is just a function of the pipe geometry. Eqn can be written as follows:

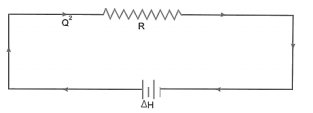
In Eq, H is the head that causes the flow and is defined as the difference between A and B's flow potentials. In a purely resistive electrical circuit, this equation is analogous to the voltage-current relationship. In an electrical circuit that is solely resistive,  where
where  is the voltage or electrical potential. However, while the voltage drop in an electrical circuit is proportional to the current, the difference in the flow potential in a fluid circuit is proportional to the square of the flow rate.
Therefore Fluid System can be describe as network
Key takeaway
 is anologous to
  so the resistance can be expressed similar to purely resistive electric circuit
The term R is defined as the flow resistance and is given by

The voltage Drop in electric ciruit is linear but head loss in fluid network is parabollic
Total Head loss = Major Losses + Minor Losses
Major losses are frictional losses and are found out by Darcy Equation

Minor losses includes bend losses and fitting losses are given by 
Where V is the average flow velocity across the pipe.
When a fluid flows along a curved route, it is accelerated inwards by force acting radially inwards on the fluid. This is known as centripetal acceleration. Pressure rises at outer wall and reduces at inner wall which creates adverse pressure gradient. Because of their near closeness to the wall, fluid particles have low velocity and are unable to overcome the adverse pressure gradient, causing the flow to separate from the boundary, resulting in energy losses in the generation of local eddies. A change in pressure in the radial depth of the pipe causes a secondary flow in the radial plane of the pipe, resulting in losses. This flow, when combined with the main flow, creates a typical spiral motion in the fluid that lasts for fifty times the pipe diameter downstream from the bend's central plane. This spiral motion of the fluid raises the local flow velocity and velocity gradient at the pipe wall, resulting in a larger frictional loss of head than in a straight pipe of the same length and diameter with the same rate of flow. This are bend loss an additional loss of head (other than that caused by friction) in flow across pipe bends. In the course of flow through pipe fittings such as valves, couplings, and so on, an extra loss of head occurs. Narrower the channel, higher the head loss. These are fitting losses. Both bend and fitting losses together are called minor losses
The value of K is determined by the overall length of the bend and the R/D ratio of the bend's radius of curvature and pipe diameter. The radius of curvature of the bend's centre line is commonly referred to as R. In the common range of Re encountered in practise, the factor K fluctuates slightly with Reynolds number Re, but it raises with surface roughness.
Type and position of fittings | Values of K |
Globe valve, wide open | 10 |
Gate valve, wide open | 0.2 |
Gate valve, three-quarters open | 1.15 |
Gate valve, half open | 5.6 |
Gate valve, quarter open | 24 |
Pump foot valve | 1.5 |
90°elbow(threaded) | 0.9 |
45°elbow(threaded) | 0.4 |
Side outlet of T junction | 1.8 |
| Type of Minor Losses in pipe | Formula |
1 | Loss of Head at Entrance |  |
2 | Loss of Head at submerged Discharge (i) Discharge into Still water |  |
3 | (ii) Discharge into Moving water |  |
4 | Loss due to contraction |  |
5 | Loss Due to Expansion |  |
6 | Loss in pipe fitting |  |
7 | Loss in Elbows and Bends |  |
Key takeaway
Minor losses are additional losses (apart from fluid friction) due to pipe fittings and bending losses and are given by 
Pipes in Series:
- Pipes in series or compound pipes are defined as the pipes of different lengths and -different diameters connected end to end (in series) to form a pipe line as shown in fig.
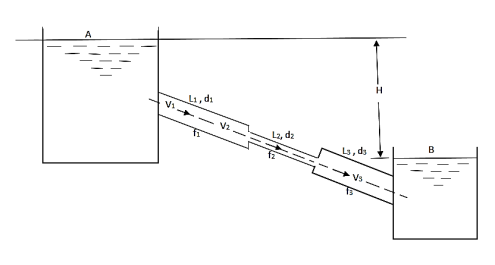
Fig: Pipes in series
L1, L2, L3 = Length of pipes 1, 2 and 3 respectively
d1, d2, d3 = diameters of pipes 1, 2, 3 respectively
v1, v2, v3 = velocity of flow through pipes 1, 2, 3
f1, f2, f3 = coefficients of frictions for pipes 1, 2, 3
H = difference of water level in the two tanks
The discharge passing through each pipe is same


The difference in liquid surface levels is equal to the sum of the total head loss in the pipes.

If minor losses are neglected, then above equation becomes as

Key takeaways
The difference in tanks when pipe connected in series

Pipes in Parallel:
- Consider a main pipe which divides into two or more branches as shown in fig. And again join together downstream to form a single pipe, then the branch pipes are said to be connected in parallel.
- The discharge through the main is increased by connecting pipes in parallel.
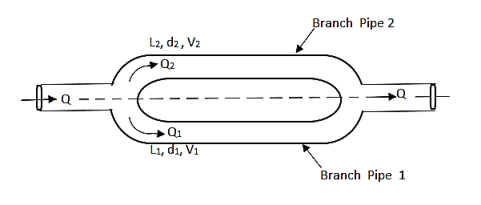
Fig: Pipes are connected in parallel
- The rate of flow in the main pipe is equal to the sum of rate of flow through branch pipes.

In this arrangement, the loss of head for each branch pipe is same.
Hence, Loss of head for branch pipe 1 = Loss of head of branch pipe 2

Key takeaways
When pipes are connected in parallel loss of head for branch pipe1 = loss of head of branch pipe 2

Power is transmitted through pipe by allowing water to flow through a pipe.
Now consider a pipe AB connected to a tank as shown it.
Let,
H = Head of water at inlet
L = Length of the pipe
d = Diameter of the pipe
V = Velocity of flow in pipe
hf =Head loss due to friction
Head available at the outlet of the pipe,
=Head at inlet-Head loss due to friction
= H-hf =H-
Weight of water flowing through pipe/sec.
W = x Volume of water/sec.
= x Area× Velocity=
 ×
× d2×V
d2×V
Power transmitted at outlet of the pipe,
P = Weight of water per sec x Head at outlet
P= Watt
Watt
Efficiency of power transmitted,
ɳ=
=
=
ɳ=
Condition for Maximum Transmission of Power:
The condition for maximum transmission of power is obtained by differentiating Equation with respect to V and equating the same to zero.
∴ (P)=0
(P)=0
 =0
=0
 =0
=0
H= =3hf
=3hf
∴hf=H/3
The Equation is the condition for maximum transmission of power.
Maximum Efficiency of Transmission of Power:
Efficiency of power transmission through pipe is given by,
ɳ=
For maximum power transmission, hf=H/3
Maximum efficiency,
ɳ= =2/3
=2/3
∴ɳ%=66.67%
Key Takeaway
- Power Transmitted =
 ×
× d2×V
d2×V - Condition for Maximum Transmission of Power: hf=H/3
- Efficiency ɳ=

- Maximum efficiency, ɳ=
 =2/3=66.67%
A syphon is a long-bent pipe is used for carrying water from a reservoir at a higher level to another reservoir at a lower level when the two reservoirs are separated by a hill or high-level ground.
The point C is highest point of syphon is called as summit.
The pressure at point C is less than atmospheric pressure as it lies above the free water surface in the tank A.
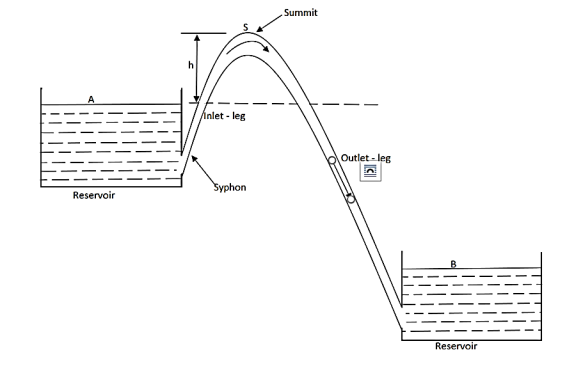
Fig: Siphon
The pressure at C can be reduced, theoretically, to -10.3 m of water but in actual practice is only 7.6 m of water (or 10.3-7.6=2.7 m of water absolute).
If the pressure becomes less than 2.7 m of water absolute, the dissolve air and other gases would come out from water and collected at the summit. It may be obstructed the flow of water.
Syphon is used in following cases:
(a) To take out water from one reservoir to another reservoir separated by a hill or ridge.
(b) To drain out water from a channel without any outlet.
(c) To take out the water from a tank which does not have any outlet.
Working principle of syphon:
Negative or vacuum pressure is created in the syphon, so that liquid gets pushed into it.
The flow through syphon then remains continuous till pressure in syphon pipe remains negative but less than separation pressure.
At summit, we find the minimum pressure. Velocity or discharge through syphon can be obtained by applying Bernoulli's equation between A and Fig.as shown in.
Now applying Bernoulli's equation between section A and B,
 +
+ +ZA=
+ZA= +
+ +ZB+Losses
But and VA=VB=0
∴ZA-ZB=Losses
H= Loss of head at entry+ Head loss due to friction+ Head loss due to exit
H= 0.5 +
+ +
+ =
=
Where f= Friction factor=4f=4 coefficient of friction
L = Length of syphon AB
d =Diameter of the syphon
V =Velocity of flow
Now, applying Bernoulli's equation between A and C.
 +
+ +ZA=
+ZA= +
+ +ZB+Losses between AC
But  =0, VA=0, Vc=V,
Head loss between AC=Entry loss +Frictional loss
=0.5 +
+
∴ZA= +
+
But ZA-ZC=-hc
 =-
=-
This equation is used to find out,
 =Pressure head at summit
Hc = Height of summit above the surface in the higher level
L1= Length of inlet leg
Key Takeaway
- A syphon is a long-bent pipe is used for carrying water from a reservoir at a higher level to another reservoir at a lower level when the two reservoirs are separated by a hill or high-level ground.
- At summit, we find the minimum pressure. Velocity or discharge through syphon can be obtained by equation
Pressure head at summit  =-
=-
- Consider a lengthy pipeline AB that is connected to the opposite side of a tank and contains water at a height H from the pipe's centre. A flow control valve is installed at the pipe's outermost end.
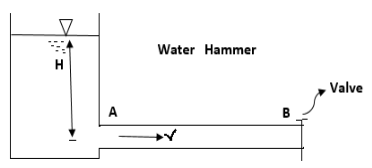
- Water flows at a velocity, V, in the pipe when the valve is fully open.
- A high-pressure wave interrupts the water flow if the valve is now closed.
- This high-pressure wave will travel through the pipe at the same speed as the sound wave, resulting in a knocking noise.
- The consequence of this high-pressure wave is to move the pipe walls, hence the name water hammer.
- The velocity of water flowing through the pipe, (ii) the length of the pipe, (iii) the time it takes to close the valve, and (iv) the elastic characteristics of the pipe's material all contribute to the pressure rise induced by water hammer.
- Head of pressure is given by =

- Time Taken by Pressure Wave to Travel from the Valve to the Tank and from Tank to the Valve if t is the required time taken by pressure wave, L is Length of the pipe, C is Velocity of pressure wave then total distance = L + L = 2L
- Time= Distance/ Velocity of pressure wave or

- If T is time taken to close the valve, The closure is Gradual if
 ,
, - The closure is not gradual if
 , C is velocity pressure and T is Time in sec.
Key Takeaway
- When Valve is suddenly closed, a high-pressure wave interrupts the water flow pipe at the same speed as the sound wave creating Knocking noise and moves the pipe wall This is called water hammer effect.
- Time Taken by Pressure Wave to Travel from the Valve to the Tank and from Tank to the Valve if t =

- T is time taken to close the valve ,If
 Valve closure is not gradual, For
  , Valve closure is gradual
- A pipe network is an interconnected system of pipes forming several loops of circuits.
- The pipe network is shown in figure.
- The examples of such networks of pipes are the municipal water distribution system in cities and laboratory supply system.
- In each system, it is required to determine the distribution of flow through the various pipes of the network.
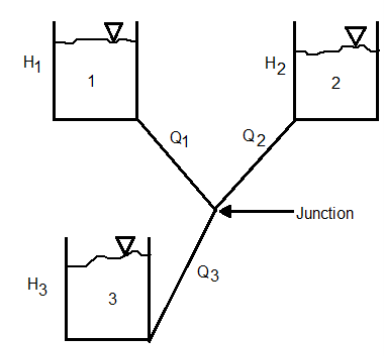
Fig: Three reservoir problems
The following are the necessary conditions for any network pipes:
- The flow into each junction must be equal to the flow out of the junction. This is due to continuity equation.
- The algebraic sum of head losses round each loop must be zero. This means that in each loop, the loss of head due to flow in clockwise direction must be equal to the loss of head due to flow in anticlockwise direction.
- The head loss in each pipe is expressed as
- The value of R depends upon the length of pipe, diameter of pipe and coefficient of friction of Pipe. The value of n for turbulent flow is 2.
We know that


Therefore, 
- This head loss will be positive when the pipe is a part of loop and the flow in the pipe is clockwise.
- Generally, the pipe network problems are difficult to solve analytically. Hence, the methods of successive approximation are used. Example Hardy cross method.
- The problem grows more complicated when pipes connect three reservoirs, as depicted in Figure. One of the issues is that determining the direction fluid will flow might be difficult at times.
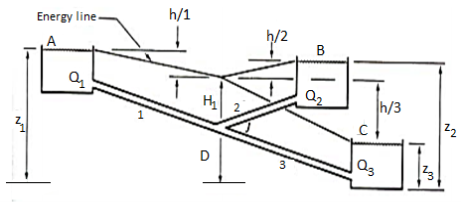
- Minor losses (entry and exit losses) are sometimes overlooked because they are often insignificant.
- Friction always results in a positive decrease - even when head loss occurs in the direction of flow. The direction of flow is usually clear, but when it isn't, it must be determined.
- The heads at the reservoir are shown in the diagram above, but the head at junction D is not. None of the pipe flows are known either. In pipes 1 and 2, the flow is clearly from A to D and D to C, respectively. If the flow in pipe 2 is assumed to be from D to B, the following relationships can be written:


- Because the hf expressions are functions of Q, we have four equations with four unknowns to solve simultaneously: hD, Q1, Q2, and Q3.
- A group of interconnected pipes forming several loops or circuits is called as pipe network. e.g., municipal water distribution system in cities.
- Following are the various conditions to be satisfied by pipe network.
- According to the principle of continuity, the flow into each junction must be equal to the outflow of the junction.
- In each loop, the loss of head due to flow in clockwise direction must be equal to the loss of head due to flow in anticlockwise direction.
- The head loss in each pipe is expressed as h, = r Qn. The value of r depends upon the length of pipe, diameter of pipe and coefficient of friction of pipe. The value of n for turbulent flow is 2.
Hf = =
= (
( )^2 =
)^2 =
= = rQ2 where, r=
- The pipe network problems are difficult to solve analytically. Hence the methods of successive approximations are used. 'Hardy cross method' is one such method which is commonly used.
Boundary Layer
A flowing fluid's boundary layer is the thin layer closest to the wall. Viscous stresses are especially prevalent within this layer in a flow field. Even if the layer is thin, it is critical to understand the flow dynamics within it. When approaching the wall, the main-flow velocity within this layer tends to zero (no-slip condition). In addition, as compared to the gradient in the stream wise direction, the gradient of this velocity component in a direction normal to the surface is large. Ludwig Prandtl proposed in 1904 that the effect of internal friction in fluids with low viscosity is significant only in a narrow region surrounding solid boundaries or bodies over which the fluid flows. Thus, the boundary layer is close to the body, where shear stresses exert an increasingly larger effect on the fluid as one moves from free stream to solid boundary. The fluid particles do not experience vorticity outside the boundary layer, where the effect of shear stresses on the flow is modest compared to values inside the boundary layer, since the velocity gradient is negligible, and the flow is akin to a potential flow. As a result, the surface at the boundary layer contact that separates rotational and irrotational flow is a fake one. As a result, the flow is frictionless (inviscid) and the velocity is U, except in the immediate vicinity of the surface (the potential velocity). There is friction in the flow at the region extremely close to the surface (in the thin layer), indicating that the fluid is being held back until it clings to the surface (no-slip condition). Across the boundary layer, the mainstream velocity transitions from zero at the surface (with regard to the surface) to full magnitude.
Boundary layer thickness
The thickness of the boundary layer is a function of the coordinate direction x. When compared to the domain's typical length L, the thickness is deemed to be quite modest. Within this thin layer, the gradient in the normal direction is much larger than the gradient in the flow direction . It is the distance from the boundary to the point where velocity of fluid is approximately equal to 99% of free stream velocity (U).
It is denoted by ' '
'

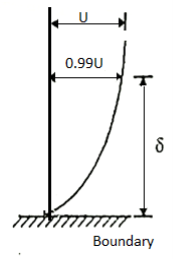
Although the notion of boundary layer thickness is somewhat arbitrary, displacement thickness is a physically more meaningful metric of boundary layer estimation
Displacement thickness : The distance by which the exterior potential flow is shifted outwards due to the decrease in velocity in the boundary layer is known as displacement thickness.

Momentum thickness : It is defined as the difference in momentum between the boundary layer and potential flow.

Shape factor: The shape factor H is the ratio of displacement thickness to momentum thickness.

Key Takeaway
- A flowing fluid's boundary layer is the thin layer closest to the wall. The surface at the boundary layer contact that separates rotational and irrotational
- The thickness of the boundary layer is the distance from the boundary to the point where velocity of fluid is approximately equal to 99% of free stream velocity (U).

Velocity variation in turbulent boundary layer is logarithm and is generally represented by power law,

Where n varies from 5 to 10 depending upon Reynold’s number.
For turbulent boundary layer and R., ranging from 5 x 10⁷ and 2 x 10⁷

This is known as one-seventh power law. This is nth applicable to the thin laminar sublayer which is very near to thin boundary.
Blasius's relation of shear stress for flat plate is taken as,

For Rex, ranging from 5x 10³ to 107, we have
a) Boundary layer thickness,
b) Local coefficient of drag 
c) Average coefficient of drag 
This equation is applicable for boundary layer turbulent throughout the plate,

It is applicable for the boundary layer which is partly lamina and partly turbulent.
A flat smooth plate is placed parallel to the direction of flow, the flow in the boundary layer is laminar though the main flow is turbulent near to the trading edge of plate. This layer of fluid is said to be Laminar boundary layer.
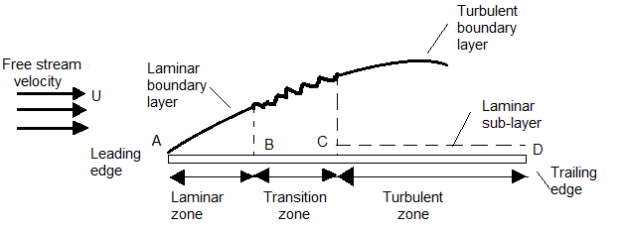
(Re)x=
Where, x = Distance from leading edge,
U = Free stream velocity
v = Kinematic viscosity
Momentum-Integral Equations for the Boundary Layer
Simplified Navier –Stokes equation is
 ---------------------------------1
At outer Edge of Boundary layer

---------------------------------------2
From 1 and 2

That is equal to
 -----------------------------------3
Where

Also by continuity equation


-----------------------------------------4
From 3 and 4

From relation between  and
and 


Outside the Boundary layer 

Momentum-Integral Equations for the Boundary Layer is given by

Where
 is Displacement thickness
 is Momentum thickness
 Boundary layer thickness

Above Indicates the free stream's space wise acceleration
The presence of thisterm indicates the presence of a free stream pressure gradient in the flow direction.
For Flow over Flat plate

The momentum equation is reduced to

Following are the realistic utility of momentum equation:
- Flow even though bend pipes
- Jet propulsion and propellers
- Fluid waft even though desk bound and shifting plates or vanes.
- Non-uniform waft via saddens enlarged pipes.
- Hydraulic leap in open channels
If the length of the plate is more than laminar zone (x), the thickness of boundary layer increase in downstream direction due to the increase in 'R'. The layer became unstable and boundary ex layer changes from laminar to turbulent over a short length i.e., i transits zone. The layer continues to increase in downstream, such layer is called as Turbulent boundary layer.
(Re)x,> 5×10⁵, the layer is turbulent boundary layer
Key Takeaways:
If the length of the plate is more than laminar zone (x), the thickness of boundary layer increase in downstream direction due to the increase in 'R'. The layer became unstable and boundary ex layer changes from laminar to turbulent over a short length i.e., i transits zone. The layer continues to increase in downstream, such layer is called as Turbulent boundary layer.
Laminar sub layer is the region in the turbulent boundary layer zone, adjacent to the solid surface of the plate.
The velocity variation in this region is assumed linear as it’s a very thin layer and so that velocity gradient (dy/dx) can be considered constant.
Shear stress in laminar sub-layer
 =
=
For linear variation
 =
=
Key Takeaways:
Laminar sub layer is the region in the turbulent boundary layer zone, adjacent to the solid surface of the plate.
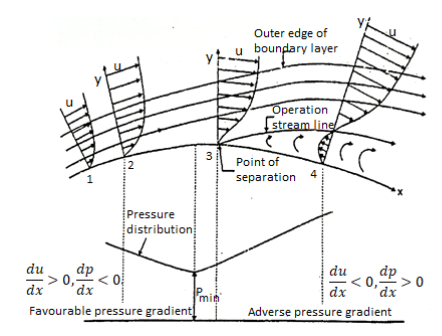
Effect of pressure gradient on boundary layer surface:
Consider steady flow and apply boundary condition at the solid boundary where y = 0, u = 0.
∴
Depending upon the curvature the boundary, there are three possible cases.
1) There is gradual increase in velocity and drop in pressure as the flow passes from 1 to 2 i.e., pressure drop in the direction dp of flow,  <0. The entire boundary layer moves forward, till the pressure gradient less than zero. This condition is called as favourable pressure gradient.
2) The flow retards and pressure increase as flow passes downstream from section 2. This condition is called as adverse pressure gradient. Both pressure and shear force produced continuous retardation in the flow momentum and a stage Coolness when the momentum of the fluid is unable to overcome the surface resistance. It is developed near the curved du surface where velocity gradient  = 0 i.e., at section 3. This dy point at which the boundary layer is on the verge of separation from the surface is called as point of separation.
3) The fluid separated from the surface due to continuous retardation of flow. It has tendency to flow in a direction opposite to the main flow. It occurs beyond the point 3. Where  >0
>0
Location of separation point:
For the given velocity profile, there are three conditions for location of separating point:
1) If  is positive, the flow will remain attached with the surface.
2) If  is zero, the flow is on the verge of separation.
3) If  is negative, the flow is separated.
Methods of controlling the Separating of Boundary Layer:
1) Streamlining body
The streamline of a body is designed in such a way that the point of separation shifted as far as possible on downstream. Due to which wake region becomes narrower and the pressure drug gets reduced.
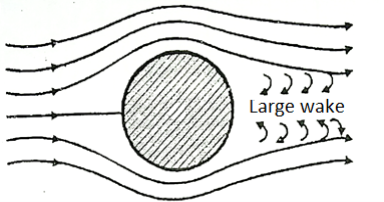
Fig: Sphere
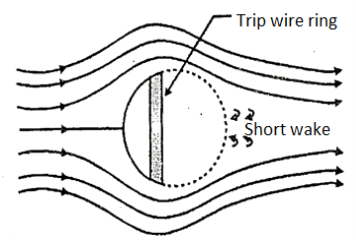
Fig: Tripwire ring

Fig: Aerofoil
2) The artificial roughness (e.g., golf ball) is provided in the approach section, which changes the laminar boundary layer into the turbulent boundary layer.
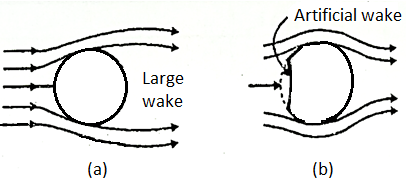
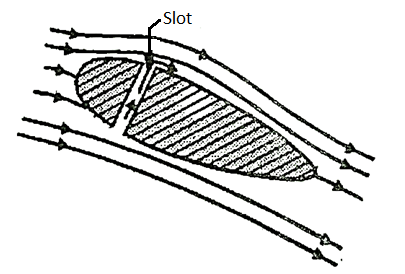
3) Providing the slot near the leading edge so that the fluid layers remain attached to the upper surface of the body for its entire length.
4) Section in which the retarded fluid is sucked out through suction slots in the boundary layer surface.
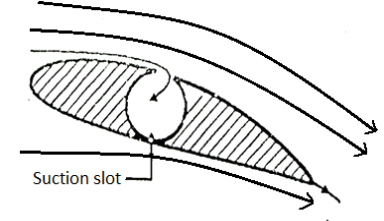
5) Blowing in which addition energy is supplied in the retarded fluid in the boundary layer by injecting high velocity fluid from the blower.
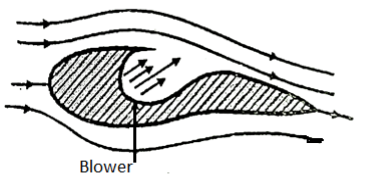
6) Guide vane and splitter vanes are provided in a confined passage to avoid separation in a flow.
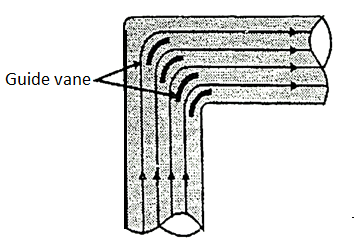
Drag:
- Drag is a mechanical pressure. It is generated with the aid of using the interplay and speak to of a stable frame with a fluid (liquid or gas).
- It isn't generated with the aid of using a pressure subject, withinside the experience of a gravitational subject or an electromagnetic subject, wherein one item can have an effect on every other item without being in bodily contact.
- For drag to be generated, the stable frame should keep up a correspondence with the fluid.
- If there's no fluid, there's no drag. Drag is generated with the aid of using the distinction in pace among the stable item and the fluid.
- There should be movement among the item and the fluid. If there's no movement, there's no drag.
- It makes no distinction whether or not the item movements via a static fluid or whether or not the fluid movements beyond a static stable item.
- Drag is a pressure and is consequently a vector amount having each a value and a course.
- Drag acts in a course this is contrary to the movement of the plane. Lift acts perpendicular to the movement.
- There are many elements that have an effect on the value of the drag. Many of the elements additionally have an effect on raise however there are a few elements which might be precise to plane drag.
- The aerodynamic drag on an item relies upon on numerous elements, along with the shape, length, inclination, and glide situations. All of those elements are associated with the price of the drag via the drag equation.
- Drag force,

- Where FD is same to the drag, rho is the air density, U is the velocity, A is a reference area, and CD is the drag coefficient.
- The drag coefficient is a dimensionless quantity that characterizes all the complicated elements that have an effect on drag.
- The drag coefficient is commonly decided experimentally the use of a version in a wind tunnel.
- In the tunnel, the velocity, density, and length of the version are known. Measuring the drag then determines the price of the drag coefficient as given through the above equation.
- The drag coefficient and the drag equation can then be used to decide the drag on a comparable formed item at exclusive glide situations so long as numerous glide similarity parameters are matched.
- In particular, Mach quantity similarity ensures that the compressibility consequences are effectively modeled, and Reynold’s quantity similarity ensures that the viscous consequences are effectively modeled.
- The Reynolds quantity is the ratio of the inertia forces to the viscous forces and is given through:
Re = V * rho * l / mu
In which l is a reference length, and mu is the viscosity coefficient.
- For maximum aerodynamic objects, the drag coefficient has an almost consistent price throughout a big variety of Reynolds numbers.
Lift:
- Lift is a mechanical pressure. It is generated via way of means of the interplay and make contact with of a stable frame with a fluid (liquid or gas).
- It isn't always generated via way of means of a pressure field, withinside the experience of a gravitational field, or an electromagnetic field, in which one item can have an effect on any other item without being in bodily contact.
- For raise to be generated, the stable frame needs to keep in touch with the fluid: no fluid, no raise.
- The Space Shuttle does now no longer live-in area due to raise from its wings however due to orbital mechanics associated with its speed. Space is almost a vacuum.
- Without air, there's no raise generated via way of means of the wings.
Key Takeaways:
- The aerodynamic drag on an item relies upon on numerous elements, along with the shape, length, inclination, and glide situations. All of those elements are associated with the price of the drag via the drag equation.
- Drag force,

Drag is a mechanical pressure. It is generated with the aid of using the interplay and speak to of a stable frame with a fluid (liquid or gas).
Lift is a mechanical pressure. It is generated via way of means of the interplay and make contact with of a stable frame with a fluid (liquid or gas).
The Drag force Equation is given by,
Drag force, 
Where FD is same to the drag, rho is the air density, U is the velocity, A is a reference area, and CD is the drag coefficient.
Consider the flow of a real fluid past a sphere.
Let
U = Velocity of the flow of fluid over sphere,
D = Diameter of sphere,
p = Mass density of fluid, and
μ = Viscosity of fluid.
If the Reynolds number of the flow is very small less than 0.2 i.e.,  , The viscous forces are significantly more relevant than the inertial forces, as viscous forces are much more dominant than inertial forces, which can be assumed to be negligible in this situation. G.G. Stokes devised a mathematical equation for the total drag on a sphere immersed in a moving fluid with a Reynolds number of up to 0.2, allowing for minimal inertia forces.

Also Skin Friction Drag is two- third of FD, that is equal to) 
NS pressure drag is 1/3 that is 
- Value of CD on Sphere when Re<0.2


This is also called as stokes law
2. Value of CD on Sphere when Re between 0.2 and 5
The inertia forces grow as the Reynolds number rises, therefore they must be considered. Oseen, a Swedish physicist, improved Stoke's law when R is between 0.2 and 5.

This is called Oseen formulae and is valid for R, between 0.2 and 5.
3. Value of CD on Sphere when Re between 5 to 1000.
For Reynolds numbers ranging from 5 to 1000, the drag coefficient is 0.4.
4. Value of CD on Sphere when Re between 1000 to 100,000
CD is independent of Reynolds number in this range, and its value is about equivalent to 0.5.
5. Value of CD on Sphere when Re is more than 105.
For Reynolds numbers greater than 105, the value of C is roughly equivalent to 0.2.
Key Takeaways:
- The Coefficient of Drag is effected by Re values , so the Drag force is affected as well
- Drag force,

Where the values of CD are
Re Range | CD | Comment |
<0.2 | 
| Stokes Equation |
0.2 to 5 | 
| Oseen Equation |
5 to 1000.
| 0.4 | CD Independent of Re |
1000 to 100,000 | 0.5 | CD Independent of Re |
>105 | 0.2 | CD Independent of Re |
Consider a real fluid flowing over a circular cylinder with diameter D and length L, with the cylinder positioned in the fluid so that its length is perpendicular to theflow direction. If the flow's Reynolds number is less than 0.2, i.e.  .
.
The inertia force is negligibly weak in comparison to the viscous force, and the flow pattern around the cylinder will be symmetrical. Inertia forces rise as the Reynolds number increases, hence they must be taken into account while analysing flow through a cylinder. As the Reynolds number rise, the flow pattern becomes asymmetrical in relation to an axis perpendicular to the flow direction. The drag force, or the force exerted on the cylinder by the flowing fluid in the direction of flow,is determined by the Reynolds number of the flow. Experiments have revealed the following:
- When the Reynolds number (Re) is less than one, the drag force is proportional to velocity and the drag co-efficient (CD) is inversely proportional to the Reynolds number.
- As the Reynolds number increases from 1 to 2000, the drag coefficient lowers until it reaches a minimum of 0.95 at Re = 2000.
- As the Reynolds number rises from 2000 to 3 x 10⁴, the drag co-efficient rises as well, reaching a maximum value of 1.2 at Re = 3 x 10⁴.
- As the Reynolds number increases from 3 x 10⁴ to 3 x 10⁵, the value of the co-efficient of drag falls. The value of CD = 0.3 at R = 3 x 10⁵.
- As the Reynolds number is increased beyond 3 x 10⁶, the value of Co rises,
Eventually reaching 0.7.
Key Takeaways:
Drag force, 
Re Range | CD | Comments |
1 to 2000 | 0.95 | CD Lowers till 2000 |
2000 to 3 x 10⁴ | 1.2 | CD rises till 3 x 10⁴ |
3 x 10⁴ to 3 x 10⁵ | 0.3 | CD Lowers |
3 x 10⁶ and up | 0.7 | CD rises |
- An aerofoil (American English) or aerofoil (British English) is the cross-sectional form of an item whose movement thru a fueloline is able to producing widespread carry, which includes a wing, a sail, or the blades of propeller, rotor, or turbine.
- A stable frame transferring thru a fluid produces an aerodynamic pressure. The element of this pressure perpendicular to the relative freestream pace is known as carry.
- The element parallel to the relative freestream pace is known as drag. An airfoil is a streamlined form this is able to producing substantially greater carry than drag.
- Airfoils designed to be used at unique speeds fluctuate of their geometry: the ones for subsonic flight typically have a rounded main edge, at the same time as the ones designed for supersonic flight have a tendency to be slimmer with a pointy main edge.
- All have a pointy trailing edge. Foils of comparable feature designed with water because the operating fluid are known as hydrofoils.
- An aerofoil is a streamlined body built so that separation happens at the very back of the body, resulting in a minimal wake and low pressure drag. Even at high Reynolds numbers, pressure drag is negligible, whereas skin friction drag contributes significantly to overall drag. The resulting force in the case of an aerofoil is roughly perpendicular to the flow direction that is lift. The pressure distribution is primarily responsible for the lift and moments on the aerofoil.
- Chord: An imaginary straight line traced from a cross section of an aerofoil's leading edge to its trailing edge.
- The sharp angle formed by the chord line of the aerofoil and the wind flow direction. The letter 'a' represents it.
- The curvature of the aerofoil from the leading edge to the trailing edge is known as camber. The curvature of the upper surface is referred to as upper camber. The curvature of the lower surface is referred to as lower camber. The mean chamber to the mean line that is equidistant between the upper and lower surfaces at all places.
- According to the theoretical study, the streamline at the trailing edge of the aerofoil can be made tangential to it by properly controlling circulation.
- The circulation is given by,

Lift force is given by using Kutta-Joukowski Equation is,

Lift Coefficient is


The angle of attack is directly related to the coefficient of lift (a). For tiny values ofangle of attack o, the coefficient of lift is fairly near to the theoretical curve. It means that the flow over an aerofoil and the real flow pattern are highly close.
The angle of attack at which the coefficient of lift reaches its highest value  angle of attack the flow splits and the coefficient of drag CD increases somewhat.
Lifting efficiency is defined as the ratio of lift to drag coefficient
Beyond a 10° angle of attack, the lifting efficiency plummets.
Drag force, 
Lift Force,
Key Takeaways:
An aerofoil is a streamlined body built so that separation happens at the very back of the body, resulting in a minimal wake and low pressure drag carry, which includes a wing, a sail, or the blades of propeller, rotor, or turbine.
- Magnus effect, technology of a sidewise pressure on a spinning cylindrical or round stable immersed in a fluid (liquid or gas) whilst there may be relative movement among the spinning frame and the fluid.
- Named after the German physicist and chemist H.G. Magnus, who first (1853) experimentally investigated the impact, it's far answerable for the “curve” of a served tennis ball or a pushed golfing ball and influences the trajectory of a spinning artillery shell.
- A spinning item transferring via a fluid departs from its instantly course due to stress variations that increase withinside the fluid because of pace adjustments caused via way of means of the spinning frame.
- The Magnus impact is a selected manifestation of Bernoulli’s theorem: fluid stress decreases at factors wherein the rate of the fluid increases. In the case of a ball spinning via the air, the turning ball drags a number of the air round with it.
- Viewed from the location of the ball, the air is speeding via way of means of on all sides. The drag of the aspect of the ball becoming the air (into the course the ball is traveling) retards the airflow, while on the opposite aspect the drag accelerates the airflow.
- Greater stress at the aspect wherein the airflow is bogged down forces the ball withinside the course of the low-stress place on the alternative aspect, wherein a relative growth in airflow occurs.
Magnus Force
When we consider a rotating ball that is likewise rotating in a cross-flow, the force is now exerted to the body that is perpendicular to the trajectory. We can figure out in which direction or angle the ball will deviate, because according to Thomson, a spinning ball is only supposed to deflect in the direction in which the ball's "nose" is turning. With this knowledge, we may conclude that in a projectile motion of a ball, the ball travels the most distance when rotated nose up to the ground, and the shortest distance when rotated nose down to the earth.
- Effect of Surface on Magnus Force
A cylinder with a smooth surface can produce Magnus effect, although it produces less Magnus effect than a cylinder with a rough surface. The concept of rough surface (dimples) was created in the early twentieth century to support this viewpoint. The roughness affects the flow of the boundary layer. The surface of a golf ball, for example, is dimpled. The shift to turbulent flow caused by these dimples minimises drag.
- Negative Magnus effect
The aerodynamic features that affect a Magnus rotor are the circumferential speed of the rotor and the free stream velocity. One of the researchers, Lafay, discovered a secondary force that works in the opposite direction of Magnus' conclusion. At low velocity ratios, the negative Magnus effect can be seen at various Reynolds numbers. This effect is also influenced by the cylinder's surface. Negative Magnus force is a major worry for rotor planes because it can destabilise the aircraft by compromising the lift force.
- Magnus Effect on Cylinder
Mathematical representations can be used to demonstrate the Magnus effect. In a frictionless flow, R0 is the radius of the cylinder. The pressure can be calculated using Bernoulli's equation.

On Top side,

On Bottom side,

Difference

Pressure Across cylinder

On the top of the cylinder, the pressure is lower. The irrotational pressure (Magnus effect) on the cylinder is given by the side of the vertical lines passing through the cylinder's centre in our final equation.
Key Takeaways:
Magnus effect, technology of a sidewise pressure on a spinning cylindrical or round stable immersed in a fluid (liquid or gas) whilst there may be relative movement among the spinning frame and the fluid.
References:
1. Introduction to fluid mechanics and Fluid machines by S.K Som, Gautam Biswas, S Chakraborty.
2. Fluid mechanics and machines by R.K Bansal.
3. F. M. White, Fluid Mechanics, 6th Ed., Tata McGraw-Hill, 2008.
4. Fluid Mechanics and Its Applications by V.K.Gupta et.al.
5. Fluid Mechanics by Yunus Cengel.