Unit - 2
Material Engineering
In static failure theories Loads are assumed to not vary over time. In most cases, machine parts are subjected to combined loading, and it is almost impossible to determine material properties economically under realistic loading conditions. Simple tension/torsion tests are used to determine material properties. These statistics, such as Syt and Sut, are given in the form of a table in design data books. Theories of failure establish a link between the strength of a machine component subjected to a complicated state of stress and the material properties derived from a basic test. Ductile material is limited by shear strength and brittle by tensile, so they have different theories of failure. Dynamic loading reduces the difference between ductile and brittle material failure and hence ductile material perform same as brittle in Dynamic loading.
Accepted failure theories for ductile material
- Maximum Principal/Normal Stress Theory (Rankine’s Theory)
- Maximum Shear Stress Theory (Guest’s Theory) (Tresca)
- Maximum Principal /Normal Strain Theory (Saint’s Theory)
- Maximum Strain Energy Theory (Haigh’s Theory)
- Maximum Distortion Energy Theory (Hencky & Von Mises Theory)
Accepted failure theories for Brittle material
- Maximum Normal Stress Theory (Even Material) (Rarely used)
- Maximum Normal Stress Theory (Uneven Material) (Rarely used)
- Coulomb Mohr Theory
- Modified Mohr Theory
While design component with this failure theories, FOS must to considered for safer and reliable component
Factor of safety
Factor of safety: It is defined as ratio of maximum stress to working stress
Mathematically FOS = 
For Ductile material, FOS = 
For brittle material, FOS = 
Typical values
Application | FOS |
Aircraft components | 1.5-2.5 |
Bolts | 8.5 |
Pressure vessels | 3.5-6 |
Reliable material, normal condition | 1.3-1.5 |
Ordinary material, normal condition | 2-2.5 |
Unreliable material, severe condition | 3-4 |
Importance of FOS
- There is variation in properties of material like yield strength, ultimate strength
- Uncertainty in variation of external loads and forces
- Variation in dimension of component due to lack of workmanship
- To ensure safety of component from above mentioned variation and uncertainty, Factor of Safety is useful in Design
Key Takeaway:
- Ductile, isotropic materials are limited by their shear strengths, the most use theory for Ductile material are Tresca and Von Mises
- Brittle materials are limited by their tensile strength. The Failure mechanism use most of time are Coulomb Mohr and Modified
- FOS is important for design safer and reliable component, higher the uncertainty regarding material and external forces higher the FOS for safer Design
The failure of a material under load by breaking into two or more pieces is referred to as fracture. Fracture can occur in any service environment. Failure occurs when materials are subjected to alternating or cyclic loading (as in machines). In such cases, the fracture is known as a fatigue fracture. Creep fracture can cause materials to fail at high temperatures.
Types of failure
Yielding- This is due to excessive inelastic deformation rendering the machine part unsuitable to perform its function. This is more common with ductile materials.
Fracture: The component in this scenario splits into two or more pieces. This is more common with brittle materials.
Ductile Fracture
The rupture of a material following a significant amount of plastic deformation is known as a ductile fracture. Beyond the ultimate tensile strength, which is at the maximum point in the load-elongation curve, materials begin to neck. The smaller cross-section of the specimen at the middle is referred to as the neck.
Fully ductile materials will continue to neck down to an infinitesimally thin edge or point, failing as the cross-section at the neck becomes too small to carry the load. When the smaller cross-section still has a substantial area, the more typical type of ductile fracture occurs. Cracks are observed to form at brittle particles, either natural brittle particle found in multiphase materials, such as cementite in steel or foreign inclusions, such as oxide inclusions in copper. It is difficult to maintain compatibility in the neck region between the constantly deforming matrix and the node-forming particle when a brittle particle is present. This causes very small voids to emerge near the matrix-particle interface. If the fracture starts at the pores in the neck, the voids are already present. With increasing distortion, the voids develop to be on the order of a millimeter in size. The material may tear at this point. Due to the presence of these discontinuities, the effective cross-section of the neck is modest, even though the apparent cross-section may be significant. The discovery that materials of very high purity are resistant to ductile fracture supports this paradigm of ductile fracture. Which contain no inclusions or pores, and which burst in a totally ductile way is after it has been thinned to a point or an edge.
Brittle Fracture
Brittle fracture occurs when a material fails without showing signs of plastic deformation. The original shape and dimensions of the specimen are restored if the fragmented fragments following a brittle fracture are put together. Fracture can be viewed as the pulling apart and breaking of interatomic links between two adjacent atomic planes in an ideal material. The amount of tensile stress necessary to break interatomic bonds across two neighboring atomic planes is on the order of Y/6, where Y is the material's Young's modulus. Brittle materials, on the other hand, break at a significantly lower stress, around Y/1000.
Parameter | Brittle | Ductile |
Plastic Deformation | Large | Small |
Necking | NO | Yes |
Crystal Packing structure | BCC, HCP | FCC |
Fracture surface | Rough contours, dirty surface | Sharp facets which reflect light |
Materials | Ceramic, Glass | Most Metals |
Warning sign | NO | Yes, Plastic deformation |
Crack propagation | Fast | Slow |
Deformation | Little | Extensive |
Strain Energy Required | Lower | Higher |
Stress during cracking | Constant | Increasing |
Stress v/s Strain | 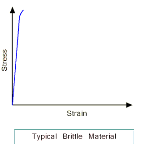 | 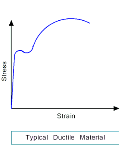 |
Shape diagram  |
 |

|
The Ductile-Brittle Transition
The conditions under which a material becomes brittle are determined by a number of factors. To move dislocations in BCC metals, a large stress is usually required, and this stress grows fast as temperature decreases. On the other hand, the stress required to propagate a crack is not a strong function of temperature. As a result, at a specific temperature known as the ductile-brittle transition temperature, the stress required to propagate a fracture, σ f, is the same as the stress required to relocate dislocations, σ y. When σ y<σ f and the material first yield plastically at temperatures greater than the transition temperature. The material is brittle at temperatures below the transition temperature. The yield stress may control the actual brittle fracture stress in this case, as some microscopic yielding may be required to nucleate a crack. As a result, σ f = σ m at all temperatures below the transition point. The fracture is nucleated at the intersection of slip planes as soon as the applied stress approaches σ y, and it propagates fast. The temperature at which a metal transitions from ductile to brittle is highly influenced by its composition. Steel is the most prevalent metal that exhibits this property. For some steels the transition temperature can be around 0°C, and in winter the temperature in some parts of the world can be below this. As a result, several steel structures are at risk of collapsing over the winter. So, it is significant to design the component considering the ductile Brittle transition temperature if the component is subject to low temperatures, the composition of material must be altered to lower this transition temperature of material to prevent brittle failures at low temperatures
Key Takeaway:
- Ductile material have plastic deformation brittle doesn’t. Fully ductile materials will continue to neck down to edge or point, failing as neck becomes too small to carry the load
- Ductile material breaks with formation of neck, brittle material breaks without warning
- Ductile Brittle transition temperature is temperature below which ductile materials behaves as the brittle and is dependent on composition of material
This theory is credited to CA Coulomb, H Tresca and JJ Guest. The theory States that “Failure of mechanical component subjected to bi-axial or tri-axial stress occurs when the maximum shear stress at any point of component becomes equal to maximum shear stress in standard specimen of tension test, when yielding starts”. The Maximum Shear Stress theory predicts that yield strength in shear is half of yield strength in tension
Sys = 0.5 * Syt
Explanation
Considering the principals stresses be σ1, σ2 and σ3 at point on component the shear stress on plane would be
 ,
, ,
, .
.
According the theory largest stress  is equal to Syt/2,
 or σ1 – σ2 =
Similarly for all planes σ2 – σ3 = , σ3 – σ1 =
 ,
,
For compressive stress
σ1 – σ2 = ,
,
σ2 – σ3 = ,
,
σ3 – σ1 =
Assuming  =
= ,
,
The equation can be written as
σ1 – σ2 =
σ2 – σ3 =
σ3 – σ1 =
Construction of Region of safety
The equation x + y=1 is equation of line with slope 45 degrees, σ1 – σ2 = is line with slope of 45 degrees and points on =
 in respective quadrant
In first quadrant both stress are positive so limiting condition depends on magnitude, if σ1 > σ2 then σ1=+Syt. Draw line AB, if σ2 > σ1 then σ2=+Syt. Draw line CB
In third quadrant both stress are negative so limiting condition depends on magnitude, if σ1 > σ2 then σ1=-Syt. Draw line DE, if σ2 > σ1 then σ2=-Syt. Draw line EF
In second quadrant both stress are opposite so limiting condition depends on their difference,
σ1 -σ2 =-Syt. Draw line DC,
In fourth quadrant both stress are opposite so limiting condition depends on their difference,
σ1 -σ2 =+Syt. Draw line FA
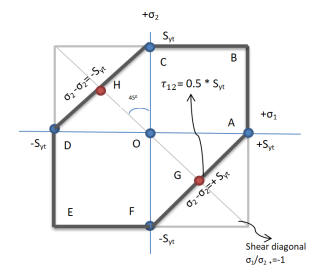
The complete region is hexagon ABCDEFA and if coordinates lie in this region the component is safe, to find the dimension of component factor of safety is considered
Considering FOS to find dimension of component,
 ,
,  ,
,
Key Takeaway:
- The Maximum Shear Stress theory predicts that yield strength in shear is half of yield strength in tension Sys = 0.5 * Syt
- Region of safety is hexagonal
- Theory is used for Ductile materials
- Equivalent stress

- Maximum shear stress
 ,
, ,
, .
.
- Orthogonal Shear Stress


This is also known as Distortion-Energy Theory. The theory states that failure of mechanical component subject to bi-axial or tri-axial stress occurs when strain energy of distortion per unit volume at in any point in component becomes equal to strain energy of distortion per unit volume in standard specimen of tension test when yielding starts
The unit cube is subjected to threes principal stresses σ1, σ2 and σ3, the strain energy will be
 ----------------1
ε1, ε2 and ε3 are strains
Also,
 -------------------------2
Therefore,
From I and 2
 ----------3
Total strain energy is resolved in two components Uv correspond to change in volume and no distortion change, Ud correspond to change in distortion and no change n volume
U= Ud+ UV
 ---------4
Ud = U - UV
From 3 and 4
 ------------------------------------------------5
For simple tension test σ1= Syt and σ2=σ3=0
 ------------------------------------------------6
Therefor from 5 and 6 criterion for failure for distortion theory is expressed as

For bi-axial load σ3=0 and 

Replacing  by
by 

Therefore, according to distortion-energy theory, yield strength in shear is 0.577 times the yield
Key Takeaway:
- In distortion-energy theory, yield strength in shear is 0.577 times the yield
- Region of safety is elliptical
- Theory is used for Ductile materials
- Equivalent stress

- Von Mises stress for tri-axial loading

This theory was proposed and credited to W.J.M Rankine in 1850.Maximum Normal Stress Theory predicts failure of machine component which are subject to complex loading. The theory states “Failure of Mechanical component subject to biaxial or tri-axial stress occurs when maximum principal stress reaches the yield or ultimate strength of material”.
Explanation
Considering the principals stresses be σ1 > σ2> σ3
So, the maximum principal stress is σ1
So, failure will occur at σ1 = Syt or Sut
Considering Factor of safety
σ = Syt / FOS or σ = Sut / FOS
σ = Syc /FOS σ = Suc / FOS
This theory is not a safe measure for ductile materials and is not recommended, but it gives good prediction with brittle materials.
Construction of Region of safety
For biaxial stresses there will be two principal stresses σ1 and σ2 let them be plotted on X and Y axes
Tensile stresses are positive and compressive stresses are negative and are equal in magnitude that is Syt= Syc
The equation of line passing through a point on axis is axis = distance of point from origin
According to theory, only maximum principal stress is considered, other are neglected
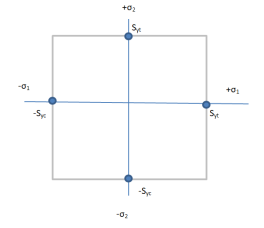
Case 1: σ1 > σ2, Let σ1 be tensile stress and σ2 be compressive stress.
Neglecting smaller stress σ2 and considering limiting factor of σ1 that is Syt.
Therefore, boundary will be σ1=+Syt. Draw line AB
Case 2: σ1 > σ2, Let σ1 be compressive stress and σ2 be tensile stress.
Neglecting σ2 and considering limiting factor of σ1 that is -Syc. Therefore, boundary will be σ1=-Syc. Draw line DC
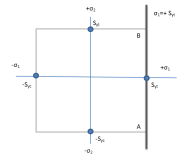
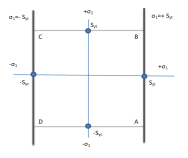
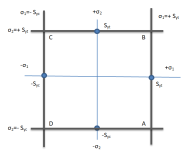
Case 3: σ2 > σ1, Let σ2 be tensile stress and σ1 be compressive stress.
Neglecting σ1 and considering limiting factor of σ2 that is Syt. Therefore, boundary will be σ2=+Syt. Draw line CB
Case 4: σ2 > σ1, Let σ2 be compressive stress and σ1 be tensile stress.
Neglecting σ1 and considering limiting factor of σ2 that is -Syc. Therefore, boundary will be σ2=-Syc. Draw line DA
According to theory if coordinates of σ1 and σ2 falls out of square ABCD formed by lines, then component will fail
Key Takeaway:
- In distortion-energy theory, Failure occurs when σ1 = Syt or Sut
- Region of safety is square
- Theory is rarely used for designing component
- Maximum normal stress is maximum value among them σ1 > σ2> σ3
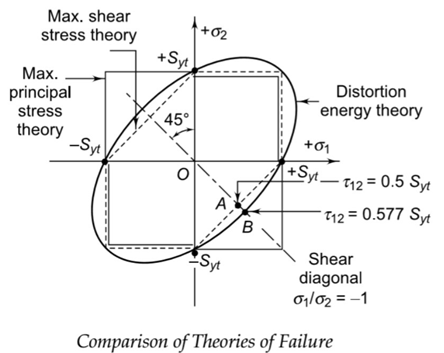
The Mohr Theory of Failure is based on the famous Mohr's Circle, often known as the Coulomb-Mohr criterion or internal-friction theory. Mohr's theory is frequently applied to examples of 2D stress in order to forecast the failure of brittle materials. According to Mohr's theory, failure occurs when the envelope generated by the two Mohr's circles for uniaxial tensile strength and uniaxial compression strength is exceeded at a place in the body. At the material's limiting compression stress  c, the left circle represents uniaxial compression. Likewise, at the limiting tension stress
  t, the right circle represents uniaxial tension. The maximum allowed stress for an intermediate stress state is shown by the middle Mohr's Circle (dash-dot-dash line).
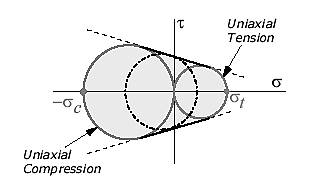
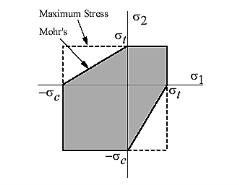
The following table categorizes all intermediate stress states into one of four groups. To avoid failure, each instance specifies the maximum permissible values for the two main stresses.
Quadrant | Case | Criterion |
1 |   |     |
2 |   |  |
3 |   |     |
4 |   |  |
Mohr coulomb failure criterion For Sand
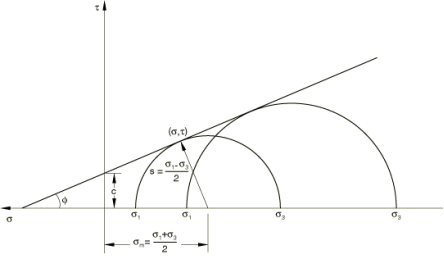
The Mohr coulomb criterion describes a linear relationship between normal and shear stresses at failure. It is the linear envelope derived by plotting the material's shear strength against applied normal stress.
Equation: τ=c−σtanϕ, τ = c – σ
C = Shear stress intercept
σ = Normal stress
ϕ = Angle of internal friction
The grain size affects the angle of friction Ø. If Ø = 0, Mohr coulomb criterion is reduced to the Tresca criterion. If Ø = 90, then Mohr coulomb model is equivalent to the Maximum Normal Stress or Rankine model and higher values of Ø are not allowed
Between principle stresses and residual stress, a Mohr circle is plotted. Instrument is used to obtained values of σ 1 and σ 3. Peak shear strength is indicated by Shear intercept line
Strength of rock material is described by radius of circle, smaller the circle lowers the strength, larger the circle higher the strength of rock if circle is inside the line. Circles are combination of maximum load and confined pressure. The tangent point between circle and shear intercepts is maximum strength of rock and rock will fail at this point, the state of stress is called critical stress, so for safe design the circle must not touch the line that state is called safe state of stress
Cracks are produced with releasing residual stress when load increased to maximum point, lower the cracks in rock higher the residual stresses. Fine grain gives high strength than coarse grain
Key Takeaway:
- This is plot between shear strength of the material versus applied normal stress
- If Ø = 0, model is like Tresca, if Ø = 0 model becomes like Rankine
- Rock or material will fail at tangent point between circle and shear intercepts
Modified Mohr’s Theory
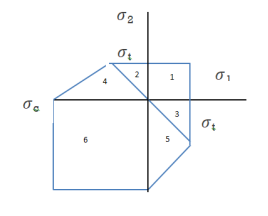
This theory, which is a variation of the Coulomb-Mohr theory, is the most popular for brittle materials. The following table categorizes all intermediate stress states into 6 groups. To avoid failure, each instance specifies the maximum permissible values for the two main stresses. This Theory is Closest to Experimental Results
Region | Criterion |
1 |     |
2 |   |
3 |   |
4 ,5 |  |
6 |     |
Key Takeaway:
This theory is more conservative and closest to experimental results and is most used for brittle material
Fracture mechanics is a branch of mechanics dealing with the investigation of crack propagation in materials. It calculates the driving force on a crack using analytical solid mechanics methods and characterizes the material's resistance to fracture using experimental solid mechanics methods.
Fracture Toughness
All engineering materials will inevitably have defects, fissures, or faults. They can be introduced during the material's solidification, manufacturing, or heat treatment stages. As a result, the fracture resistance of a machine component or an engineering structure must be assessed in the presence of cracks. The fracture toughness of a material is its resistance to fracture in the presence of cracks or discontinuities.
The fracture toughness is specified by the critical value of a parameter Gc in the Griffith approach. When an unstable crack extends (leading to fracture), Gc represents the strain energy released per unit area of the crack surface. The critical strain energy release rate Gc for an elastic crack of length 2c is equal to 
Therefore, for elastic material,
Gc = ϒ and for brittle material, Gc = ϒp
Modes of Fracture
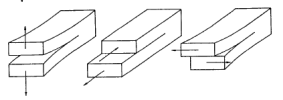
Opening (mode I), in-plane shear (mode II), and (mode III) out-of-plane tearing are the three primary modes Normal separation of the fracture sides under the action of tensile loads corresponds to Mode I, which is by far the most commonly found in practice. The difference between Mode II and Mode III is that in the former, the shearing action is parallel to the crack front in the plane of the crack, whereas in the latter, the shearing action is normal to the crack front in the plane of the fracture. In actuality, a cracked body can be loaded in any of these three modes, or a combination of them.
Key Takeaway:
- Fracture mechanics is a branch of mechanics dealing with crack propagation and resistance to fracture from material in the presence of cracks or discontinuities is called Fracture Toughness
- Failure can occur in 3 modes Opening (mode I), in-plane shear (mode II), and (mode III) out-of-plane or from combination of three
The stress intensity factor is generally determined by the applied stress, crack size, and geometry.

The crack tip stress field is influenced by the geometry of the cracked body, which changes the value of the stress intensity factor. When an edge crack occurs in a strip of finite width w, the correction factor becomes a
Function of (a/w)
Y=f(a/w).
Where a is crack length, Y is the geometry factor, which represents the crack system's geometry in proportion to the applied load. This geometry component is usually found in technical reference books. Y = 1.0 for a central crack in an infinite plate. The most basic geometrical factor is that for an edge crack of length and at the edge of a semi-infinite half space, the enhanced capacity of the fracture to open causes the stress intensity factor to increase by around 12%.
Crack in an infinite body

Edge crack in a semi-infinite body

The critical stress intensity factor KIc is another measure that is more typically employed to define a material's fracture toughness.

C is crack length, Fracture begins in a material when KIc is exceeded, either by rising stress, increasing c, or both. KIc is a material property that may be measured using fracture testing, exactly like yield strength, UTS, and so on. KIc for mild steel is about 25 MN-m–3/2
Key Takeaway:
- The stress intensity factor depends upon applied stress, crack size, and geometry. The geometry component is 1 for crack in infinite body, 1.12 for edge crack
Griffith proposed a criterion for the propagation of a brittle material's pre-existing crack. Consider a 2c-long lens-shaped crack. The fracture travels from the front to the back face of the material, which is of unit thickness. The crack tends to lengthen in the transverse direction when a longitudinal tensile stress σ is applied.
A loaded brittle body undergoing a crack expansion, the atomic or surface energy (S) is absorbed in crack growth while some stored Strain energy (U) is released as crack expands. The atomic energy (S) has constant value per unit area and this is linear to crack length (a). Strain energy is related to square of crack length and hence has parabolic relation
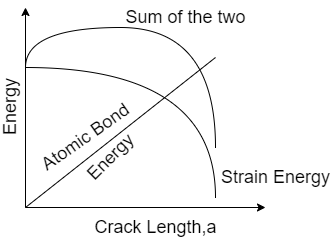
Because elastic strains cannot be continuous across the broken region, as the crack expands, the crack's surface area grows while the elastic strain energy stored in the material diminishes. If ϒ is the material's surface energy per unit area, then the crack's surface energy is 4ϒc.
As the crack expands, two surfaces are formed where ϵ is the elastic strain, is the elastic energy density (elastic energy per unit volume of the material).
The elastic energy density becomes  when E is substituted by the Young's modulus Y. We can assume that no elastic energy is stored in a cylindrical volume around the crack, where there are no lines of force, as a first approximation.
As a result, when the crack is introduced, the elastic energy released is equal to 

The negative sign of the second term implies that as the fracture forms, the elastic energy held in the material is released. This is in contrast to the energy expended in forming the crack's two surfaces.
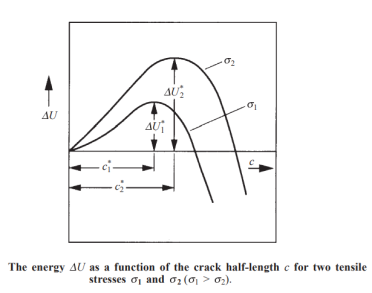
Setting dU/dc = 0 yields the critical value. Because the applied tensile stress is an external variable in a given material with a preexisting break of length 2c, the critical condition is best expressed as a critical fracture stress.

This is called Griffith’s energy balance criterion for crack propagation
When a stress σ is applied, the stress concentration σmax at the tip of a fracture is given by

Where ϼ is the radius of curvature at the tip of the crack.
Key Takeaway:
- Griffith equation defines relation between applied normal stress and crack length.
- Griffith established the criterion that a crack will propagate when decrease in elastic strain energy is at-least equal to energy required to create a new crack surface. Atomic or surface energy is absorbed while strain energy is released.
- Strain energy is related to square of crack length and hence has parabolic relation
Methods of Protection against Fracture
Surface treatment
The most essential strategy for preventing brittle fracture is surface treatment. Several experiments have demonstrated that surface cracks are the ones that cause failure. When hydrofluoric acid is used to etch the surface of a glass, the surface layers and cracks are eliminated. As a result, newly etched glass has more strength than un-etched glass. If this fact is to be used as a source of strength, the etched surface must be protected from further mechanical abrasion that is expected to occur during operation, as well as environmental effects like corrosion.
Tempering
Other procedures can also be used to render surface fractures ineffective. When a compressive stress is applied to the surface, the tensile tension required to propagate the surface fractures increases by a factor of the compressive stress. Tempered glass for store windows and automotive windshields is manufactured using this method. The silicate glass is annealed long enough to remove all residual tensions after being heated above its softening temperature. The surface layers of the glass are then rapidly cooled by a blast of cold air directed against it. They shrink and stiffen. The heat transfer from the inside to the surface is slow because glass is a poor thermal conductor. The inside remains above the softening temperature, allowing it to flow viscously to compensate for the surface contraction. The inside is eventually cooled to ambient temperature as well. The stiff outer layers now resist the accompanying contraction, resulting in compressive stresses in the outside layers and tensile stresses in the interior. Tempering is a thermal treatment that makes a material more resistant to crack propagation. Compressive pressures can raise the glass's fracture strength by 2–3 times.
Fatigue is a type of failure that occurs in structures that are subjected to fluctuating and dynamic stresses. Because this form of failure usually occurs after a long period of recurrent stress or strain cycling, the term fatigue is utilized. Fatigue is significant because it is the most common cause of metal failure, accounting for over 90% of all failures. Even in ordinarily ductile metals, fatigue failure is brittle in nature, with little to no extensive plastic deformation. The process is initiated and propagated via fractures, and the fracture surface is usually perpendicular to the tensile stress direction.
Cyclic Stresses
A reversed stress cycle, for example, is described as cycling between equal magnitudes of maximum tensile stress and minimum compressive stress.
 Mean stress (fatigue tests)
 Range of stress (fatigue tests)
 Stress amplitude (fatigue tests)
 Stress ratio (fatigue tests)
It happens at lower stresses than failure at static loads, i.e., stress levels lower than yield or ultimate strength. Localized stress (strain) concentrations start failure on the surface (or around it). Surface flaws that emerge on cyclic loading or notches as traces of surface treatment or the action of the surrounding media produce local stress concentrators. The accumulation of flaws in the material, the nucleation of fatigue cracks, the gradual propagation and combining of some cracks into a single main crack, and the fast final destruction are all stages of failure. The structure of failure is usual, and it reflects the succession of fatigue processes. The early zone of destruction (the nucleation zone of micro cracks), the fatigue zone, and the final failure zone are usually present in a failure (Fig. 14). The first zone of failure is usually at the surface, is tiny, and has a smooth surface. The fatigue zone is the area where a fatigue crack develops over time. It contains classic concentric ripple lines, which are signs of fatigue cracks propagating in a jump-wise manner. The fatigue zone forms when the growing stresses in the steadily reducing actual segment reach a point where instantaneous destruction occurs and the zone of final failure is formed.
Causes of Fatigue Failure
Fatigue failures occur for a variety of reasons, the most common of which are:
- Surface flaws such as machining marks and surface irregularities are the most common causes of fatigue failures.
- Notches, keyways, screw threads, and matching under-cuts are examples of stress concentrations.
- The fatigue strength is great at low temperatures and gradually diminishes as the temperature rises.
- Corrosive conditions lower fatigue strength.
Thermal fatigue is generally caused by varying thermal loads at elevated temperatures; mechanical pressures from an external source are not required. The source of these thermal stresses is a restriction on the dimensional expansion and/or contraction that would normally occur in a structural member when temperature varies. According to the coefficient of thermal expansion and the modulus of elasticity E, the magnitude of a thermal stress generated by a temperature change  T is determined by the coefficient of thermal expansion and the modulus of elasticity E.

Corrosion fatigue is a kind of failure caused by the combined action of cyclic stress and chemical attack. Corrosive surroundings have a negative impact and result in a lower fatigue life. The fatigue behavior of various materials is affected by even the usual ambient environment. As a result of chemical reactions between the environment and the material, small pits can form, which serve as stress concentration areas and thus crack nucleation sites.
Mechanism of Fatigue Failure
This is linked to the creation and accumulation of micro plastic deformations in the surface layer, and it is based on dislocation movement. Because of the anisotropy and random alignment of crystals in the metal structure, dislocation movement under stresses below the yield limit is a possibility. The stresses that emerge in some crystals at relatively low mean stresses may be adequate for movement of weakly 'locked' dislocations. Aside from thin surface layers (to a depth of 1-2 grains), the stress required for the operation of Frank-Read dislocation sources is normally low. As a result, microplastic deformations and thin surface layer damage can be seen in mild annealed metals even at an early loading stage, 1-5 percent of the total number of cycles to failure. Extrusions and incursions develop as slip lines become broader, shift to slip bands, and eventually devolve into extrusions and intrusions. An extrusion is a bulge and intrusion, as well as a slip band depression. Surface extrusions and intrusions (ridges and recesses) create a rough relief. Recesses are areas where strain is concentrated, resulting in voids and dislocations.
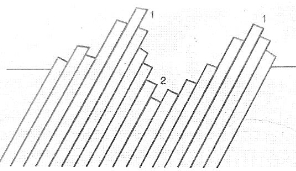
Figure shows Slip Arrangement in (Region1) Extrusion and (Region2) in Intrusion. Slip lines appear on the surface as a result of microplastic deformations, with the density of these lines rising as the number of cycles increases. When dislocations reach the surface, their damage is amplified, and steps occur. The production of voids and loose spots as a result of a high local density of vacancies and dislocations might result in the formation of sub-micro-cracks. The production of micro cracks is triggered by the development and merging of sub-micro cracks. "Progressive fractures" is a term used to describe fatigue. The mobility of atoms is increased at high temperatures, allowing for more slip and deformation before fracture. Acute variations in cross-section, the base of surface scratches, the root of a screw thread, the edge of small foreign substance inclusions, and a minute blow hole or similar interior flaws all produce highly localized stress.
Key Takeaway
- Fatigue is a type of failure that occurs in structures that are subjected to fluctuating and dynamic stresses. Can be caused by mechanical (cyclic, reverse cyclic stress), thermal stresses or corrosion and accounts for over 90% of all failures
- Stages of Failure are the nucleation of fatigue cracks, the gradual propagation and combining of some cracks into a single main crack, and the fast final destruction
- Surface Flaws, Sharp Corners, Notches increase’s stress concentration and thus increases risk of fatigue failure
This is commonly used to calculate overall life expectancy. For some element of the component that is determined to be representative, a stress-time history is estimated. Geometric factors are then used to convert this into a stress-time history at the place where a crack is most likely to begin. These have traditionally been derived from tables and graphs of stress concentration factors, which frequently do not cover the specific component geometry in use. Material data is next introduced in the form of total separation tests on small smooth specimens, with life N plotted against a nominal stress S. When the stress-time history at the specified critical point is compared to this S-N curve, a component's life can be estimated. S-N charts for full components are created using a version of this method. Estimates of component life are then limited to that component, and any slight modifications in its geometry should be rigorously followed by a new test procedure. Welds in metals are a special example of component testing. S-N data published in standards like BS7608, which relate overall life to a nominal stress remote from the weld, is the product of extensive testing. This isn't fundamental materials information, as is frequently assumed, but component information related to a particular sort of weld. The S-N technique considers that the structure is fully elastic, not just structurally, but also in terms of local fatigue features like notches. As a result, it should only be utilized in very specific circumstances. As a result, it's only useful for (low load-long life) high cycle fatigue (HCF)
Fatigue properties of material are described by SN curve. It is also called has Wohler curve. SN curve is curve describe relation between cycle stress amplitude and number of cycles the specimen holds till failure Horizontal axis represents “No of cycle” in logarithmic scale; Vertical axis can either be in linear or logarithmic scale and can either represent “stress amplitude” or maximum stress SN curve are found out by fatigue testing carried out on metal coupon testing machine, in which small metal coupon is placed and cyclic stress with constant amplitude is applied till specimen fails or exceed large No of cycles (N>106 ) and results are interpreted infinite life.
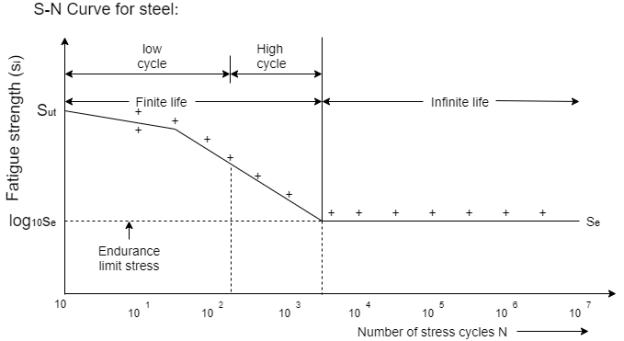
Regions of SN curve (Infinite, High cycle Fatigue, Low cycle Fatigue)
Infinite region
In this region, the stress levels are below a certain number and infinite no if cycles can be performed without causing fatigue failure. To determine if a component is operating in the infinite life region, the Goodman-Haigh diagram is often used. See in figure steel has distinct limit whereas metals like aluminum and other do not always have distinct limit.
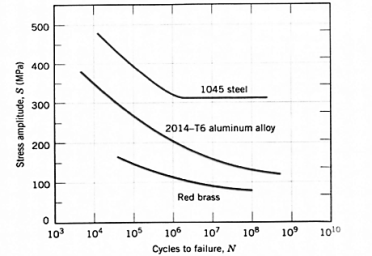
Elastic region or High cycle fatigue Region
In this region, stress and strain exhibit linear relationship. After each load cycle, material returns to original shape. This region is also called High cycle fatigue region (N = 103 to 106), because high number of stress cycles at low amplitude can cause material to fail. The fatigue occurring in this region is called High-CycleFatigue. Residual stresses and sharp counters in geometry can affect the failure of material, smooth geometry decreases crack initiation
Plastic Region or Low Cycle Fatigue
In this region material experience high stress and causes permanent change to shape of material. This region is also called as the “Low Cycle Fatigue” region (N ≤ 103) as a low number of stress cycles, with a high amplitude result in failure.
SN curve Slope (K factor)
The slope of the log-log SN-Curve is defined as “k-factor”. The relationship between stress and the number of cycles to failure is governed by this "k-factor.". Wohler has developed the k-factor to easily relate the load, stress to the life, number of cycles to failure. As this is log v/s log relationship, a small change in stress amplitude can cause very large change in the fatigue life This helps in increasing the speed of testing
Limits of the S-N Curve
The S-N method can be used in circumstances when all stresses, including local ones, are elastic. In practice, this means that the S-N curve should be limited to numbers bigger than 10,000 cycles on the life axis.
Key Takeaway
- SN curve method only applicable to HCF region
- HCF (N = 103 to 106)
- LCF (N ≤ 103)
Fatigue limit is also called endurance limit (Se), It is limit below which infinite number of repetitive load cycles of completely reversed bending stress can be applied before causing any fatigue failure on new standard specimen.
The fatigue limit term is used for materials having distinct limit like ferrous alloys whereas fatigue strength term is used when material don’t have distinct limit and can even fail at small stress amplitude.
It's vital to understand that a material's Endurance Limit isn't an exact or entirely reproducible quantity. In reality, as shown in the S-N diagram below, numerous seemingly identical samples cut from neighboring sections of one bar of steel will exhibit various endurance limit values when tested.
![Figure 1. S−N curves for aluminium and low-carbon steel [1].](https://glossaread-contain.s3.ap-south-1.amazonaws.com/epub/1642706419_2479928.png)
Cycle to Failure The number of cycles a sample must go through before failing is known as the cycle to failure. The greater the load, the fewer the number of failure cycles. The cycles to failure are theoretically infinite if the stress is below the material's Endurance Limit.
Fatigue life N is another key metric that determines a material's fatigue behavior. The number of cycles required to cause failure at a given stress level, as shown by the S–N plot. To provide a suitable fatigue life, it is vital to keep the following points in mind during the design process:
- Modification of design to avoid stress concentration by removing sharp recesses and a severe stress raiser.
- Surface finish precision by avoiding surface damage from abrasive machining, punching, stamping, shearing, and other processes.
- Controlling corrosion, erosion, and chemical assault in the field, as well as avoiding surface decarburization during processing or heat treatment.
- Fatigue is fundamentally a surface-initiated process, therefore surface conditions are extremely critical. Furthermore, because fatigue is caused by slip, any structural condition that prevents slip would be beneficial for a long fatigue life.
Determination of Endurance Limit - Rotating Beam Fatigue Testing Apparatus
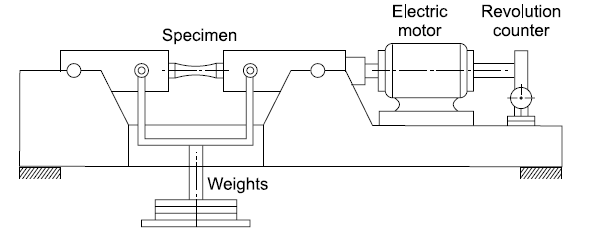
Pure bending is the most popular test loading for fatigue testing since it is simple to utilise. Collets are used to hold a circular specimen. The test specimen and the key elements of the testing machine are shown in the diagram. The test machine is powered by a 1000 rpm high-speed electrical motor. There is a huge bearing next to the motor that relieves the motor from the large bending moment given to the specimen. A spinning lever arm is attached to a collect, which is then connected to a tiny bearing. The bearing is subjected to a force, causing the specimen to bend. The specimen's upper surface will be in tension, while the lower surface will be compressed. The surface of the specimen is subjected to alternate tensile and compressive stresses because it is rotated by a motor. The machine's revolution counter reader records the number of cycles applied, and when the specimen breaks, the counter disengages automatically. The disengaging device is intended to bring the testing equipment to a halt. To determine a metal's fatigue limit, or endurance limit, a number of specimens that are representative of that metal must be prepared. The first metal specimen is subjected to a reasonably high stress, with the goal of failure occurring in a small number of stress applications. Other metal specimens are subjected to stress tests at a lower level than the preceding one. The life of the specimen rose as the stress value decreased. As the load lowers, the number of repetitions necessary to cause rupture, i.e., fracture, increases. The specimen will not burst if the stress is less than the endurance limit. The specimen's life is measured in the number of cycles necessary to reach maximum applied force failure. Fatigue test results are frequently represented on diagrams, with stress values plotted as ordinates and stress cycles for rupture plotted as abscissa. The curve is known as an S-N diagram, with S denoting stress and N denoting the number of cycles.
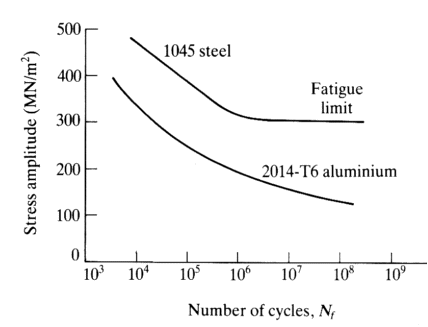
Semi logarithmic plotting, or plotting 'N' on a logarithmic scale, is used to create these diagrams. Engineers pay close attention to the shape of the S-N curve. At a certain tension, the curvature of metals such as mild steel and titanium becomes horizontal. The fatigue limit or endurance limit is the name given to this stress value.
Key Takeaway
Endurance limit is limit below which infinite number of repetitive load cycles of completely reversed bending stress can be applied before causing any fatigue failure
Materials having Distinct cut-off on SN curve have Endurance limits and those are more gradually have Endurance strength
Endurance Limit though being distinct doesn’t have any fixed value for each material and for same material of same component can have different fatigue limit but will lie in proximity to each other on SN curve
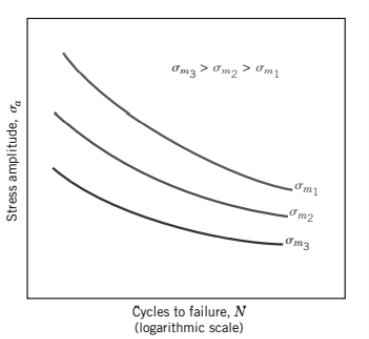
The S–N figure depicts the relationship between fatigue life and stress amplitude. Such data is collected for a constant mean stress σ m, which is frequently for a reversed cycle situation (σ m=0). The influence of mean stress on fatigue life can be illustrated by a succession of S–N curves, each recorded at a different σ m. Increasing the mean stress level leads to a decrease in fatigue life
When a component is subjected to fluctuating stresses, mean stress and stress amplitude exist. The mean stress component is present in conjunction with an alternating component, it has been observed to have an effect on fatigue failure In the Fig. Below. The mean stress is plotted on the abscissa, while the stress amplitude is plotted on the ordinate in this diagram.
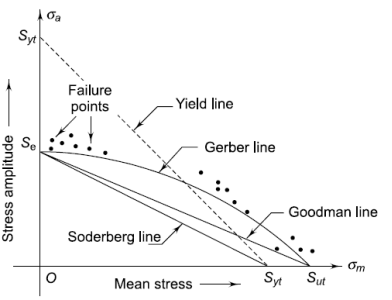
Goodman line
The magnitudes of maximum and minimum force acting on the component determine the magnitudes of mean stress and stress amplitude. The load is purely static when the stress amplitude is zero, and the criteria of failure are Sut or Syt. On the abscissa, these limitations are plotted. When the mean stress is zero, the stress is entirely reversed, and the endurance limit Se shown on the ordinate is the criterion of failure. When all components of stress are applied to the component, failure occurs at several distributed sites as illustrated in the diagram. For certain combinations of mean stress and stress amplitude, there is a border that separates the safe and risky regions. Different criteria for constructing the borderline separating the safe zone and the failure zone have been offered. The Gerber, Soderberg, and Goodman lines are among them
- Gerber Line: A parabolic curve joining Se on the Y axis to Sut on the X axis is called the Gerber line.
- Soderberg Line: A straight line joining Se on the Y axis to Syt on the X axis is called the Soderberg line.
- Goodman Line: A straight line joining Se on the Y axis to Sut on the X axis is called the Goodman line.
When a component is subjected to both, mean and amplitude stress, the Goodman line is commonly employed as criteria for fatigue failure. The following are the reasons for this:
- Because it is totally within the failure points of test data, the Goodman line is immune to design considerations.
- When compared to the equation of a parabolic curve, the equation of a straight line is straightforward and easy to calculate
- A scale diagram is not required, and a rough sketch will suffice to create a fatigue diagram.
Equation for line in intercept form is 
By substituting values of stress from above figure Soderberg equation would be 
The Goodman line would be 
Modified Goodman line
By Combining fatigue failure with yielding failure, Goodman line is modified. The modified Goodman diagram is used to design the components that are subjected to fluctuating stresses.
- Modified Goodman line for Components subjected to fluctuating axial or bending stresses
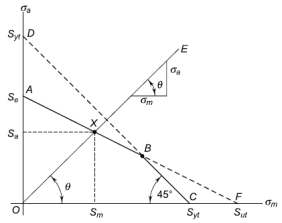
A line OE with a slope of tan is constructed in such a way that,


The magnitude for Pm and Pa are determined by maximum and minimum forces acting on the component
Similarly,  can be proved, where (Mb)a and (Mb)m determined by maximum and minimum bending moment acting on the component
In figure above, X is the location where lines AB and OE intersect.
The dividing line between the safe and failure regions is marked by the letter X. The coordinates of the point X (Sm, Sa) represent the stresses' limiting values, which are utilized to compute the component's dimensions. The following are the allowed stresses:
 and
and

2. Modified Goodman line for Components subjected to fluctuating torsional shear stresses.
On the abscissa, the torsional mean stress is displayed, while the torsional stress amplitude is plotted on the ordinate. On the abscissa, the torsional yield strength Ssy is displayed, and a yield line is drawn at 45 ° to the abscissa. B is the location where this line and the yield line connect. In this scenario, the OABC area symbolizes the safe zone.
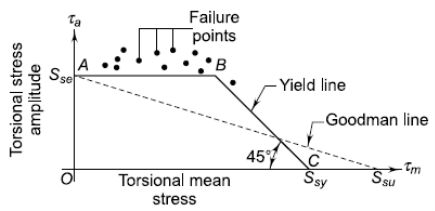
The fatigue failure is indicated if,

The static failure is indicated if

Where,


Key Takeaway
The mean stress effects the fatigue life, safe zones and failure zones are created which are separated by different criteria which are represented as the line on diagrams
- A parabolic curve joining Se on the Y axis to Sut on the on X axis is called as Gerber line.
- A straight line joining Se on the Y axis to Syt on the X axis is called the Soderberg line.
- A straight line joining Se on the Y axis to Sut on the X axis is called the Goodman line.
- The Goodman line is modified by combining fatigue and yielding Failure.
- Modified Goodman line for Components subjected to fluctuating axial or bending stresses is
 and
and 
- Modified Goodman line for Components subjected to fluctuating torsional shear stresses

When a stress is applied, then removed, then reapplied, a fatigue fracture occurs. Before a fatigue fracture is large enough to induce material breakdown, this process can repeat millions of times. Micro cracks on the material's surface are permitted to grow every time the tension is reintroduced. Once the micro fractures have grown large enough and the stress imposed has been applied, one or more of the cracks will spread throughout the thickness of the material, resulting in material or component failure. Many factors influence the occurrence of fatigue fracture. It's crucial to choose the right materials. Aluminum, for example, has a lower fatigue resistance than a material like steel. Sharp corners operate as stress concentrators and nucleation places for first micro cracking, making materials with sharp corners fracture easily than materials with rounded edges. Another factor is that stress is administered in a cyclical manner. The likelihood of a fatigue fracture is lowered if the stress may be reduced in magnitude or number.
There are three main steps in the fatigue failure process:
- Crack initiation, in which a small crack starts at a high-stress location
- Crack propagation, in which the crack moves progressively with each stress cycle
- Final failure, in which the progressing crack fails extremely quickly.
At some point of load concentration, cracks associated with fatigue failure nearly always begin (or nucleate) on the surface of a component. Surface scratches, sharp fillets, keyways, threads, dents are all examples of crack nucleation sites. Furthermore, microscopic surface discontinuities caused by dislocation slip steps can operate as stress raisers and hence as crack initiation sites when subjected to cyclic loading.
Beachmarks and striations are two types of markings that can be found on a fracture surface that occurred during the crack propagation process. Both of these features show as concentric ridges that grow away from the fracture initiation site(s) in a circular or semicircular pattern, indicating the position of the crack tip at some point in time.
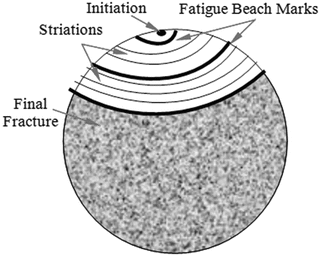
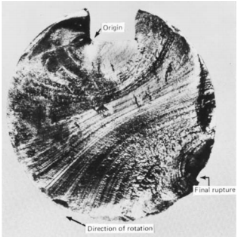
Beachmarks (also known as "clamshell marks") are macroscopic in size and may be seen with the naked eye. These indications can be discovered on components that were disrupted throughout the fracture propagation stage, such as a machine that only ran during standard work-shift hours. Each beach mark band denotes a time period during which crack growth took place. Fatigue striations, on the other hand, are tiny in size and can be observed with an electron microscope (either TEM or SEM). Each striation is assumed to indicate the crack front's advance distance throughout a single load cycle. The width of the striation relies on the stress range and grows with it. It is important to note that, while both beachmarks and striations are fatigue fracture surface characteristics with similar appearances, they are distinct in origin and size. Within a single beachmark, there could be thousands of striations. After looking at the failure surfaces, it's often possible to figure out what caused the failure. Beachmarks and/or striations on a fracture surface indicate that fatigue was the cause of failure. However, the absence of any or both does not rule out fatigue as a factor in failure. Finally, when it comes to fatigue failure surfaces, beachmarks and striations will not form in the area where quick failure occurs. Rather, the quick failure can be ductile or brittle; ductile failure will show signs of plastic deformation, while brittle failure will not.
Key Takeaway
- Fracture with fatigue take place in 3 step, Crack initiation Crack, propagation, Final failure
- Beachmarks and striations are used to identify the fracture caused due to fatigue.
- Beachmarks are macroscopic and can be seen without help of instruments, they denote time period at crack propagation stage for each crack. Single Beachmark can contain Thousands of striations
- Striations are microscopic and requires microscope like TEM or SEM. They denote advancement distance of crack propagation
NDT stands for Non-Destructive Testing. Non-destructive Testing is a part of the Quality Control role and is used in conjunction with other well-established methodologies. Non-destructive testing is defined as the examination of materials for surface or internal defects or metallurgical condition without compromising the material's integrity or suitability for service. The technique can be utilized for individual research on a sampling basis or for 100% material inspection in a production quality control system.
Despite being a high-tech idea, the equipment has evolved to the point where it can be used in any industrial environment and at any level of the manufacturing process, from steel production to site inspection of components already in service. Some of the methods are
In short, it allows to multiple qualitative test and indirect inspection of the object and its properties without permanently altering. It can detect Cracks, Cavities, Dents, Grinding burn, Hard Spots, Soft Spots. Some of techniques are
- Visual inspection
- Die penetration
- Eddy current testing (ET)
- Magnetic particle testing (MT)
- Ultrasonic testing (UT
Visual Inspection (VT)
Surface-related quality features such as shape deviations, defects, or the surface condition of a component are observed and evaluated with the naked eye or through optical gadgets such as magnifying glasses, microscopes, or endoscopes during visual inspection operations. Visual inspection is carried out in a complete test before all other destructive and non-destructive testing procedures, and it is utilized for varied product shapes according to given test instructions.
Dye penetrant testing
This approach is often employed in non-ferromagnetic materials to discover surface breaking faults.
To eliminate all traces of foreign material, grease, grime, and other contaminants from the surface and within the cracks, the subject is first chemically cleaned, usually by vapor phase.
The penetrant is then applied (which is a very fine thin oil that is commonly colored bright red or ultra-violet fluorescent) and left on the surface for about fifteen minutes. During this time, capillary action drags the penetrant into the fracture.
The excess penetrant is then entirely removed from the surface, and a thin layer of powdered chalk is placed. After a second interval (development time), the chalk drags the dye out of the crack, much like blotting paper, to generate a visible, magnified-in-width indicator that stands out against the background. The process is entirely mechanical/chemical, and the various substances employed can be applied in a variety of methods, ranging from aerosol spray cans at one end to automatic dipping in big tanks at the other. Although the latter approach necessitates complicated tanks, spraying, and drying apparatus, the idea is the same.
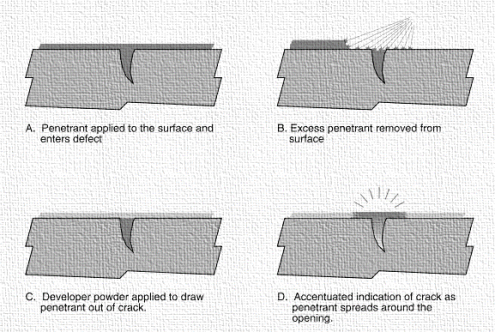
Process
• A high-surface-wetting liquid is placed to the part's surface, allowing Time to seep into surface-breaking defects.
• Excess liquid is wiped away from the part's surface.
• A developer (powder) is used to extract the trapped penetrant from the defect and disperse it across the surface so it can be viewed.
• The Process concludes with a visual inspection. To increase test sensitivity, the penetrant is frequently injected with a fluorescent dye and the inspection is performed under UV light.
Advantages
• High Operational simplicity
• The most effective way of determining breaking surface fractures in non-ferrous metals.
• Appropriate for automated testing, with a caveat about viewing.
Disadvantages
• Only applies to surface-breaking flaws.
• Sensitivity has decreased.
• Consumes a significant number of consumables.
Radiography
Internal flaws in ferrous and non-ferrous metals, as well as other materials, can be detected using this technology. X-ray or Gamma rays are used. The penetrating radiation is absorbed by the material through which it passes and absorption increases with increase in thickness of material
The principal is same for both X-rays and Gamma rays. They have the property of converting silver halide crystal present in photographic film to metal silver proportional to intensity of radiation reaching to form the latent image which can be developed as photographic field
In X-radiography, X-rays are generated electrically and the penetrating power is determined by the number of volts applied to the X-Ray tube. The Intensity, the exposure time measured in milli amperes minutes is governed by the amperage of the cathode in the tube.
In Gamma radiography the isotope like iridium governs the penetrating power and cannot be change for isotope. Intensity of the radiation is set at the time of supply of the isotope. The intensity of radiation from isotopes is measured in Becquerel’s which reduces over a period of time with respect to the half-life. For example, the half-life of Iridium 192 is 74 days the exposure factor is a product of the number of curies and time, usually expressed in curie hours.
The exposure time must be increased as intensity decreases and isotopes must be disposed properly once it’s uneconomical. Also, the isotopes must be kept in proper shielding to avoid contamination of environment and prevent harms to operator.
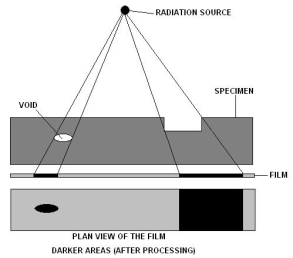
Process
- The film with intensifying screen is placed close to the surface of the subject. Intensifying screen is use decrease the exposure time of test
- The radiation source is placed at other end and subject is placed between source and film, son the radiation passes through subject to film
- Once the exposure time is over, film is dried developed and viewed. Accessories like radiation monitor, image quality checker and dark room equipment along with consumables like film developer chemicals are needed to develop film
Advantages of Radiography
• Pictorial information which can be stored and view later and distant from the test.
• Can be used on any material with thin section
• Sensitivity declared on each film.
Disadvantages of Radiography
• Health Hazard and storage problem
• Can’t deal properly with thick section and beam must be directed accurately for two-dimensional defects.
•Other accessories, Film processing and viewing facilities, consumables are necessary
• Can’t detect surface defect and do not provide depth information of defect, only planer information is provided
Magnetic particle testing
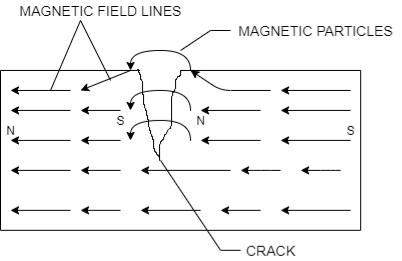
This is non-Destructive Testing used to detect the crack. The basic principle is that if the crack is present on magnetized ferrous component surface the north and south poles are formed on crack. The magnetic field lines exit the North Pole and enters South Pole, but if crack is present the magnetic field lines are spread out as air cannot permit as high magnetic fields lines per volume as magnet can. This spread out is called flux leakage.
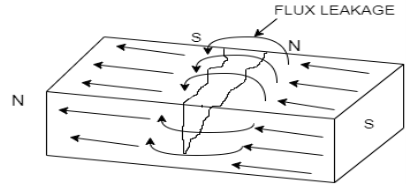
When the iron particle or other ferrous particles are sprinkled the particles not only are attracted to poles of magnet, but also around the crack, these particles are more visible than actual cracks and hence the cracks are located
Process
- Surface preparation- removes dust, rust, paint to ensure adequate contact area
- Pre-Demagnetization to remove the residual magnetism to avoid false detection
- Magnetize the component using either direct or indirect magnetization techniques
- Apply magnetic particle which have high permeability to increase sensitivity to small leakage and low retentively to avoid attracting to each other.
- On basis of carrying agent the application of magnetic particle can be wet or dry, wet method can detect small cracks due to increased mobility of particle in suspension around component tested and particle size is also 10um. As the particle surrounds the component dust accumulation is eliminated. Dry method uses two size a smooth 50um and coarse 150um. Dry method is useful for detection of crack on smooth surface and shallow surface cracks
- Viewing the cracks by using either red paste with daylight or florescent paste with black light. Marking the crack identification after draining all magnetic particle ink.
Demagnetized the component either by heating above Curie temperature or applying reverse and decreasing magnetic field
Advantages
• Ease of use.
• Quantitative data collection.
• Apart from viewing, it is possible to automate.
Disadvantages
• Only works with ferromagnetic materials.
• Surface or near-surface faults are the only flaws that are addressed.
Ultrasonic Testing
Internal and surface (especially remote surface) flaws in sound conducting materials are detected using this technique. The concept is comparable to that of echo sounding in several ways. An electric charge is supplied to a piezoelectric crystal, which vibrates for a very short time at a frequency proportional to the crystal thickness, resulting in a transient pulse of ultrasonic. This frequency ranges from one million to six million times per second in fault detection (1 MHz to 6 MHz) In a homogenous elastic material, such as many metals, vibrations or sound waves at this frequency can travel a long distance with negligible attenuation. The propagation velocity of these waves is proportional to the material's Young's Modulus and is unique to that material. Steel has a velocity of 5900 meters per second, while water has a velocity of 1400 meters per second. Because ultrasonic energy is greatly reduced (attenuated) in air, a beam transmitted through a solid will reflect a significant amount of energy in the direction equal to the angle of incidence when it reaches an interface (e.g., a flaw, intentional hole, or the back wall) between that material and air.
The oscillating crystal is integrated into a hand-held probe that is applied to the surface of the material to be evaluated for contact testing. A layer of liquid (referred to as "couplant"), commonly oil, water, or grease, is placed to the surface of the crystal to aid the transmission of energy through the small air gap between the crystal and the test piece.
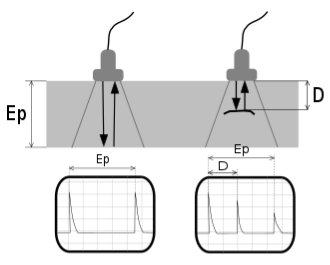
Crystal generates the ultrasonic wave which is passed through the object and if there is crack some waves are reflected back, by knowing the travel time, distance from defect can be calculated Ultrasonic testing is used in a wide range of industries as this can be used to inspect many materials UT is ideally used for inspection of dense, crystalline structures such as metals. Ceramics, plastics, composites and concrete can also be successfully inspected
The height of the peak (echo) is roughly proportional to the area of the reflector. A portion of the beam is reflected not only at the material/air interface, but also at any point where the velocity changes, such as the steel/slag interface in a weld. See in figure on right side D is distance from defect and peak at D is Crack Echo, also on left side the transmitted Echo is almost equal to received echo, but at right side reflected echo is less because some waves are reflected early at crack echo
On arrangement basis UT can be classified as the Pulse Echo and Transmission through. IN pulse Echo mode the receiver and transmitter are at same side of object whereas in Transmission through they are on opposite side of object, object being in middle, Pulse Echo is used when only one side of object is available or inspection
Advantages
Can detect both surface and sub-surface defects
High penetration depth than other NDT
Only one side of object as to be free to inspect in pulse echo UT
High accuracy in determining Distance and Shape
Less preparation and instant results
It is nonhazardous to operators or nearby personnel and has no effect on material
In addition to fault detection, it can be used for thickness measurement.
Its equipment might be extremely mobile or extremely automated. Automated systems can generate detailed images.
Disadvantages
To transmit ultrasound, the surface must be accessible.
The level of skill and training is higher than with some other approaches.
To facilitate the transfer of sound energy into the test specimen, a coupling medium is usually required.
It's tough to evaluate materials that are rough, uneven in shape, very small, extremely thin, or not homogeneous.
Due to limited sound transmission and excessive signal noise, inspecting cast iron and other coarse-grained materials is difficult.
It's possible that linear faults parallel to the sound beam will go undetected.
For both equipment calibration and fault characterization, reference standards are required.
Key Takeaway:
- Non-destructive Testing is a part of the Quality Control It is used to detect Flaws on object itself and not Prototype without Damaging It.
- Various Technique are used for different Flaws and material type, Mostly Magnetic Testing is used with Ferrous material and Surface Defects, If Defects are sub -surface Ultrasonic Testing is used and if defects are internal Radiography is used.
- For Non-Ferrous material Dye Penetrate Testing or Eddy Current Testing is used for Surface defects and if defects are internal Radiography or Ultrasonic Testing is used
References:
- Design of machine element VB Bhandari
- Materials Science and Engineering V. Raghavan
- A Brief Description of NDT Techniques A Paper by Mark Willcox & George Downes
- Materials Science and Engineering: An Introduction, Eighth Edition William D. Callister, David G. Rethwisch