Unit – 4
Properties of steam and Rankine cycle
A pure substance is one that has a consistent chemical composition throughout. Examples include water, helium, carbon dioxide, and nitrogen. It does not have to be a single chemical element if it is uniform throughout, such as air. A mixture of phases of two or more substances, such as ice and water (solid and liquid) or water and steam, can still be a pure substance if it is homogeneous (liquid and gas).
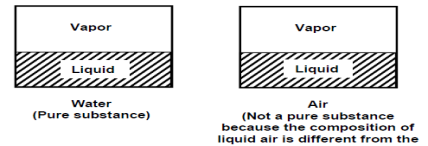
Phases & Properties of a pure substance
There are three basic phases: solid, liquid, and gas, but a substance can have multiple phases within the basic phase. Solid carbon (diamond and graphite) and iron (three solid phases) are two examples. Nonetheless, thermodynamics only deals with the primary phases.
• Solids have the strongest molecular bonds
• Solids are densely packed three-dimensional crystals.
• Their molecules do not move relative to one another.
• The molecular spacing of liquids is comparable to that of solids, but their molecules can float in groups.
• Within the groups, there is molecular order.
• Molecular bond strength is the weakest.
• Molecules in the gas phases are dispersed and lack an ordered structure.
• The molecules move erratically and collide with one another.
• Because their molecules have a higher energy level, they must release a lot of energy to condense or freeze.
Phase – Change Processes of Pure Substances
It is critical to consider the liquid to solid phase change process at this point. Not so much solid to liquid because thermodynamics only deals with liquid to gas (or vice versa) conversion to generate energy.
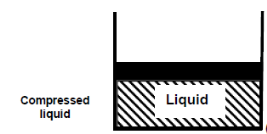
Consider water in a piston-cylinder device at room temperature (20°C) and normal atmospheric pressure (1 atm). Water is in the liquid phase, and it is referred to as compressed liquid or sub cooled liquid (not about to vaporize).
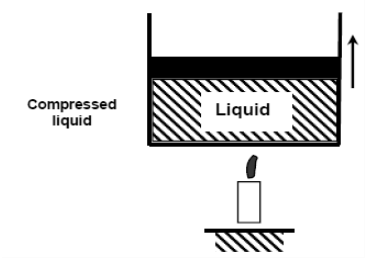
When we add heat to water, its temperature rises until it reaches 50°C. The specific volume v will increase as the temperature rises. As a result, the piston will move slightly upward, maintaining constant pressure (1 atm).
If we continue to add heat to the water, the temperature will rise until it reaches 100°C. Any additional heat will vaporise some water at this point. The point at which water begins to vaporise is referred to as saturated liquid.
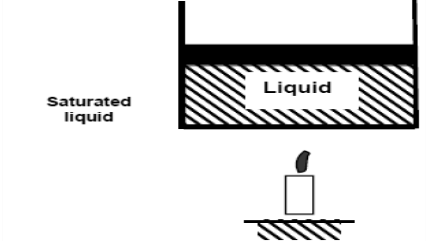
As we continue to heat water, more vapour is produced while the temperature and pressure remain constant (T = 100°C and P = 1 atm). The only property that varies is the volume. These conditions will not change until the last drop of liquid has been vaporised. At this point, the cylinder is filled with vapour at 100°C. This is referred to as saturated vapour.
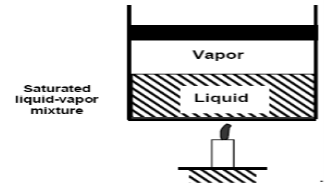
The state where two phases exist between saturated liquid (only liquid) and saturated vapour (only vapour) is known as a saturated liquid-vapor mixture.
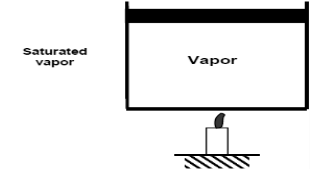
Saturated vapour phase on further addition of heat becomes superheated vapor.
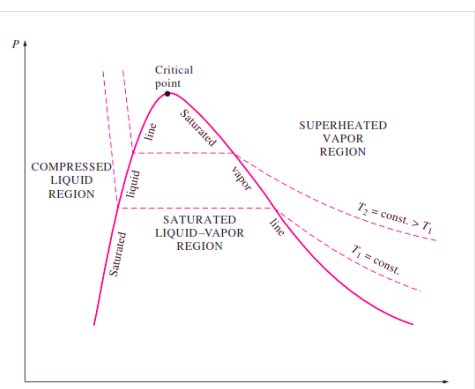
Figure: P-V Diagram of Pure Substance
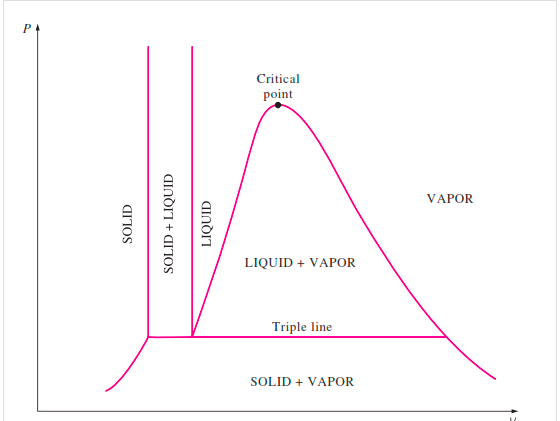
Figure: P-V Diagram of substance that Contracts on Freezing
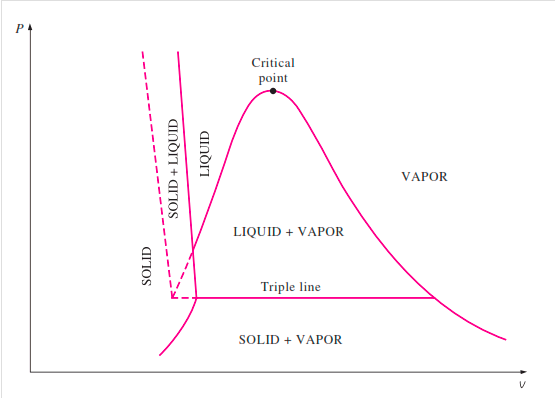
Figure: P-V Diagram of substance that expands on freezing (Water)
This concept is applicable to pure substances other than water. A pure substance is one that has a consistent chemical composition throughout. Examples include water, helium, carbon dioxide, and nitrogen. It does not have to be a single chemical element if it is uniform throughout, such as air. (Liquid and gas). A mixture of phases of two or more substances, such as ice and water (solid and liquid) or water and steam, can still be a pure substance if it is homogeneous.
When the pressure in the piston-cylinder device is increased, the process from compressed liquid to superheated vapour follows a path like the process for P = 1 atm, with the only difference being that the width of the mixture region is reduced.
The mixture region will then be represented by only one point at a given pressure. This is referred to as the critical point. It is defined as the point where the saturated liquid and saturated vapour states are the same.
The properties of a substance at the critical point are referred to as critical properties (critical temperature (Tcr), critical pressure (Pcr), and critical specific volume (Vcr)).
If we connect all the points representing saturated liquid, we will obtain the saturated liquid line.
If we connect all the points representing saturated vapor we will obtain the saturated vapor line.
The intersection of the two lines is the critical point.
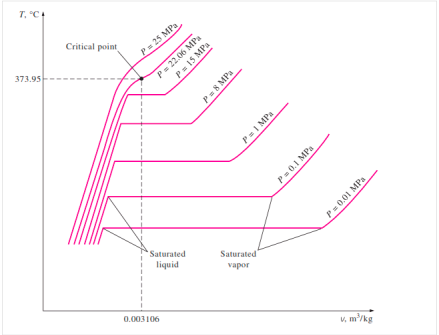
Figure: T-V Diagram of constant pressure phase change process of a pure Substance
Key Takeaway:
- Water is in the liquid phase, and it is referred to as compressed liquid or sub cooled liquid (not about to vaporize).
- The point at which water begins to vaporise is referred to as saturated liquid.
- Saturated vapour
- The state where two phases exist between saturated liquid (only liquid) and saturated vapour (only vapour) is known as a saturated liquid-vapor mixture.
- Saturated vapour phase on further addition of heat becomes superheated vapor.
- The properties of a substance at the critical point are referred to as critical properties (critical temperature (Tcr), critical pressure (Pcr), and critical specific volume (Vcr)).
In thermodynamics, a substance's triple point is the temperature and pressure at which its three phases (gas, liquid, and solid) coexist in thermodynamic equilibrium. It is the temperature and pressure at which the sublimation, fusion, and vaporisation curves intersect.
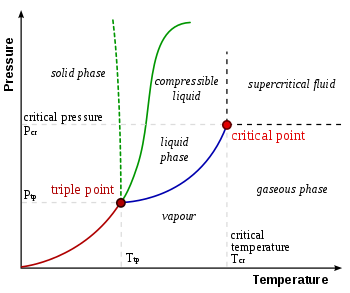
Figure: Phase Diagram (P-T) & Triple Point
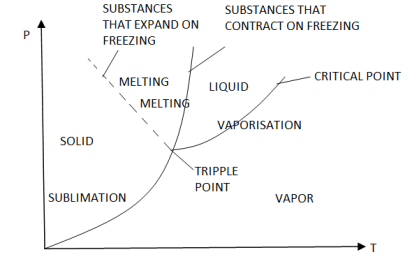
Figure: Phase Diagram (P-T) & Triple Point
The P-T diagram is often called the phase diagram since all three phases are separated by three lines.
- Solid - vapor sublimation
- Solid - liquid melting
- Liquid - vapor vaporization
In physics, a critical point is a set of conditions under which a liquid and its vapour become identical. The critical temperature, critical pressure, and critical density are the conditions that define the critical point for each substance.
Example: The critical conditions can be met by filling a closed vessel with a pure substance that is partly liquid and partly vapour, so that the average density equals the critical density. The vapour pressure rises as the temperature rises, and the gas phase becomes denser. The liquid expands and becomes less dense until, at the critical point, the densities of the liquid and vapour become equal, eradicating the phase boundary. If the starting average density is too low, all of the liquid will evaporate before the critical temperature is reached. If the initial average density of the liquid is too high, it will expand to fill the container.
The term saturation in thermodynamics refers to a condition in which a mixture of vapour and liquid can coexist at a given temperature and pressure. The saturation temperature or boiling point is the temperature at which vaporisation (boiling) begins for a given pressure. The saturation pressure is the pressure at which vaporisation (boiling) begins for a given temperature.
When the vapour quality is equal to zero, the state is known as the saturated liquid state (single-phase). When the vapour quality is equal to one, the state is known as the saturated vapour state or dry steam (single-phase). We call the transition between these two states a vapor-liquid mixture or wet steam (two-phase mixture). At constant pressure, adding energy does not change the temperature of the mixture, but it does change the vapour quality and specific volume.
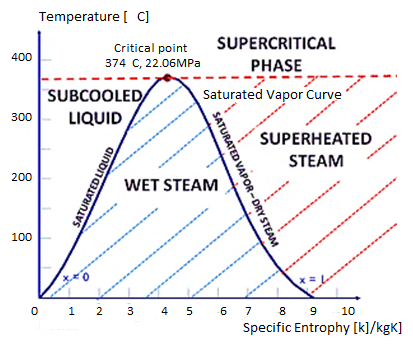
Figure: T-S Diagram
If the temperature of the liquid is less than the saturation temperature for the current pressure, it is referred to as a subcooled liquid or a compressed liquid.
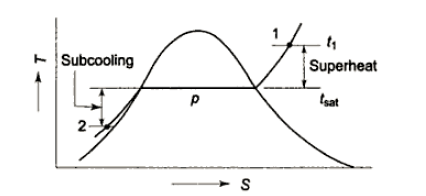
A saturated liquid state exists when water exists as a liquid at saturation temperature and pressure with quality x = 0. (single-phase). If the temperature of the liquid is lower than the saturation temperature for the existing pressure, it is referred to as a compressed liquid or a subcooled liquid. Subcooling refers to a liquid that exists at a temperature lower than its normal boiling point.
Example: Water, for example, normally boils at 100°C (at atmospheric pressure); at 20°C, the water is referred to as “subcooled.”
At saturation temperature, steam exists entirely as vapour and is referred to as saturated vapour, saturated steam, or dry steam. The dry saturated vapour is distinguished by a vapour quality equal to unity. Superheated vapour, also known as superheated steam, is a vapour that is hotter than its boiling point at the absolute pressure at which the temperature is measured. Because the temperature can rise while the pressure remains constant, the pressure and temperature of superheated vapour are independent properties. In reality, what we call gases are highly superheated vapours.
The transformation of ice to water and water to steam is referred to as phase transformation. It takes place at a constant temperature and a constant pressure.
- Sub-cooled ice:
Sub-cooled ice is ice that has a temperature lower than its freezing point of 0°C. As a result, ice at -6°C, -13°C, and -29°C will be sub-cooled ice. As a result, ice at -6°C will have 6 degrees of sub-cooling.
- Super-heated steam:
Superheated steam is steam that has a temperature higher than its boiling point at a given pressure. Superheated steam has a temperature of 112 degrees Celsius and a pressure of one atmosphere.
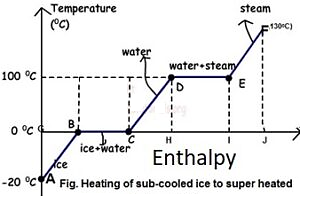
Figure: Phase Transformation of water
From A to F, subcooled ice is heated to superheated steam.
- Process A-B
Sensible heating of sub-cooled ice from -20 to 0 degrees Celsius. Ice is -20 degrees Celsius at point A and 0 degrees Celsius at point B, but there is no phase change.
- Sub cooled liquid
A sub-cooled solid is any substance that is at a temperature lower than its freezing point. Sensible heat gained during the AB process.
- Process B-C
At 0 degrees Celsius, ice melts. It only involves latent heat.
- Dry solid
A saturated solid is a solid that is at its freezing temperature and pressure. Ice at 0°C is a dry solid at point B.
- Wet solid
A Wet Solid is any solid that is frozen and liquid at the same time. As a result, the transition from point B to point C is a phase change process. Remember that a phase change process always occurs at constant temperature and pressure. As a result, it is both an isothermal and an isobaric process. Process C-D
Water can be heated safely from 0°C to 100°C.
- Sub cooled liquid
A sub-cooled liquid is any liquid that has a temperature lower than its boiling point at a given pressure.
Example: water at 13C or below 100C at 1atm pressure will be sub-cooled water. Water at 112C at 2atm will also be sub-cooled water because boiling point at 2 atm is.
- Saturated liquid
Any liquid that has reached its boiling point at a given pressure is said to be saturated. Water, for example, has a boiling point of 120 degrees Celsius at 2 atmospheres of pressure. As a result, water at 120 degrees Celsius and 2 atmospheres of pressure is saturated water.
- Process D-E
Water begins to change into steam vapour at 100C after further heating at point D, and vapour formation is complete at point E at 100C. Temperature and pressure remain constant during phase change. As a result, phase change is both isothermal and isobaric
- Dry Saturated Vapour
Dry saturated vapour is any vapour that has reached its boiling point at a given pressure but contains no liquid. As a result, water vapour at point E at 100 degrees Celsius will be a dry saturated vapour. There should be no liquid present alongside the vapour.
- Process E-F
Further heating at constant pressure raises the temperature of the steam to, say, 130 degrees Celsius. Superheated steam is 130 degrees Celsius at 1 atmosphere pressure.
- Super-heated vapour
Superheated vapour is vapour that has a temperature higher than its boiling temperature at a certain pressure.
- Degree of superheat
The difference between a vapor's actual temperature and its boiling temperature at a given pressure. Thus, at 1 atm pressure, the degree of super heat is 30 when vapour is at 130C, and at 2 atm pressure, when vapour is at 139C, the degree of super heat is 19 (139-120=19).
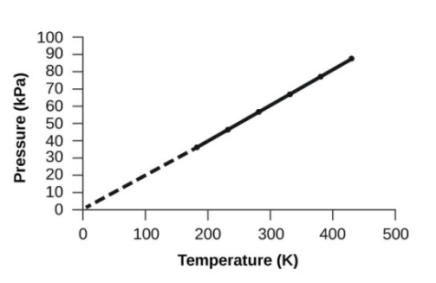
- Pressure & Temperature (Amontons Law or Gay-Lussac’s law)

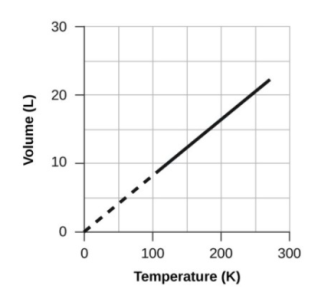
- Volume and Temperature: Charles’s Law

- Volume and Pressure: Boyle’s Law
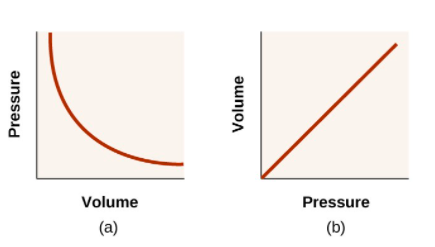

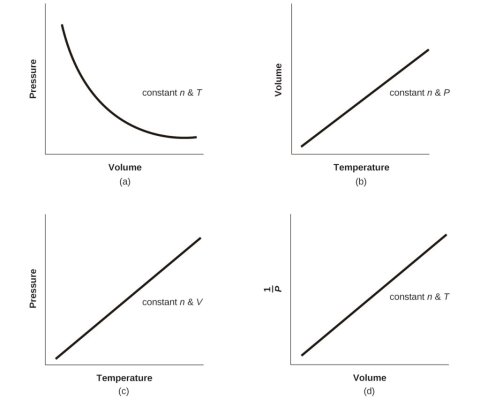
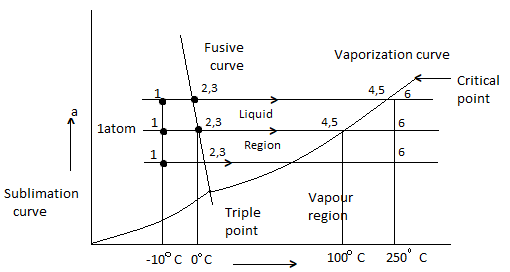
Figure: Phase Equilibrium diagram on P-T coordinates
Heating of ice at 0 C to steam at 250 C at constant pressure of 1 atm is considered.
- 1-2 Solid (Ice) = Heating
- 2-3 melting of ice at 0 C
- 3-4 is liquid heating
- 4-5 is vaporization of water at 100 C
- 5-6 is vapour state
- Process will be reversed from 6 -1 upon cooling
- Fusion curve passes through point 2,3
- Vaporization curve passes through 4,5 (indicating Vaporization or condensation at diff temperature and pressure)
- Sublimation curve is obtained if vapour pressure of solid is measured at diff temp.
- Fusion, Sublimation, Vaporization curve meet at triple point.
- Slope of Sublimation, Vaporization for all substance is + ve
- Slope of Fusion curve for most is + Ve, but for Water is – Ve.
- Liquid boiling temp is very sensitive to pressure, which is indicated by Vaporization curve, which gives saturation temperature at diff Pressure.
- Temp at which a solid melt is not much sensitive to Pressure as indicated by slope of fusion curve.
If we consider the pressure-cylinder device, but with some weights above the piston, removing the weights one at a time to decrease the pressure and allowing heat transfer to obtain an isothermal process, we will obtain one of the P-v diagram curves.
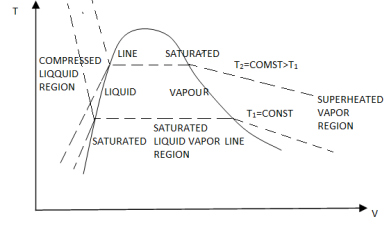
Figure: P-V Diagram
The solid phase, solid liquid, and solid-vapor saturation regions can be added to the P-v diagram. Because some substances, such as water, expand when they freeze, while the rest (the majority) contract during the freezing process, the P-v diagram with solid phase has two configurations.
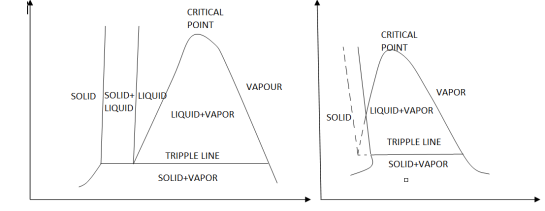
Figure: P-v diagram for a substance that contracts during freezing (left) and for a substance that expends during freezing (right).
P-V-T Surface
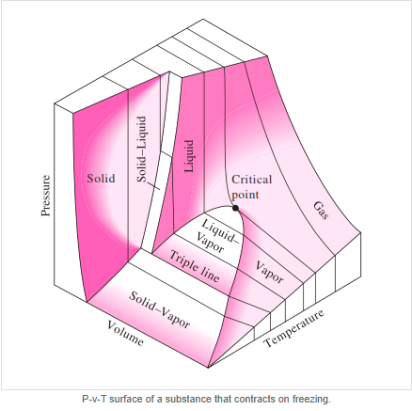
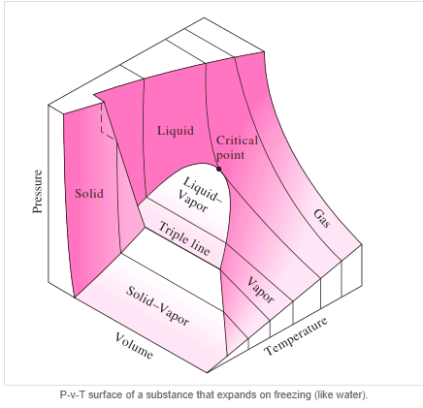
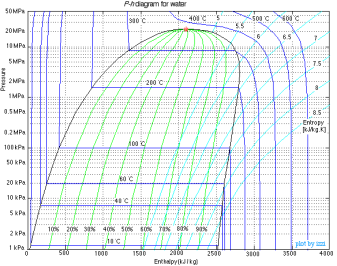
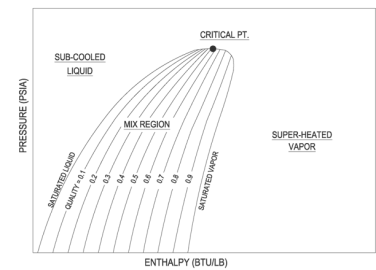
Figure: P-h Diagram of Water
A p-h diagram is a graph that has a vertical axis for absolute pressure and a horizontal axis for specific enthalpy. It is an important diagram that is frequently used for calculating the performance of a refrigerating machine.
For each refrigerant specified, a p-h diagram is created. Of course, it cannot be used for another refrigerant. Diagrams are created for both the conventional unit and the SI unit.
A p-h diagram contains many thin lines, the names, and natures of which are important.
Key Takeaway
A p-h diagram is a graph that has a vertical axis for absolute pressure and a horizontal axis for specific enthalpy. It is an important diagram that is frequently used for calculating the performance of a refrigerating machine.
T-S Diagram
T-S Diagram is general used to analyse energy transfer systems as work done on or by the system including head addiction and removal can be visualized on T-S diagram.
It exhibits the same features as P-U diagram. Water & steam exists together in Liquid-Vapour region.
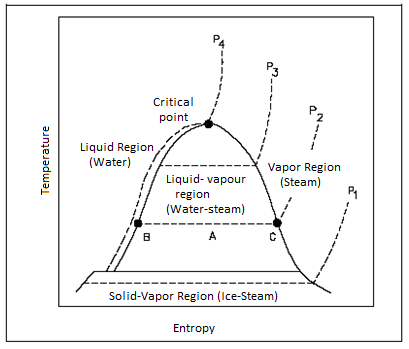
Figure: T-S for Water


 specific entropy of the mixture (Btu/lbm-°R)
 quality of the mixture (no units)
 specific entropy of the saturated vapour (Btu/lbm-°R)
 specific entropy of the saturated liquid (Btu/lbm-°R)
 specific entropy change of the vaporization (Btu/lbm-°R) or

H-S Diagram or Mollier Diagram
From 1st & 2nd law combined we get

This equation serves as the foundation for the h-S diagram. Absolute temperature is given by the slope of an isobar on h-s. If the temperature is constant, the slope will also be constant.
As the pressure rises, so does the saturation temperature, and the slope of the isobar rises with it. As a result, constant pressure lines diverge. At the critical point, the critical isobar is tangent.
The states of equal slopes at constant pressures are joined in the vapour region by lines known as constant temperature lines.
Hf = specific enthalpy of saturated water
Hg = specific enthalpy of saturated vapour
Hfg = latent heat of vaporization at that pressure
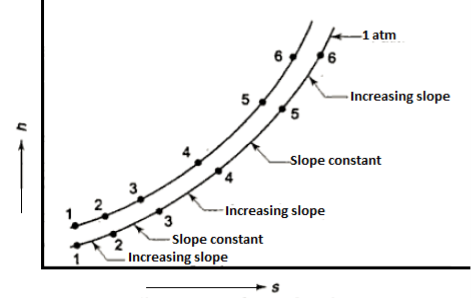
Figure: Isobars on h-s plot
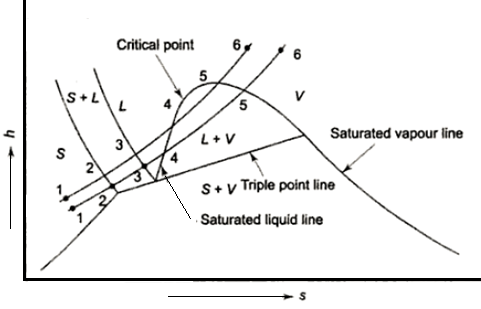
Figure: Phase equilibrium diagram
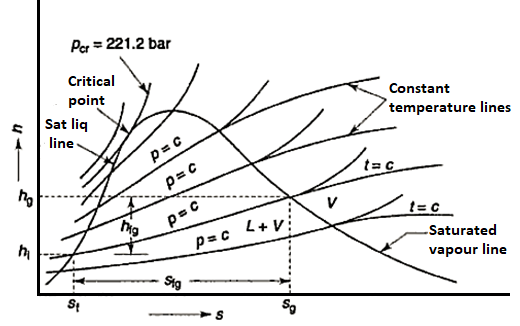
Figure: Enthalpy entropy diagram
Key Takeaway
T-S Diagram is general used to analyse energy transfer systems as work done on or by the system including head addiction and removal can be visualized on T-S diagram.
Property diagrams are most used to depict the phases of a substance and the relationships between its properties. A large number of different properties have been defined, and some of them are dependent on one another.
A substance's five basic properties are typically depicted on property diagrams.
There are five of them: pressure (P), temperature (T), specific volume (n), specific enthalpy (h), and specific entropy (h) (s). When a mixture of two phases is involved, such as water and steam, a sixth property, quality (x), is also used.
There are six different types of property diagrams that are commonly encountered.
Pressure-Temperature (P-T) diagrams, Pressure-Specific Volume (P-n) diagrams, Pressure-Enthalpy (P-h) diagrams, Enthalpy Temperature (h-T) diagrams, Temperature-entropy (T-s) diagrams, and Enthalpy-Entropy (h-s) or Mollier diagrams.
Steam Tables
Water properties are organised in steam tables as functions of pressure and temperature. Separate tables are provided to show the properties of water in its various saturation states, as well as in its liquid and vapour phases. At the triple point (t = 0.01°C), the internal energy of saturated water is arbitrarily set to zero. Due to the small value of the (pv) term in h = u + pv, the enthalpy of saturated water at 0.0 I °C is slightly positive. At the triple point, the entropy of saturated water is also chosen to be zero.
- Saturation States
When a liquid and its vapour are in equilibrium at a specific pressure and temperature, only the pressure or temperature is required to determine the saturation state. If the pressure is given, the temperature of the mixture, known as the saturation temperature, is fixed; if the temperature is given, the saturation pressure is fixed. The saturated liquid or saturated vapour has only one independent variable, which means that only one property must be known in order to fix the state.
At a given temperature P, Vf, Vg, Hf, Hfg, Hg, Sf, Sg are given.
f = saturated liquid
g = saturated vapour state
Fg = change in property during evaporation or condensation
- Liquid vapour mixtures
Consider an equilibrium mixture of saturated liquid water and water vapour at pressure p and temperature t. The mixture's mass composition will be given by its quality x, and its state will be within the vapour dome.


 and
and are the saturation properties at the given pressure and temperature
If p or t and the mixture's quality are given, the properties of the mixture (v, u, h, ands) can be calculated using the above equations. Instead of quality, one of the above properties, such as specific volume v and pressure or temperature, is sometimes given. In that case, the quality of the mixture x must be calculated from the given v and p or t, and then other properties are evaluated once x is known.
- Superheated Vapour
When the temperature of a vapour exceeds the saturation temperature for the given pressure, the vapour is said to be superheated. The superheat or degree of superheat is the difference in temperature between the superheated vapour and the saturation temperature at that pressure. At a given pressure, the temperature in a superheated vapour can have a range of values greater than the saturation temperature.
The values of superheated vapour properties (volume, enthalpy, and entropy) for each tabulated pair of pressure and temperature values, both of which are now independent for pressure and temperature pairs that are not given, interpolation or extrapolation should be used.
- Compressed liquid
When the temperature of a liquid is less than the saturation temperature at the given pressure, the liquid is said to be compressed. P and T can vary independently.
The properties of a superheated vapour table can be arranged to provide the properties at any P and T.
The liquid's properties vary very little with P. Subcooling occurs when a liquid is cooled below its saturation temperature at a given pressure. The difference between saturation and actual liquid temperature is referred to as the degree of subcooling.
Moller chart
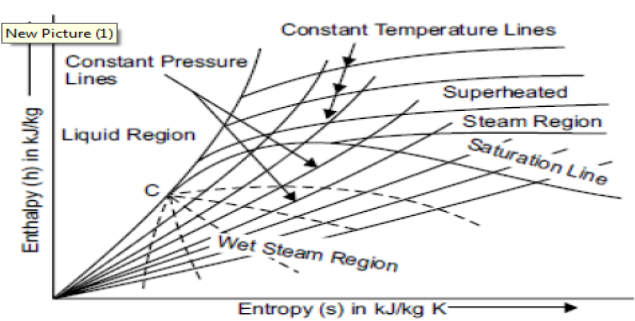
Mollier charts are graphical representations of steam tables, with enthalpy (h) plotted along the ordinate and entropy (s) plotted along the abscissa. To begin, the steam tables are used to calculate the enthalpy and entropy of water and dry saturated steam at any given pressure. These enthalpy and entropy values are plotted, and the liquid and dry saturated lines are obtained. Both of these lines intersect at C, the critical point depicted in the figure. At 221.2 bar, the critical point corresponds to the enthalpy of liquid and dry saturated steam.
The enthalpy-entropy chart, like the temperature entropy chart, is very useful in solving problems involving adiabatic or isentropic steam expansion and compression. In the actual diagram, the abscissa represents the entropy of 1 kg of water and steam, i.e., specific entropy above the freezing point of water, and the vertical ordinate represents the values of specific enthalpy, i.e., total heat.
A line called the saturation line divides the diagram into two parts. The upper region of the saturation line is known as the superheated region, where the temperature of steam rises at a given pressure, while the lower region of the saturation line is known as the wet region, where the temperature of steam remains constant at a given pressure.
The Mollier diagram has the following lines
1. Dryness fraction lines
2. Constant volume (i.e., specific volume) line
3. Constant pressure lines
4. Isothermal lines
5. Isentropic lines and
6. Throttling line
Key Takeaway:


 and
and are the saturation properties at the given pressure and temperature
Constant Volume Line
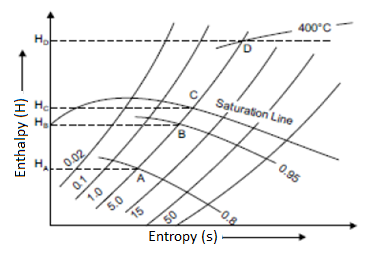
In both the wet and superheated steam regions, constant volume lines are drawn. As shown in the figure, these lines are straight in the wet steam region but curved upwards above the saturation curve, i.e., superheated region. By the AB and CD parts of the line of constant volume.
Constant Pressure Line
In both the upper and lower regions of the saturated steam line, constant pressure lines are drawn. These lines are straight in the wet region because the increase in enthalpy during vaporisation is directly proportional to the increase in quality, and thus to the increase in entropy. The figure depicts a curve that is closer to the wet region than the superheated region.
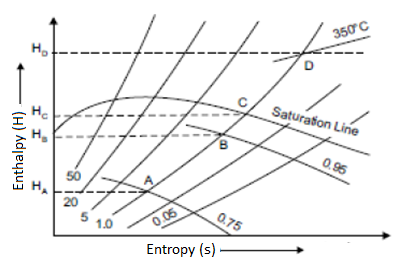
Isothermal Line
Only above the saturation line are isothermal lines or constant pressure lines drawn. These lines depict the state of superheated steam at various enthalpy and entropy values.
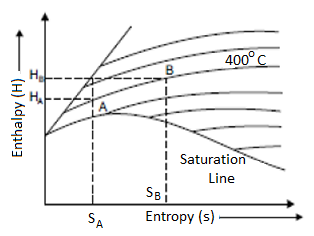
Isentropic Line on (H-S) Diagram
The isentropic process is a reversible adiabatic process. Entropy remains constant in this process. As a result, the isentropic line is parallel to the vertical axis by the line AB.
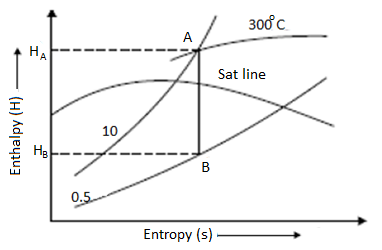
Throttling Lines on H-S Diagram
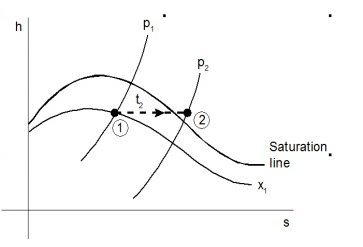
Enthalpy before throttling equals enthalpy after throttling in the throttling process, indicating that there is no change in enthalpy. As a result, enthalpy line AB will be parallel to the horizontal axis.
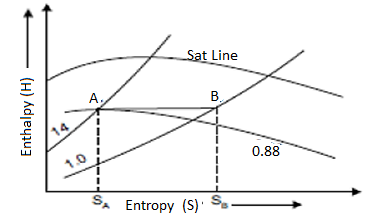
The dryness fraction of wet steam, which represents the fraction of steam in the water-steam mixture, can be measured using a throttling calorimeter and a Separating and throttling calorimeter.
Throttling calorimeter:
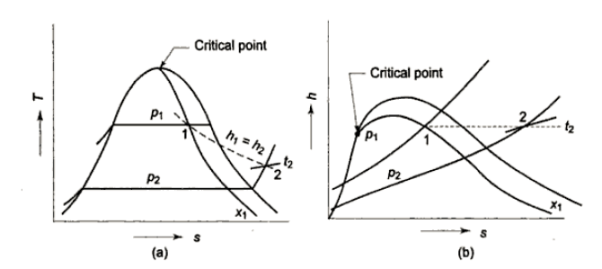
Consider wet steam, which is represented by state 1 in the h-s diagram. It enters the superheated region after undergoing a throttling process to state 2. The specific enthalpy can be calculated by measuring the temperature and pressure after throttling. As previously stated, enthalpy remains constant during throttling. Because the pressure before throttling and the corresponding specific enthalpy are known, the initial state can be completely fixed.
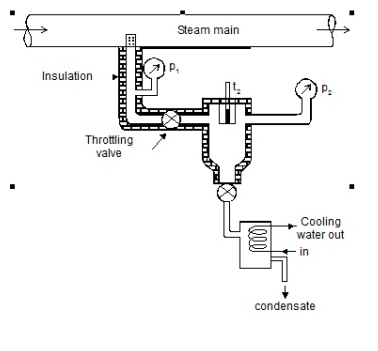
As shown in the figure, steam is extracted from the main via a perforated tube projecting into it. The pressure of steam is measured. It is then throttled into a chamber where pressure and temperature readings are taken. The expanded steam is then discharged from the chamber after being condensed by circulating cooling water.


Separating and throttling calorimeter:
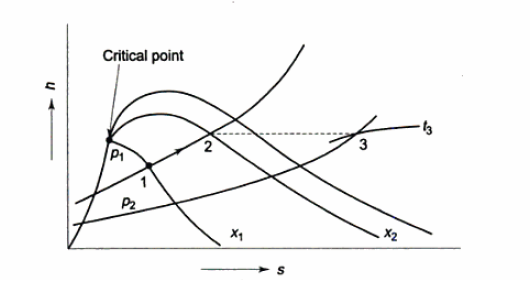
When the dryness fraction of the steam is very low, throttling produces superheated vapour only at very low-end pressure. In general, the pressure after throttling for measuring dryness fractions should be higher than atmospheric. In such cases, separating and throttling calorimeters are used to measure the dryness fraction.
When wet steam undergoes a sudden change in flow direction, a portion of the liquid falls due to gravity and separates from the mainstream. As a result, the remaining steam becomes rich in vapour and, when throttled, becomes superheated vapour even at pressures higher than atmospheric pressure. This principle is used in calorimeters for separating and throttling.
Wet steam from the steam main is extracted via a perforated tube and directed to the separator, where a portion of the liquid is separated due to a sudden change in direction. The remaining steam is directed into a chamber where pressure and temperature readings are taken. The mass flow rate of liquid separated in the separator is measured. The mass of the remaining steam is also measured by condensing and collecting the throttled steam. Let be the mass of liquid separated in the separator and mass of throttled steam.


 is the steam flow rate in kg/s(

With  Q and
Q and  being known,
  can be computed. Now

Hence  can be evaluated.
Key Takeaway:


- Work:
If a force with a constant magnitude of F is necessary to move a weight a distance s, the work is given by the product: W=F×s inside a piston cylinder setup filled with gas.


- The Isobaric Process
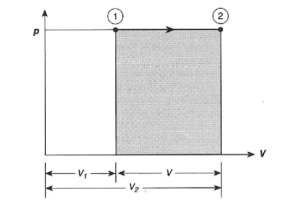

- The Isothermal Process
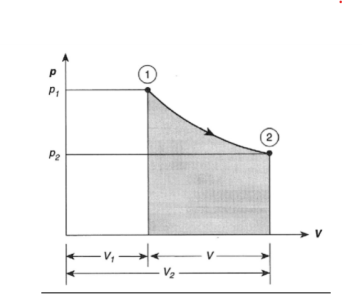

- The Adiabatic Process


- The Isochoric Process
An isochoric process has a constant volume, and no work is done. On a P-V diagram, the area under the curve of an isochoric process is zero.
- Polytropic processes
PV^k=constant
The Rankine cycle is the basic operating cycle of all power plants, in which an operating fluid is continuously evaporated and condensed. The operating fluid chosen is primarily determined by the temperature range available.
- Isobaric heat transfer
The feed pump sends high-pressure liquid into the boiler, which heats it to saturation temperature. The addition of more energy causes the liquid to evaporate until it is completely converted to saturated steam.
- Isentropic expansion
The vapour expands in the turbine, creating work that can be converted to electricity. In practise, the expansion is limited by the cooling medium's temperature and the erosion of the turbine blades caused by liquid entrainment in the vapour stream as the process progresses into the two-phase region. The quality of the exit vapour should be greater than 90%.
- Isobaric heat rejection
The vapor-liquid mixture that exits the turbine is condensed at low pressure, typically in a surface condenser that uses cooling water. The pressure of the vapour in well-designed and maintained condensers is well below atmospheric pressure, approaching the saturation pressure of the operating fluid at the cooling water temperature.
- Isentropic compression
The feed pump raises the pressure of the condensate. Because liquids have a low specific volume, the pump work is relatively small and is frequently overlooked in thermodynamic calculations.
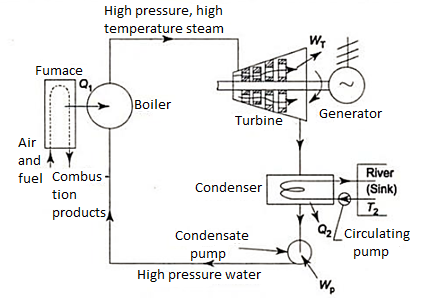
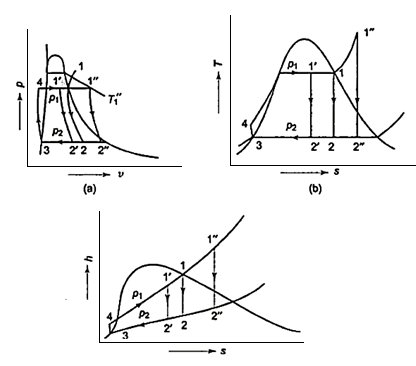
- h4+ Q1 = h1
Q1=h1-h4
- h1= WT+h2
WT = h1 -h2
- h2= Q2 + h3
Q2 =h2-h3
- h3 + Wp = h4
Wp = h4 -h3


Heat rate 
The term "psychometry" refers to the branch of engineering concerned with determining the physical and thermodynamic properties of gas-vapor mixtures.
Psychometric principles apply to any physical system composed of gas vapour mixtures. The most common system of interest, however, is a mixture of water vapour and air, which is used in heating, ventilation, and air conditioning, as well as meteorology.
The dry-bulb temperature (DBT) is the temperature of an air sample as measured by an ordinary thermometer, with the thermometer's bulb dry. It is usually the graph's x axis, or horizontal axis. Temperature is measured in SI units of Kelvin; other units are Fahrenheit.
Wet-bulb temperature (WBT) is the temperature of an air sample after passing through a constant-pressure, ideal, adiabatic saturation process, that is, after passing over a large surface of liquid water in an insulated channel. In practise, this is the reading of a thermometer whose sensing bulb is covered with a wet sock that evaporates into a fast stream of sample air. When the air sample is saturated with water, the WBT equals the DBT. The slope of the constant WBT line reflects the heat of vaporisation of water required to saturate a given relative humidity of air.
The temperature at which a moist air sample at the same pressure would reach water vapour saturation is referred to as the dew point temperature (DPT). As heat is removed, water vapour begins to condense into liquid water fog or (if below freezing) solid hoarfrost at this saturation point. The dewpoint temperature is easily measured and provides useful information, but it is not normally regarded as an independent property. It repeats information that is already available from other humidity properties and the saturation curve.
At the same temperature and pressure, relative humidity (RH) is the ratio of the mole fraction of water vapour to the mole fraction of saturated moist air. RH is a dimensionless quantity that is typically expressed as a percentage. Constant RH lines reflect the physics of air and water and are determined experimentally. It should be noted that the notion that air "holds" moisture, or that moisture dissolves in dry air and saturates the solution in some proportion, is an incorrect (though widely held) belief (see relative humidity for further details).
The humidity ratio (also known as moisture content, mixing ratio, or specific humidity) is the mass of water vapour per unit mass of dry air at the given conditions (DBT, WBT, DPT, RH, etc.). It is usually the graph's y-axis, or vertical axis. There will be a specific humidity ratio for which the air sample is at 100 percent relative humidity for a given DBT: the relationship reflects the physics of water and air and must be measured. The humidity ratio has no dimensions, but it is sometimes expressed in grammes of water per kilogramme of dry air or grains of water per pound of air.
Specific enthalpy, denoted by h, is the sum of the internal (heat) energy of the moist air in question, including the heat of the air and water vapour contained within. Lines of constant enthalpy are parallel to lines of constant WBT in the approximation of ideal gases. Enthalpy is measured in joules per kilogramme of air (SI) or BTU per pound of dry air (BTU/pound).
Specific volume, also known as inverse density, is the volume of an air sample per unit mass. SI units are cubic metres per kilogramme of dry air, whereas other units are cubic feet per pound of dry air. The psychrometric chart's versatility stems from the fact that the other properties can be determined by knowing three independent properties of some moist air (one of which is the pressure). Changes in state, such as when two air streams mix, can be easily and graphically modelled using the appropriate psychrometric chart for the location's air pressure or elevation relative to sea level.
The Mollier diagram (pressure-enthalpy) for water in air, developed by Richard Mollier, depicts the relationship between DBT, WBT, and RH. Willis Carrier, widely regarded as the "Father" of modern air-conditioning, rearranged the Mollier diagram for moist air (its T-s chart) to allow for such graphical solutions. Since then, many variations and improvements to psychrometric charts have occurred, and most charts do not display the specific entropy (s) as the Mollier diagram does. ASHRAE now publishes what are considered modern, standard psychrometric charts in both I-P and SI units for a wide range of elevations and air pressures.
Key Takeaways:
- WBT
- DPT
- (RH
- The humidity ratio
- Specific enthalpy
- Specific volume
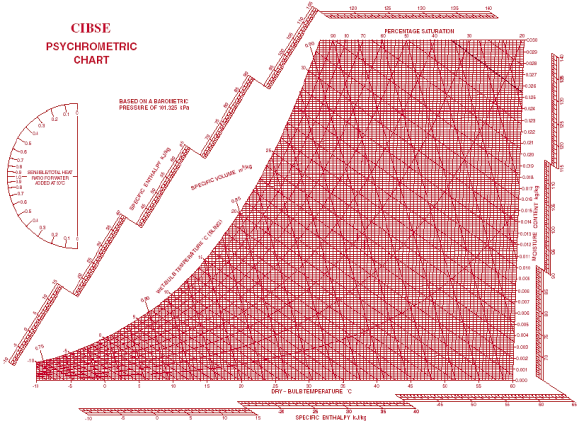
A psychrometric chart is a graph that displays the physical properties of moist air at constant pressure (often equated to an elevation relative to sea level). The chart graphically expresses how various properties relate to one another and thus functions as a graphical equation of state.
The "ω-t" (omega-t) chart is the most commonly used by practitioners and students alike, with the dry bulb temperature (DBT) appearing horizontally as the abscissa and the humidity ratios () appearing as the ordinates. To use a specific chart, at least two of the six independent properties must be known for a given air pressure or elevation (DBT, WBT, RH, humidity ratio, specific enthalpy, and specific volume). This opens up a world of possibilities.
DBT: This can be deduced from the x-axis abscissa and the horizontal axis.
DPT: Follow the horizontal line from the point where the horizontal axis line arrives at 100 percent RH, also known as the saturation curve.
WBT is a line that is inclined to the horizontal and intersects the saturation curve at the DBT point.
RH: Asymptotically drawn hyperbolic lines with respect to the saturation curve, corresponding to 100 percent RH.
The humidity ratio is indicated on the y-axis. Lines of equal values, or hash marks, for slope from upper left to lower right.
Specific volume: A parallel family of lines with equal spacing
Sensible Cooling & Sensible Heating of Air
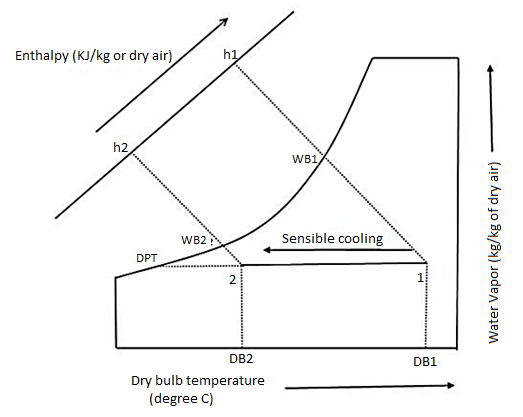
One of the most common psychrometric processes in air conditioning systems is air cooling. The primary function of air conditioners is to cool the air that has been absorbed from the room or the atmosphere, which is at higher temperatures. The sensible cooling of air is the process of removing only the sensible heat of the air to reduce its temperature while leaving the moisture content (kg/kg of dry air) unchanged.
The dry bulb (DB) and wet bulb (WB) temperatures of the air decrease during the sensible cooling process, while the latent heat of the air and the dew point (DP) temperature of the air remain constant. The enthalpy of the air is reduced in general.
The cooling of air in a standard window or split air conditioner is accomplished by passing it over the evaporator coil, also known as the cooling coil. The room air or atmospheric air passes over this coil carrying the refrigerant at extremely low temperatures, gets cooled, and then returns to the space that needs to be kept at a comfortable temperature.
In general, sensible cooling is accomplished by passing air over the coil. These coils, which are also known as evaporator coils in unitary air conditioners, are cooled by the refrigerant passing through them. These coils in central air conditioners are cooled by chilled water, which is chilled by passing through the evaporator of the large air conditioning system. In some cases, the coil is also cooled by some gas passing through it.
On the psychrometric chart, the sensible cooling process is represented by a straight horizontal line. The line begins at the initial DB temperature of the air and ends at the final DB temperature of the air, extending from high to low temperature on the left side (see the figure below). Because the moisture content of the air remains constant, the sensible cooling line is also the constant DP temperature line. The initial and final points on the psychrometric chart provide all of the air's properties.
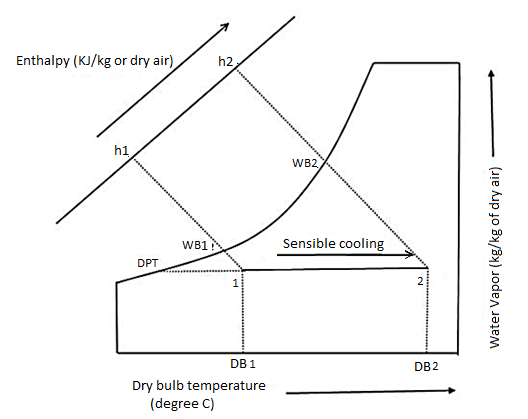
The sensible heating process is the inverse of the sensible cooling process. The temperature of the air is raised without changing its moisture content during the sensible heating process. The sensible heat, DB, and WB temperatures of the air rise during this process, while the latent heat and DP point temperature of the air remain constant.
When the air conditioner is used as a heat pump to heat the air, it is critical that the air be heated sensibly. The air in a heat pump is heated by passing it over the condenser coil or heating coil, which contains the high-temperature refrigerant. In some cases, air is heated to suit various industrial and comfort air-conditioning applications where large air conditioning systems are used.
In most cases, the sensible heating process is accomplished by passing air over the heating coil. This coil can be heated by passing refrigerant, hot water, steam, or an electric resistance heating coil through it. Industrial applications make use of hot water and steam.
The sensible heating process, like the sensible cooling process, is represented on the psychrometric chart by a straight horizontal line. The line extends to the right from the initial DB temperature of air to the final temperature (see the figure). The constant DP temperature line is also the sensible heating line.
Simple Humidification Process:
A vertical line on a psychometric chart can represent adding moisture at constant dry bulb temperature.
Only when heat of vaporisation is supplied from a source other than air without affecting the dry bulb temperature is a pure humidifying process possible. This occurs when water at the dry-bulb temperature of the entering air is sprayed into the chamber, which is kept at the air DB temperature.
Heat supplied = h2 – h1 kJ/kg dry air = (w2 – w1) x Latent heat
Moisture added = w2 – w1 kg/kg dry air.
Simple Dehumidification Process:
When air is passed over chemically absorbing moisture and heat evolved, pure dehumidification occurs without a change in the dry-bulb temperature of the air; when moisture is absorbed, it is immediately removed by the surrounded walls. These walls are kept at the temperature of a dry bulb of air. The chemical is also kept at the air's dry-bulb temperature.
Heat removed = h1 – h2 = (w1 – w2) x Latent heat.
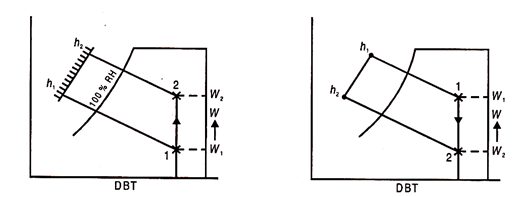
In practise, pure or simple humidification and dehumidification processes do not exist and are always accompanied by heating and cooling.
References:
1. Basic and Applied Thermodynamics by PK Nag, MCGRAW HILL INDIA.
2. Thermodynamics for Engineers by Kroos& Potter, Cengage Learning.
3. Thermodynamics by Shavit and Gutfinger, CRC Press.
4. Thermodynamics- An Engineering Approach by Cengel, MCGRAW HILL INDIA.
5. Basic Engineering Thermodynamics, Joel, Pearson.