Unit - 3
Engineering economy and Inventory control
Fixed assets, such as plant and machinery, are used in the firm to produce goods or provide services. The value of such fixed assets depreciates over time as they are used.
During a specific period, the value of a percentage of fixed assets used to generate income must be charged. In order to determine the true cost, the accounting year must be used. This percentage of the fixed asset's cost is referred to as depreciation. Depreciation is the term used to describe the decrease in the value of an asset or its utility as a result of the passage of time, natural wear and tear, and other factors, tears, fatigue from the subject.
Causes of Depreciation
- Lapse of time.
- Natural wear and tear.
- Exhaustion of the subject matter.
- Obsolescence of technology.
Objectives of Providing for Depreciation
- To ascertain the true results of operations.
- To present true and fair value of the fixed asset.
- To accumulate funds for the replacement of the asset.
Factors in measurement
It is difficult to calculate the exact amount of depreciation. In general, the following considerations are considered while calculating depreciation.
- Cost of asset including expenses for installation etc.
- Estimated useful life of the asset.
- Estimated scrap value (if any) at the time of useful life of the asset.
Methods of providing depreciation
- Straight Line method (SLM).
- Reducing Balance Method RBM.
- Machine Hour Method.
- Production Units Method.
Straight Line Method:
This strategy involves writing off an equal amount every year during the asset's working life to nil or its residual value at the end of its useful life.
SLM: This technique is based on the premise that a given asset creates equal utility over its lifetime.

Example:
Cost of machinery: 18000
Installation Charges:2000
Useful Life of Asset: 5 Years
Calculate Depreciation as per SLM

Reducing Balance Method:
Each year, a specified proportion of the asset's diminishing value is written off using this technique. The annual depreciation costs reduce from year to year.


RBM: The fundamental advantage of this system is that while depreciation is high and repairs are minimal, the total charge to total revenue is consistent, and as repairs grow, the burden of depreciation decreases.
RBM:


Example:
Cost of machinery: 50000
Scrap Value of machine:5000
Useful Life of Asset: 10 Years
Depreciation %: 15% p.a.
Calculate Depreciation as per reducing balance method for first 2 years
RBM:


Machine Hour Method:
Depreciation can be estimated on the basis of hours worked if a record of the actual running hours of each machine is kept. After determining the total number of hours that machine will work during its entire life, the machine hour rate of depreciation is derived. Depreciation is determined using the machine hour method for each hour the machine is in operation.
Example:
Cost of machine: 500000
Estimated working hours: 40000
Scrap Value: 10000
The pattern of distribution of effective working hours:
Year | Hours |
1-2 | 5000 per year |
3-5 | 7000 per year |
6-8 | 3000 per year |
Compute depreciation p.a.
Solution:


Production Unit Method:
Depreciation is calculated using this method by comparing annual production to the expected total production.
The following formula is used to calculate the amount of depreciation:

Example:
Cost of machine: 30000
Estimated total production: 4000
Scrap Value: 2000
Pattern of distribution of production:
Year | Units |
1 | 2000 |
2 | 1500 |
3 | 500 |
Solution:


The relationship between the factors that affect profit is established through break-even analysis. It represents the point at which cost and revenue are in balance. It's a straightforward way to show management the impact of volume changes on profit. The extensive study of break-even statistics will aid management in comprehending the impact of alternative options that convert variable to fixed costs, as well as costs that enhance sales volume and revenue. It's a useful tool for weighing the pros and cons of various options.
Assumptions in Break-Even Analysis:
- At all sales levels, selling prices will remain constant (quantity discounts are not available).
- The link between sales volume and costs is linear.
- Costs are split into two categories: fixed costs and variable costs. Fixed costs are those that do not vary with volume (quantity), whereas variable costs vary in direct proportion to quantity.
- The amounts of production and sales are equal. (At this time, there is no inventory.)
- Aside from the quantity, no other factors will affect the price.
Breakeven point:
The number of sales (sales volume) at which the sales income (revenues) equals the overall costs is referred to as the break-even point. It's a point where there's no profit. Profits result from quantities produced (sold) beyond break-even, while losses result from quantities produced (sold) below break-even. When all fixed expenses have been recovered, the break-even point is reached.
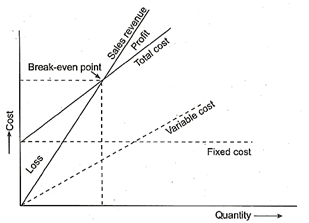
Let F represents the fixed cost
Q is quantity produced and sold
b is the sales price per unit
a is variable cost per unit
BQ total income (revenue)
AQ total variable cost

At, BEP, the total costs equal total income,
Therefore,


Margin of safety:
Margin of safety is the difference between the existing level of output and the level of output at BEP.

Angle of Incidence
This is a point where the sales line intersects with the total cost line. Because a great angle of incidence suggests a high profit rate, the management strives for the largest angle of incidence. Even fixed overheads are absorbed and have a low rate of return when seen from a restricted perspective.
Methods of Lowering BEP:
- Reduce fixed costs
Fixed cost is reduced from F to F'
The reduced BEP (Q') = Q. F' /F
Where Q is Break-even Quantity at Fixed Cost F.
- Reduce the variable cost
Variable cost is reduced from a to a'.
Reduced BEP (Q') = Q. (b-a/b -a')
(b - a) is contribution at variable cost a
(b - a') is contribution at variable cost a'
- Increase the slope of the income line from b to b
Reduced BEP Q' = Q. b-a/b' -a
b' is the increased price per unit.
b is the current price per unit.
Application of BEP
- Safety margin: A break-even chart allows management to see earnings at various levels of activity at a glance, and a safety margin refers to the number of sales that an organisation can afford to lose before it starts losing money.
- It aids profit planning: It is beneficial to calculate the volume required to achieve the desired profit. Sometimes a company's goal is to make a certain amount of money in a certain amount of time. It is simple to determine the volume of sales required to reach the desired profit using contribution margin for this purpose.
- It can be used to figure out how much lower the sales price can go in competition or how much more sales volume is needed to maintain a certain level of profit.
- It aids in decision-making in terms of equipment selection among options, process selection, and so on.
- It aids in making or purchasing decisions.
- It aids in the selection of product and advertising combinations.
Small business owners are frequently faced with the task of evaluating a capital investment project and deciding whether or not to expand their firm, purchase new equipment, or relocate to a new site. Internal cash and the ability to borrow money are frequently scarce. As a result, deciding whether to proceed with a project or purchase is important to a company's success.
Fortunately, there are various methods available to help small business owners evaluate a capital expenditure and establish the feasibility of each project:
- Payback method
The repayment technique is the most straightforward. It's the amount of time it takes for cash inflows to cover the investment's initial cost. The original investment is divided by the annual cash flow in this formula.
The following are some of the drawbacks of the payback method:
Cash flows beyond the repayment period will not be included in the payback method.
It does not consider the possibility of obtaining future financial flows.
The time value of money is not taken into consideration in this method.
- Net present value of cash flows
The net present value calculation, unlike the payback approach, considers the temporal value of money. It covers future cash flows for as long as the project generates cash following the payback period.
The net present value (NPV) method reduces a stream of future cash flows to its present value using the current interest rate on loans or the rate of return demanded by an investor or owner.
The NPV of a project is the amount by which the present value of cash inflows exceeds the present value of the initial investment. This allows you to compare projects by finding which one has the highest net present value. This strategy is more suited to larger tasks. This is due to the fact that larger initiatives have a higher NPV than smaller ventures with fewer funds spent.
To compensate for the risk level of future cash flows, you might alter the discount rate used to calculate the NPV. Because future cash flows are more uncertain in the restaurant example, the discount rate used to compute the NPV for a new site will be higher. The cash flow from expanding the current facility is more predictable.
- Internal rate of return
The discount rate for a project's internal rate of return is the rate at which the investment's net present value equals zero. If a project's IRR surpasses your required hurdle rate, you should consider accepting it. Your hurdle rate is determined by you, the business owner.
When you use the IRR method, you can compare projects to one another. If the IRR is more than the required hurtle rate, you should choose the project with the higher IRR.
None of these approaches will deliver the final answer on their own. Each method has its own set of benefits and drawbacks. The payback technique is straightforward to apply, but it does not account for financial flows that occur after the payback period has ended. The estimations of net present value favour large projects over small ones. Furthermore, when cash flows are both positive and negative, the internal rate of return yields various responses.
The most sensible strategy is to use all three methods to obtain comparison statistics for advice, and then employ common sense and experienced judgement.
Financial Statement Items: According to the ICAI's Standard on Auditing (SA)200,
- "General Purpose Financial Statement" [FS] includes a balance sheet
- Profit and loss statement
- Cash flow statement (where applicable)
- Statement and explanatory notes that are part thereof
- Supplementary schedules and information based on such statement.
While the auditor oversees forming and giving an opinion on the financial statements, the management of the company is in charge of their preparation. The creation of financial statements is essentially the responsibility of management.
Consider a ABCD Project
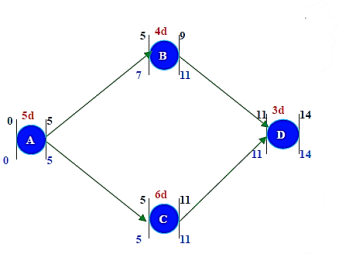
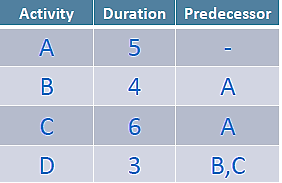
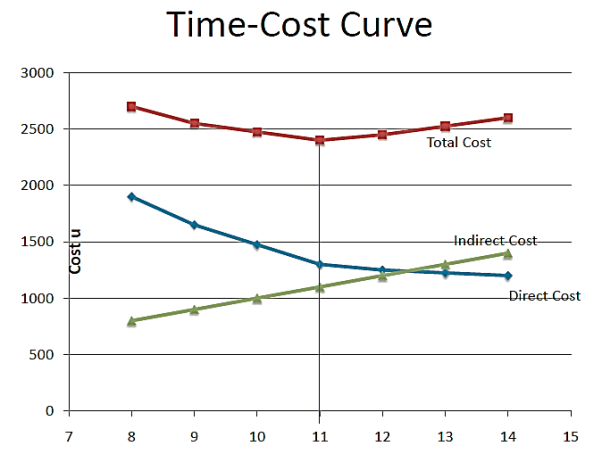
Current duration: 14 days
Expected duration: 10 days
For reducing Project Duration:
- Fast tracking
Preforming activities in parallel in order to reduce project duration
- Crashing
Reducing duration of activities to reduce project duration
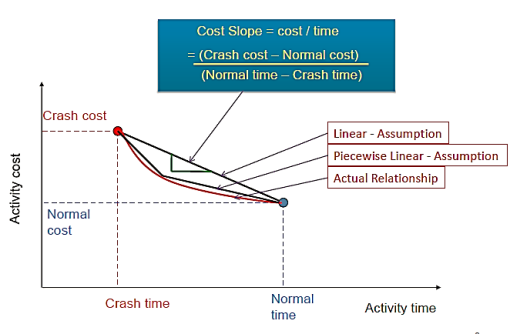
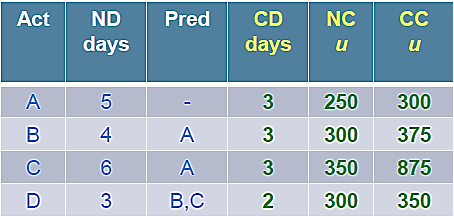
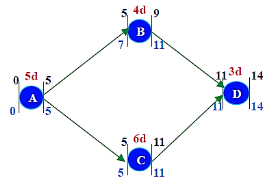
Crashing the ABCD Project:
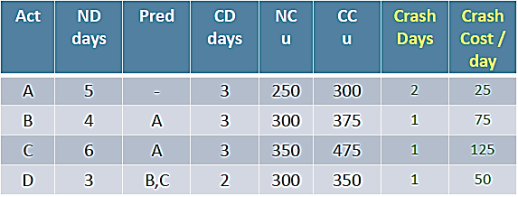
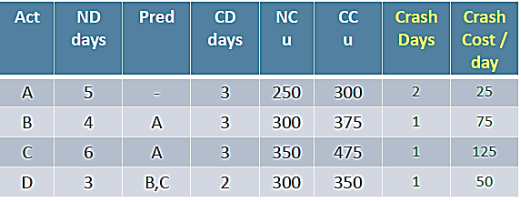
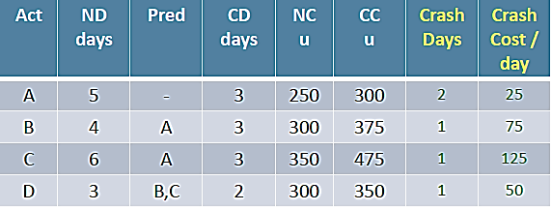
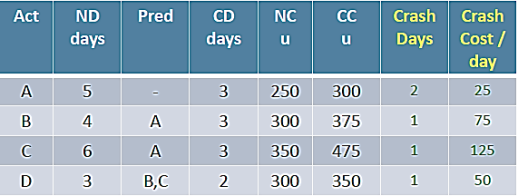
CC/day = (CC-NC) /(ND-CD)
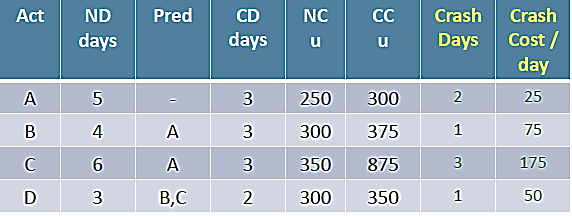
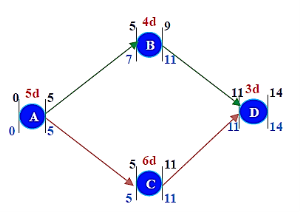
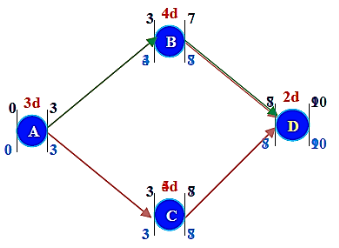
ABD –Non-Critical 12 days
ACD –Critical 14 days
ABCD Project Crash Duration -13 days
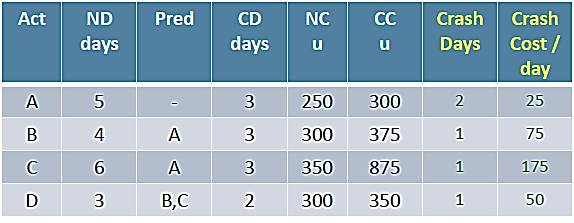
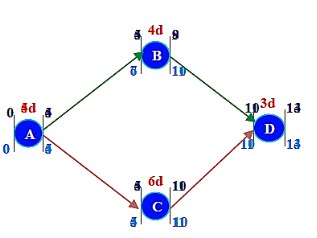
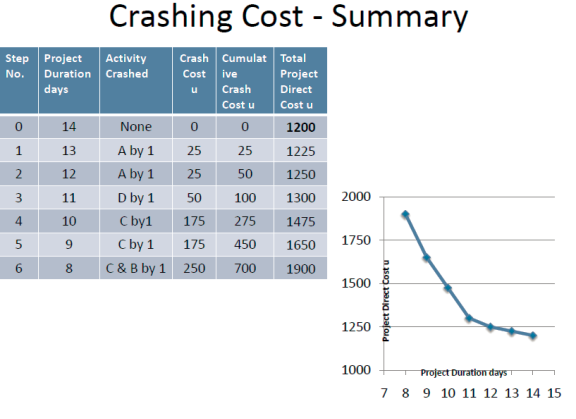
- Step 1: Crash the critical path ACD.
Options available to crash
A= u25
C= u 175
D= u 50
Crash A by 1 day: Cost = u 25
Still the critical path is ACD (13 days)
Project Crash Duration -12 days
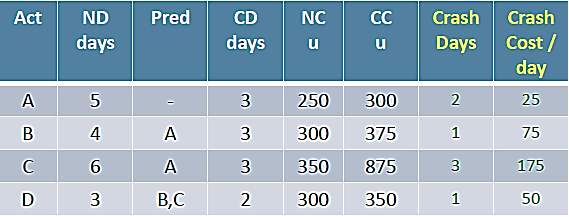
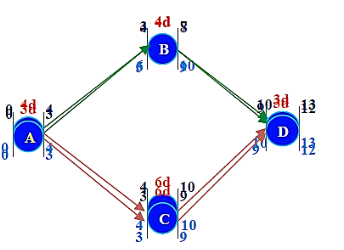
- Step 2: Crash the critical path ACD.
Options available to crash
A= u25
C= u 175
D= u 50
Crash A by 1 day: Cost = u 25
(A cannot be crashed any further)
Still the critical path is ACD (12 days)
ABCD Project Crash Duration -11 days
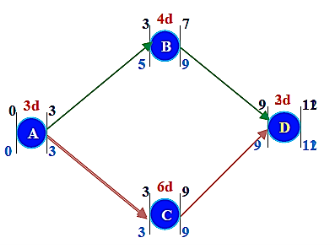
- Step 3: Crash the critical path ACD.
Options available to crash
A= u 25 (A cannot be crashed any further)
C= u 175
D= u 50
Crash D by 1 day: Cost = u 50
(D cannot be crashed any further)
Still the critical path is ACD (11 days)
ABCD Project Crash Duration -10 days
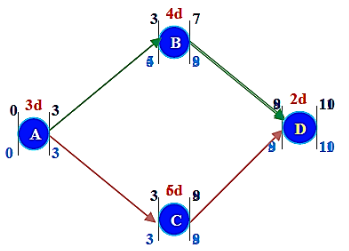
- Step 4: Crash the critical path ACD.
Options available to crash
A= u 25 (A cannot be crashed any further)
C= u 175
D= u 50 (D cannot be crashed any further)
Crash C by 1 day: Cost = u 175
Still the critical path is ACD (10 days)
ABCD Project Crash Duration -9 days
- Step 5: Crash the critical path ACD.
Options available to crash
A= u 25 (A cannot be crashed any further)
C= u 175
D= u 50 (D cannot be crashed any further)
Crash C by 1 day: Cost = u 175
Both ABD & ACD are Critical (9 days)
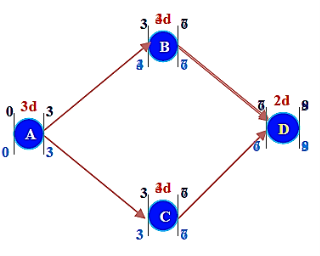
ABCD Project Crash Duration -8 days
- Step 6: Crash the critical path ACD & ABD.
Options available to crash
A= u 25 (A cannot be crashed any further)
C= u 175 & B= u 75
D= u 50 (D cannot be crashed any further)
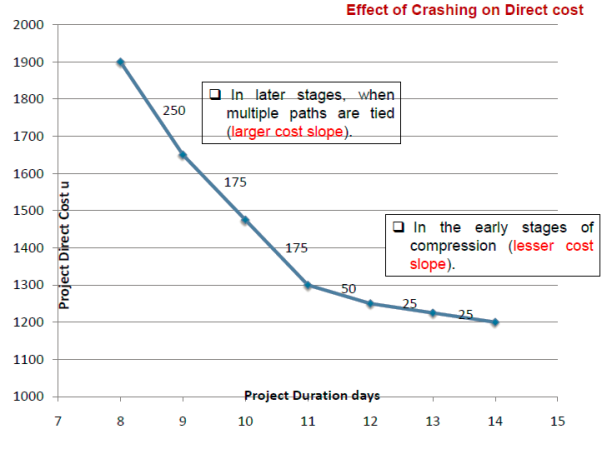
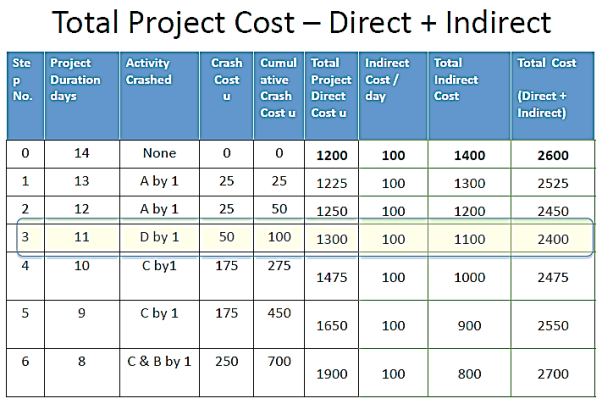
Crash C & B by 1 day: Cost = u 250
MAX CRASH
Projects do not always go according to plan. You may run into resource constraints and will need to adapt to keep project deliverables on track. This is where resource balancing comes into play. It helps you to rearrange timelines so that a project can be completed with the resources available. You can use this strategy to ensure that goals and objectives are met by allocating resources appropriately.
What is resource levelling:
Resource levelling is a project management approach for managing overallocation and scheduling issues so that a project can be completed with the resources available. Time, materials, and tools are all resources required to finish a project.
Resource levelling is used to make the most of available resources while staying within the project's schedule, cost, and scope restrictions. Resource levelling is difficult for project managers since it necessitates balancing demand for the same resources across many projects.
When to use resource levelling:
Resource levelling keeps resources from being overstretched while also ensuring that projects have everything they need to succeed. Not only does this strategy help with project management, but it also helps the team maintain a healthy work-life balance. Here are a few reasons why resource levelling can help your squad.
- To make the most of your resources:
Resource levelling allows you to make the most of the resources you have at your disposal. It assists you in determining which projects require additional resources and which ones have more leeway in terms of timelines.
- To keep deficits to a minimum:
Resource levelling helps to avoid substantial project delays, reducing costs and labour losses. This method enables you to control resource demand while remaining within the company's present capacity and financial resources.
- To avoid job overburdening
Over allocating resources results in overwork, which can be stressful for team members. Resource levelling prevents this by resolving overallocation issues and altering deadlines so that team members aren't overburdened.
- To ensure that a project's output is of high quality
By maintaining the same level of quality for project deliverables, you can manage both resources and customer expectations. Resource levelling is a technique that can be used to resolve budget concerns, resource overallocation, and project delays in general.
Project Resource levelling:
- Critical path method
The critical path method is a resource levelling methodology that is commonly used to estimate project duration without taking into consideration resource constraints.
This method entails connecting dependent project activities in a logical manner in order to determine the earliest and latest potential start and conclusion dates for each activity. The "critical route" is the order in which the longest-duration tasks must be done in order to properly complete a project.
You may assess the "float," or schedule flexibility, of the activities in the critical path once you've identified them.
- Fast tracking
There are instances when projects must be delivered on time or ahead of schedule to meet client expectations. You can utilise fast tracking to perform numerous parallel jobs to speed up the project in those circumstances. Only if the tasks can overlap to some extent can this schedule compression strategy function.
Activities having dependencies, for example, can be staggered whereas activities without dependencies can run concurrently.
- Crashing
When fast tracking isn't possible or isn't successful enough, the crashing approach might be used. This is when more resources are assigned to a project in order to reduce its schedule. In this instance, you must evaluate the requirements of high-priority jobs and seek for resource solutions that deliver the most value for the least money.
- Critical chain method
The critical chain approach is an improvement on the critical path method. The critical chain technique, unlike the critical path method, considers resource constraints. The critical chain in this example refers to the longest sequence of tasks, taking both task and resource dependencies into consideration. At any given time, a resource can only be assigned to one task.
This approach of project scheduling entails creating a list of required resources for tasks and reassessing their availability as needed.
A buffer interval is included in the critical chain method between the last job and the project completion date, acting as a contingency for critical chain activities.
Resource levelling tools:
- Use Gantt charts
- Leverage project management software
- Draw network diagrams
- Use previous projects as a reference
- Make realistic estimations of resource needs
The materials in stock are referred to as inventory. It's also known as an organization's idle resource. Inventories are things that are either stocked for sale, are in the process of being manufactured, or are in the form of materials that have yet to be used.
Reasons:
- To stabilise production
- To take advantage of price discounts
- To meet the demand during the replenishment period
- To prevent loss of orders (sales)
- To keep pace with changing market conditions
Objectives:
- Assuring adequate product supply to customers and avoiding shortages as much as feasible.
- To ensure that the financial investment in inventories is kept to a bare minimum (i.e., to ensure that working capital is blocked to the bare minimum).
- Purchasing, storing, using, and accounting for commodities efficiently is a key goal.
- To keep a timely record of all item inventories and to keep the stock within the required limits.
- To guarantee that replenishment is done in a timely manner.
- Maintain a reserve stock to account for fluctuations in material supply lead times.
- To provide a scientific foundation for both short- and long-term material planning.
Benefits:
- Better customer relations as a result of on-time delivery of goods and services.
- Consistent and smooth production, resulting in no stock out.
- Effective working capital management.
- Assists in reducing losses caused by degradation, obsolescence, and pre-life average.
- Purchases that are cost effective.
- Removes the possibility of ordering twice.
Production expenses are divided into two categories: costs of capital assets and costs of production. The manager's ability to exercise adequate cost management and manufacture items at the predetermined cost level is dependent on the classification and analysis of costs.
Cost of Production:
- Purchase expenses for raw materials, purchased components and subassemblies, as well as procurement and transportation.
- The cost of purchasing supplies such as oils, lubricants, low-value tools, fuel oil, machinery spares, cotton waste, and so on.
- Wages and wages for direct production workers, maintenance inspectors, store employees, supervisors, and other employees.
- Costs incurred by subcontractors as a result of orders placed with them.
- Cost of rejects, wastage, spoiling, and rework on the production line.
- Expenses for factory building rent and insurance, plant and machinery insurance, stores, and so on.
- Working capital interest, to the extent it pertains to inventories.
- The cost of acquiring capital assets like as buildings, machinery, tools, inspection equipment, furnishings, and so on, as well as the depreciation of these assets.
Classification of Cost:
1. Distinctive features (material, labour and overhead)
2. Increases or decreases in activity or volume (fixed, variable, mixed)
3. The degree of product traceability (direct cost, indirect cost)
4. Analysis and decision-making costs (sunk costs, opportunity costs, controllable and non-controllable costs, differential, imputed costs)
5. Additional classifications (product cost, period cost).
Natural classification of cost:
- Direct material refers to the cost of materials that become a significant portion of the final product. They are the raw materials that are traceable to specific output units and become an intrinsic element of the finished product.
- Direct labour is defined as the work done by workers who are directly involved in the manufacturing process. It is the labour costs for specific work done on things that can be traced back to finished goods.
- Direct expenses are the costs incurred on a specific activity or product (other than direct materials and direct labour). These are also known as reimbursable expenses.
- Manufacturing costs are sometimes known as factory overheads. Indirect materials, indirect labour, and indirect expenses are all included.
- Distribution and administrative costs: Distribution costs are often known as marketing or sales costs. Advertising, salesman salary and commissions, packaging, storage, transportation, and sales administrative charges are all included in these expenditures. The expenditures of planning and controlling basic business activities are included in administrative overhead. Administrative overheads encompass any costs that are not charged to production or sales.
- Direct Material + Direct Labour + Direct Expenses = Prime cost
- Indirect Material + Indirect Labour +Indirect expenses = Factory Overhead
- Prime cost + Factory Overhead = Factory Cost
- Factory cost + Distribution And Administrative overhead = Total Cost
Classification Based on Activity or Volume:
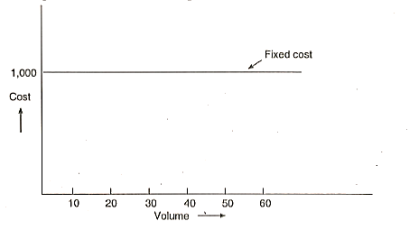
- Fixed cost
The costs that do not fluctuate over time despite changes in the amount of output. This cost is unaffected by production volume.
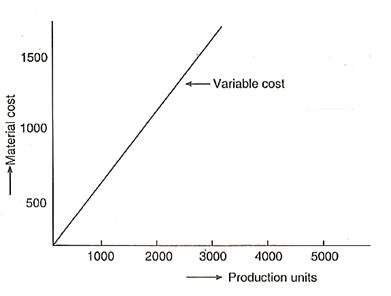
- Variable cost
These are proportionately and directly proportional to output. The change in cost and the change in output level have a continuous relationship.
Direct labour and direct material expenses are typically variable costs. The use of raw materials and direct labour in production departments results in variable costs.
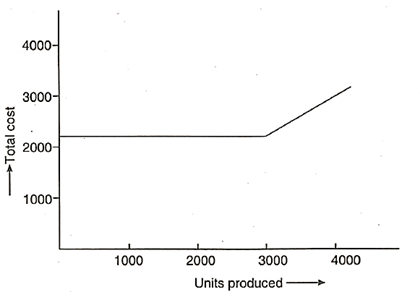
- Mixed cost
Fixed and variable expenses combine to form mixed costs. They're a mix of semi-variable and semi-fixed expenses. They fluctuate with volume due to the variable component, but they do not change in direct proportion to output due to the fixed component.
Semifixed costs are those that are fixed until a specific level of output is reached, after which they become variable. The term "semi variable cost" refers to a cost that is essentially variable but whose slope can abruptly alter when a specific output level is reached.
- Opportunity cost
The gains lost by rejecting the best competitive alternative to the one chosen are referred to as opportunity cost. The benefit that is typically lost is the net earnings or profits that could have been earned from the rejected option.
- Sunk cost
It's a financial outlay on equipment or productive resources that has no economic bearing on the current decision-making process. It is a cost that has already been incurred or will be incurred in the future, but it will be the same regardless of whatever alternative course of action is chosen. It is commonly referred to as an unavoidable cost.
- Controllable & Non-Controllable cost
A controllable expense is one over which a manager has entire decision authority, i.e., one over which the manager has complete control, such as indirect labour, cutting tools, and lubricants. Uncontrollable cost is a cost that cannot be altered by the actions of a specific member of an organisation.
- Imputed cost
Imputed costs are costs that are not incurred in a transaction but are significant to the decision in the context of that transaction. Traditional accounting methods do not account for these costs, such as interest on internally generated cash, rental value of company-owned property, and so on.
- Out of Pocket Costs
The cash expense of an activity is referred to as out-of-pocket charges. Out of pocket costs do not include non-cash costs like depreciation.
Analysis of production cost:
Direct material cost:
Direct materials are those that can be directly linked to the production. It's critical to understand what goes into the actual material cost. The expenses of direct materials are examined in terms of purchasing, material purchase price, storage, and issue.
- Direct material purchase
- Direct material storage and issue
Direct labour cost
Production overhead:
Overheads are costs that cannot be linked back to a product, such as indirect material, indirect labour, and indirect expenses incurred at the cost centre, and production overhead is the component of the overhead that relates to the production function.
- Primary overheads:
Overhead costs can be directly linked to a specific department or cost centre, indicating that they were incurred for that cost centre. These expenses can't be linked to individual products or jobs, but they can be assigned to specific departments. Expenses shared by all departments, such as power, light, rent, depreciation of factories and buildings, and other expenses, cannot be charged directly to the department. These costs are not the result of any department. As a result, these expenses should be allocated to any or all departments that use such equipment. The process of charging expenses to multiple cost centres or departments in a fair proportion is known as cost apportionment.
1. Direct labour hours/or machine hours.
2. Number of workers employed.
3. Floor area occupied.
- Secondary distribution:
Secondary distribution refers to the shift of service department overhead to production departments or centres.
1. Benefits obtained.
2. Ability to pay.
3. Efficiency or incentives.
- Methods of absorption of factory overheads
Overhead absorption is the process of allocating overhead to cost units (output).
1. Percentage on direct labour.
2. Percentage on direct wages.
3. Prime cost percentage.
4. Unit of production basis.
5. Machine hour rate.
One of the most basic problems in inventory management is determining the order amount that is most cost-effective from an overall operating standpoint. The issue here is minimising the two costs that are in conflict, namely, the ordering cost and the inventory carrying cost.
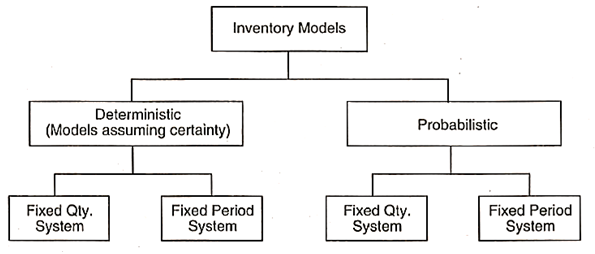
Inventory models assist in determining the order quantity that reduces total costs (the sum of ordering and inventory carrying expenses). There are three types of inventory models.
Model-I: Economic Order Economic Order Quantity with Instantaneous Stock Replenishment (Basic Inventory Model):
- Demand is deterministic, constant and it is known.
- Stock replenishment is instantaneous (lead time is zero)
- Price of the materials is fixed (quantity discounts are not allowed)
- Ordering cost does not vary with order quantity.
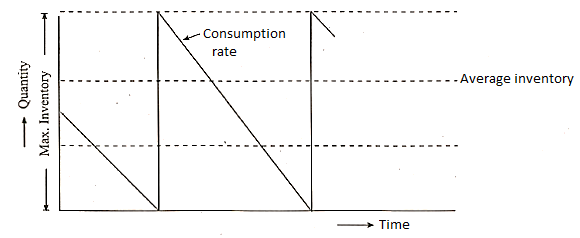
Let D be the annual demand (Units per year)


To determine Economic order quantity (EOQ), differentiate, Annual Total cost w.r.t. Q and set the first derivative equal to zero.


Note: If the inventory carrying cost is expressed as a percentage of annual average inventory investment, then

Optimal time interval between two orders.

Minimum total yearly inventory cost is given by,


Model-II. Economic Order Quantity When Stock Replenishment Is Non-Instantaneous (Production Model):
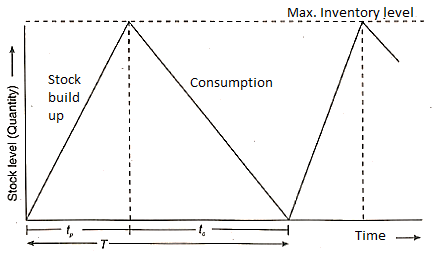
When inventory grows up over time after an order is placed, or when units are made and consumed (or sold) at a steady rate, this model is appropriate. This model is known as the "Production Model" because it is particularly well suited to industry environments with simultaneous production and consumption.
Assumptions:
1. The item is sold or consumed at a known, continuous demand rate.
2. The cost of setup is set and does not alter with the size of the lot.
3. The growth in inventory is progressive rather than sudden.
Let p be the production rate.
d is the demand or consumption rate.
Replenishment of inventory under this system build-up during the period  , and consumption takes place during the entire cycle T
Inventory under this situation, builds at the rate of (p - d) units and Inventory is maximum at the end of production period  .
.


The quantity produced

During production period,


To determine, the economic Batch (Lot) size (EBQ) differentiate equation with respect to Q, set the first derivative equal to zero.


Note: If the inventory carrying cost is expressed as a percentage of annual average inventory investment, then

Optimal total cost is given by

Optimal time interval between two orders.

Optimal number of production runs,

Inventory management systems are designed to deal with circumstances where demand, lead time, or both fluctuate. The fundamental approach to all stock control strategies is to create a reorder level that, when reached, signals the need for replenishment. As a result, inventory replenishment entails establishing the quantity to be bought as well as the ordering time.
Basically, there are two types of replenishment systems.
1. Fixed quantity system (Q-system)
2. Fixed period system (P-system)
Fixed Order Quantity System:
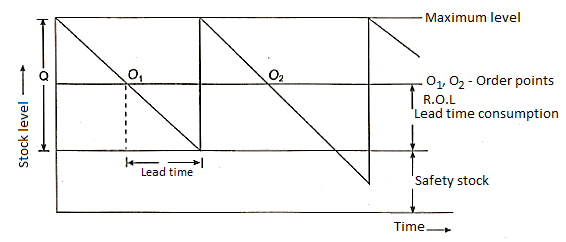
This is also known as the Q-system or perpetual inventory system. The order amount is fixed in this system, while the ordering time varies according to demand fluctuations.
The characteristics of this system are:
- Re-order quantity is fixed and normally it equals Economic order quantity (EOQ).
- Depending upon the demand, the time interval of ordering varies.
- Replenishment action is initiated when stock level falls to Re-order level (ROL).
- Safety stock is maintained to account for increase in demand during lead time.
Parameters to Operate the System:
- Re-Order (ROL)
This equals the sum of safety stock and lead time consumption.

Where m — is the minimum, or safety stock.
L — Lead time (days/weeks/months)
C — consumption rate. (Per day/per week/per month)
2. Re-order quantity (Q)
This normally equals Economic order quantity (EOQ)
3. Maximum stock level (M)
It equals the safety stock + order quantity

Where  is order quantity
m = Safety stock
M = Max. Stock
4. Average inventory


Advantages
- Easy to use and less expensive to run.
- Stock control will be precise because replenishment is started as soon as the stock reaches the R.O.L.
- Appropriate for low-cost commodities.
- Appropriate for the diversity of inventories held by the company.
Limitations
- If numerous things reach R.O.L. At the same time in this inventory system, the re-ordering system will be overloaded.
- Records of stock levels and data on utilisation rates must be kept.
Application: Two Bin System
Two bin system operates on R.O.L. System and it physically segregates the stock of entire items into two bins.
The second bin contains quantity equal to R.O.L. i.e., (m.+ LC) and it is means to satisfy demand during the replenishment period.
The first bin contains the quantity (Order quantity) = (Q - LC) to satisfy demand between the receipt of materials and placing the next order. LC is the lead time consumption.
Working of the system:
The inventory from the first bin gets consumed first. When the first bin is empty, the stock has reached R.O.L., and the replenishment process begins.
During the replenishing time, the quantity in the second bin is thus consumed. This system decreases the amount of time spent keeping records and reducing (clerical) errors.
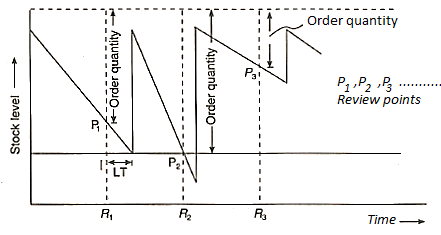
Periodic Review System
It's also known as the P-system or fixed period system.
Although this system has a set ordering interval, the order quantity may fluctuate depending on demand.
The inventory status is verified at predetermined intervals (weekly/monthly/quarterly) in this system, and replenishment action is then conducted based on the circumstance.
The following are the system's characteristics:
- The order interval for each individual item or set of items is fixed.
- The inventory is assessed on a regular basis, and the amount (Q) that will bring the inventory to its maximum level is ordered.
Parameters to Operate the System:
- Maximum level (M)
It is sufficient to satisfy demand during review period and lead time.
Max. Level (M) = Min. Stock + Consumption during review period and lead time.
M = m + C (R + L)
- Re-Order Quantity
(i) when lead time is less than review period,
Q = Maximum stock — stock held at the time of review.
(ii) when lead time is more than review period.
Q = Max. Stock — (Stock on hand + Stock on order)
This system is suitable for high value items which require strict control on stock levels.
Q-system | P-system |
| The period of ordering the inventory is fixed and the order quantity depends on the stock on hand. |
2. It is suitable for low unit cost, high volume items. | Suitable for high unit cost and less in number items |
3. Normally preferred when supplier puts minimum quantity restriction | Preferred when supplier delivers at fixed periods. |
Selective control refers to the variation in control methods from one item to the next on a case-by-case basis. For this objective, a variety of criteria are applied.
They are:
• Based on the cost of the product/item
• Lead time
• Usage rate
• Procurement difficulties, criticality, frequency of usage
The selective control is more effective because it targets larger groupings of items. The objects in this system are divided into a few divisions based on the criteria chosen, such as value, usage, and consumption frequency. This sorting aids the organization's inventory control efforts. There are many different types of classifications.
Classification | Criteria |
1. A.B.C. Analysis | Annual usage value of items |
2. V.E.D. Analysis (Vital, Essential, Desirable) | Criticality of the item (material criticality) |
3. S.D.E. Analysis (Scarce, Difficult, Easy) | Procurement difficulties |
4. H.M.L. Analysis (High, Low, Medium) | Unit price of the material (it does not depend upon consumption) |
5. F.S.N. Analysis (Fast, Slow, Non-moving) | Issues from stores |
6. S.O.S. (Seasonal, Off Seasonal) | Seasonality of items |
7. X.Y.Z. Analysis | Inventory value of items used |
8. G.O.L.F. (Govt, Ordinary, Local, Foreign) | Source of material |
ABC Analysis:
An industrial company's inventory typically contains thousands of items with different pricing, consumption rates, and lead times. It is neither desired nor practicable to give each item equal attention. For example, around 5% of the elements in a television set account for 80% of the entire cost. This is true for the majority of products, such as a car or a refrigerator.
ABC analysis is a simple analytical approach that allows management to focus its efforts where they will yield the best outcomes.
In business, the Pareto principle (20/80) of cause and effect is a useful notion that may be utilised to solve the majority of production, quality, and inventory problems.
ABC analysis is a concept that is used in inventory control.
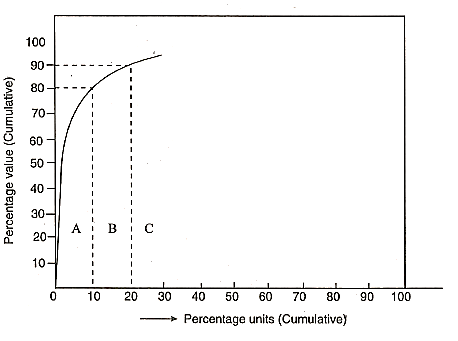
According to statistics, only a few things account for the majority of annual material use. These few products are referred to as A class items, and they are crucial to company. The remaining elements, referred to as B and C, are many, but their contribution is minor. On the basis of their annual consumption, ABC analysis prefers to categorise things into three categories: A, B, and C. The classification is made to ensure that it receives the proper attention and management that it requires.
- A-class items: These items make up just 5-10% of total inventory and account for 70-75 percent of overall inventory expenditures. These goods necessitate a high level of control and must be kept in lesser numbers. These things must be purchased on a regular basis, with each purchase resulting in a smaller quantity. A class inventory is kept to a bare minimum.
- B class items: These items typically make up 10-15% of total items and account for 10-15% of overall material spending. These are products that are in the middle. These items should have a control that is halfway between A and C.
- C class items: These account for roughly 70-80 percent of total material expenditures and just 5-10 percent of overall material expenditures.
These items being less expensive does not require strict control. These are ordered in bulk as against infrequent ordering of A class items.
Advantages:
This method enables the manager to exercise selective control and concentrate his attention on a limited number of items.
The materials manager can exhibit the outcomes in a short amount of time by exerting strong control over A class items. It lowers clerical expenses, saves time and effort, and improves planning and control while increasing inventory turnover. As a result, ABC analysis aims to focus and direct effort based on the merits of the items, and so becomes a useful management control tool.
Limitation:
ABC analysis is a critical technique for exercising selective control over a large number of inventory items, but it does not allow for precise assessment of all important inventory management issues in its current form.
ABC analysis is a continuous process that requires objects to be evaluated and recategorized on a regular basis.
A Class (High Value) | B Class (Moderate Value) | C Class (Low Value) |
1. Tight control on stock levels | Moderate control | Less control |
2. Low safety stock | Medium safety stock | Large safety stock |
3. Ordered frequently | Less frequently | Bulk ordering |
4. Individual posting in stores | Individual posting | Collective postings |
5. Continuous check on schedules and revision when called for | Broad check on schedule revisions | Monthly control reports |
6. Weekly control statements | Monthly control reports | Quarterly control reports |
7. Procured from multiple sources | Two or more reliable sources | Quarterly control reports |
8. Minimise waste, obsolete and surplus | Quarterly control over waste | Annual review regarding waste |
9. Continuous effort to reduce lead time | Moderate efforts | Minimum efforts |
Procedure:
- Multiply the number of units consumed in a year by the unit price of each item in inventory to get the overall inventory value.
- List these items in descending order of their total worth, starting with the item with the highest total value and working your way down:
- Make a table with the item number, unit cost, annual unit consumption, and annual rupee value of units consumed.
- Compute the running total for the items as well as the rupee worth of consumption item by item.
- Subtract the item count from the total annual usage amount to get the cumulative percentage.
- Sort the objects according to the ABC guidelines.
- The total percentages are visually shown.
This analysis shows a criticality-based classification of objects.
The items are divided into three categories: vital, essential, and desired, according to the analysis.
The manufacture of vital items will be halted if they are not available.
Essential items are those that have a high stock out cost.
Desirable items will not create any immediate production halts, and the costs of stocking them are minimal.
The purpose of this analysis is to discover key things. From a production standpoint, an item in the C-category could be crucial.
Each item's service level can be identified, and inventory can be planned accordingly.
Solved Examples of Inventory control
Q.1. ABC Corporation has got a demand for particular part at 10,000 units per year. The cost per unit is 2 and it costs 36 to place an order and to process the delivery. The inventory carrying cost is estimated at 9 per cent of average inventory investment. Determine
(i) Economic order quantity.
(ii) Optimum number of orders to be placed per annum.
(iii) Minimum total cost of inventory per annum.
Solution:
Annual demand for parts  units/annum
Ordering cost  र
र  order
order
Cost per unit  unit
unit
Inventory carrying cost 
(i) Economic order quantity 
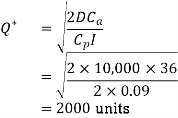
(ii) Optimum Number of orders 

(iii) Total Annual inventory cost

Q.2. A manufacturer has to supply his customers 3600 units of his product per year. Shortages are not permitted. Inventory carrying cost amounts 1.2 per unit per annum. The set-up cost per run is 80. Find:
(i) Economic order quantity.
(ii) Optimum number of orders per annum.
(iii) Average annual inventory cost (minimum).
(iv) Optimum period of supply per optimum order.
Solution:
Annual demand  units
units
Inventory carrying cost  श
श  unit
unit  annum.
Ordering cost  マ 80 /order.
(i) Economic Order Quantity.
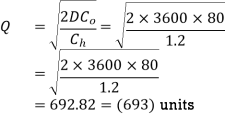
(ii) Optimum number of orders per annum.

(iii) Minimum annual inventory cost

(iv) Optimum period of supply per optimum order

Q.3. Usha Corporation currently practices the following system for the procurement of an item. No. Of orders placed in a year = 8, Ordering cost = 750/order. Each time order quantity = 250, Carrying cost = 40 per cent. Comment on the ordering policy of the company and estimate the loss to the company in not practising scientific inventory policy
Solution: Annual Demand
Ordering cost  र
र  order
order
Inventory carrying cost (i) = 0.4
Cost per unit (Cp)= 40
Economic order quantity

Minimum total cost (annual) corresponding to 

Total cost of inventory under present system.

Loss to the company in not operating scientific inventory

The queuing theory, often known as the waiting line theory, was developed by A.K. Erlangs in 1909 as a result of his efforts to analyse telephone traffic congestion in order to meet the randomly increasing demand for the Copenhagen automatic telephone system's services.
A waiting line problem is defined as a flow of customers coming at one or more service facilities at random. Customers may be served right away when they arrive at the facility, or they may have to wait until the facility is ready. Depending on the type of service, the service time allotted to each customer may be deterministic or non-deterministic.
Customers would establish waiting lines due to a lack of suitable service facilities. The easiest way to meet the service demand is to expand the service capacity. The ability. It's likely that it'll be built to such a high standard that it'll be able to satisfy peak demand with no lines. Adding capacity would be expensive and inefficient if it remained idle.
Excessive waiting is caused by providing poor service, which has a cost in terms of lost goodwill, customer irritation, and the direct cost of idle staff.
A high service level, on the other hand, would result in a high setup cost and idle time for the service stations. As a result, the purpose of queuing modelling is to strike a cost-effective balance between the cost of delivering a service and the cost of waiting for that service.
| Situation | Customers | Service Facility |
1 | Flow of automobile traffic through a road network | Automobiles | Road network |
2 | Banking transactions | Bank patrons | Bank tellers |
3 | Passage of customers through super market check outs | Shoppers | Check out points |
Benefits of Queueing theory:
Because many business challenges can be characterised by arrival-departure congestion difficulties, queuing theory has become a vital tool in business and industry.
Queuing theory can be used to solve a wide range of issues, like:
- Scheduling of transportation fleets, aircraft, and other aircraft.
- Control of job scheduling on the shop floor.
- Inventory control and analysis
- Salesman Routing and Scheduling
Queueing theory aims to better understand queues by attempting to create, interpret, and anticipate them. It develops models capable of influencing client arrival patterns or determining the ideal quantity of service facilities.
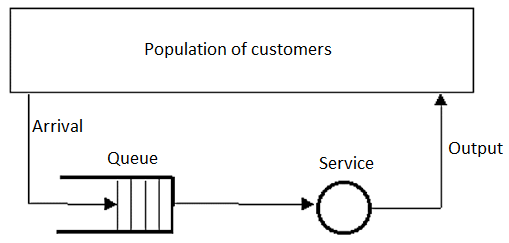
A queuing system is specified completely by seven main elements:
1. Input or arrival (inter-arrival) distribution
2. Output or departure (service) distribution
3. Service channels
4. Service discipline
5. Maximum number of customers allowed in the system
6. Calling source or population
7. Customer's behaviour.
Arrival Distribution:
It depicts the pattern in which clients arrive at the service facility in large numbers. The inter-arrival time, which is the time between two consecutive arrivals, can also be used to symbolise arrivals.
Random arrivals occur when arrivals are separated by equal intervals of time, unequal but absolutely known intervals of time, or unequal intervals of time whose probabilities are known.
Arrival rate refers to the rate at which customers come to be served, or the number of customers arriving per unit of time. Customers arrive in no logical pattern or sequence over time when the arrival rate is random. This is typical in most commercial situations.
We need to know the probability distribution describing arrivals, specifically the time between arrivals, when arrivals are random.
Random arrivals are often best captured by the Poisson distribution, according to management scientists. Of course, arrivals are not always Poisson, and we must be convinced that the Poisson distribution assumption is correct before applying it. A represents the mean value of the arrival rate. The (negative) exponential distribution of inter-arrival times with mean inter-arrival time is like the Poisson distribution with mean arrival rate A.
Service (Departure) Distribution:
It depicts how many clients depart the service facility in a given pattern. The service (inter departure) time, which is the time interval between two consecutive services, can also be used to indicate departures.
The length of service may be fixed or flexible, but it is either predictable or unpredictable (variable with only known probability).
We must determine which probability distribution best explains the behaviour of service times if they are randomly distributed. Management scientists have discovered that the exponential probability distribution effectively describes service delays in many circumstances where they are random.
The mathematics required to research waiting line behaviour is somewhat easier to construct and utilise if service times are exponentially distributed and arrivals are Poisson distributed.
The service rate is the rate at which one service channel can perform the service, i.e. the number of clients served per unit of time. This rate assumes that the service channel is always busy, with no downtime. The average service rate is denoted by the symbol µ. In commercial problems, uniform service rates will be found more frequently than uniform arrival rates.
Service Channels:
A single service channel may be available in the queuing system. As in a doctor's office, arriving consumers may form a single queue and be served. The system may have multiple service channels that are configured in parallel, series, or a sophisticated combination of both. At the case of parallel channels, multiple customers can be served at the same time, much like in a barbershop. For series channels, a customer must go through all of the channels before the service is completed, such as a product going through multiple procedures on different machines or students going by one counter after another during admissions before all of the formalities are done.
When the system has only one server, it is referred to as a one-server model, and when the system has multiple parallel channels, each with its own server, it is referred to as a multi-server model.
Several service channels may sometimes feed into a single subsequent service channel; for example, multiple ticket booths in a theatre may convey all ticket holders to a single ticket collector at the theatre's entrance. On the other hand, a single service channel might sometimes divide consumers among numerous channels that follow it, such as an office inquiry clerk.
Service Discipline:
The rule by which customers are selected from the queue for service is known as service discipline or order of service. The most typical discipline is 'first come, first served,' in which clients are served in the order in which they arrive, such as at movie ticket counters, train stations, and banks. The other discipline is 'last come, first served,' which is like how objects arriving last are taken out first in a large godown. 'Service in random order (SIRO)' and 'priority' are two more disciplines.
When an arriving customer is chosen for service ahead of other customers already in line, this is referred to as 'priority.' When a unit (client) comes, it is said to have 'pre-emptive' priority since it not only goes to the front of the line, but also displaces any unit that is currently being served. It has no effect on the line length or average waiting time if the order of service is unrelated to service time, but it does affect the time an individual customer has to wait.
As a result, the derivation of equations utilised in analysis is influenced by the service discipline. For the sake of this book, just the most prevalent service discipline of 'first come, first served' shall be assumed.
Maximum Number of Customers allowed in the System (Capacity of the System):
The system's maximum number of consumers can be finite or limitless. In some facilities, only a certain number of consumers are permitted in the system, and new customers are not permitted to join until the number falls below the limiting value.
Calling Source or Population:
Customers' arrival patterns are determined by the source that generates them. The calling source (population) is said to be finite when there are only a few potential clients. It is frequently claimed to be endless if there are a big number of potential clients (say, above 40 or 50). Another rule applies to determining if the source is finite or infinite.
When an arrival affects the likelihood of future customers arriving, it is said to be a finite source. In the case of machine repair, for example, a battery of M running machines is a finite resource. The calling source for any machine before it breaks down consists of M potential consumers. When a machine fails, it becomes a customer, and it is unable to create another 'call' until it is fixed (repaired). When the presence of a client has no effect on the pace of arrival of prospective future consumers, the source is said to be limitless.
Customer's behaviour:
In the study of lines, the customer's behaviour is equally crucial. A consumer is said to have baulked if he decides not to enter the queue because it is too long. A consumer is considered to have reneged if he joins the wait but then loses patience and leaves after a period. Customers are jockeying when there are two or more parallel lines, and they shift from one to the other.
Arrival Pattern:
The average rate at which consumers arrive, as well as the statistical pattern of arrival, is referred to as the input process. The following characteristics define an input source:
- Its size
- Arrival time distributions of the customers
- Customer behaviour
The probability distribution of the number of arrivals in an interv.al might reveal the statistical pattern of the arrival. This is a random variable with a discrete value. Alternatively, to determine the stochastic nature of the situation, the probability distribution of the time between two successive arrivals (known as interarrival time) can be analysed. This is a continuous variable. Analysis of historical data can be used to determine the probability distribution of the arrival pattern. The probability distribution for arrival could be (a.) Poisson, (b.) Exponential, or (c.) Erlang.
Service System:
The layout of service facilities and the allocation of service time define the service system. Service facilities can be set up with a single channel or numerous channels, and the service channels can be in series, parallel, or a combination of the two.
The time between the start and finish of a service is referred to as service time. The service time may be fixed or variable. Constant time, poison, exponential, and Erlang are examples of service time distributions.
Service Discipline:
There are two sorts of patterns for selecting a service from a pool of clients. The most typical arrangement is to arrange the clients in the order in which they arrive. The most common example is "First Come, First Served" (FCFS). Another technique is "Last in First Out" (LIFO). There may also be line-ups that give particular categories of clients’ priority. Pre-emptive priority and non-pre-emptive priority, for example.
Customer Behaviour:
- Balking - Arriving consumers are said to "baulk" if they refuse to join a line due to their aversion to waiting.
- Collusion – Customers may be working together. It makes sense that only one individual would enter the queue, but that he or she would demand service on behalf of other clients.
- Jockeying - in a multi-service centre, certain consumers continually switching from one queue to another, which is referred to as jockeying.
- Reneging - Customers who are impatient and refuse to wait longer than a particular amount of time is called to renege.
Queue:
Customers in a queue are those who are waiting for service. The consumers that are being served are not included in this. A queue is defined by its maximum allowable size, which might be finite or infinite. When the size of a queue is limited, it is said to be finite.
1. | Queue Length – Average number of customers in the queue waiting to get service |
2 | System Length – Average number of customers in the system those who are awaiting to be served and those who are being serviced. |
3 | Waiting time in the queue – average time a customer has to wait in the queue to get the service |
4 | Total time in the system – average time that a customer spends in the system, from entry in to the queue to completion of service |
5 | Service idle time – the relating frequency with which the service system is idle |
Notations
 = average arrival rate
µ= average service rate
 = average number of units in the queue.
 = average number of units in the system
 = average number of units in non-empty queue.
 = average waiting time an arrival spends in the system.
 = average waiting time an arrival spends in the queue.
 = average waiting time an arrival spends in a non-empty queue
 = probability of 'n' units in the system.
Under steady state conditions the following formulae will hold good:


Model 1. Single channel poison arrival with exponential service infinite population [M/M/1]: [FCFS/∞/∞]


Model 2. [M/M/K]: [FCFS/∞/∞]
 number of parallel channels


Model 3. [M/M/1]: [FCFS/∞/M]
M= Population size of arrival units


Model 4. [M/M/K]: [FCFS/∞/M]
K= no. Of parallel channels
M= Population size


Model 5. [M/EK/1.]: [FCFS/∞/∞]
 order of Erlangian distribution


Key Takeaway:
The study of waiting lines is known as queuing theory. It's one of the most well-known and widely utilised quantitative analysis methods. For most people, waiting in lines is a daily occurrence. Queues can also arise in corporate processes. Arrivals, service facilities, and the actual waiting line are the three essential components of a queuing process. Managers can use analytical models of waiting lines to assess the cost and effectiveness of service. Queuing is a powerful tool for anticipating and assessing system performance.
Customers visiting a store are equivalent to requests arriving at a device in traditional queuing theory problems.
In a queuing system, there are three key components.
1. Inputs or arrivals into the system. Population size, behaviour, and a statistical distribution are all aspects of these.
2. The waiting line itself, or queue discipline. The length of the wait, whether limited or limitless, as well as the discipline of the people or things in it, are all characteristics of the queue.
The service facility is number three. Its design and statistical distribution of service times are two of its distinguishing features. Arrival The input source that creates arrivals or customers has certain characteristics.
For a service system has three major characteristics:
- Size of the arrival population.
- Behaviour of arrivals.
- Pattern of arrivals (statistical distribution). Size of the Arrival (Source) Population
- Measuring the Performance of the Queue Queuing models assist managers in balancing service expenses with waiting-line charges. Many measurements of a waiting-line system's performance can be obtained via queueing analysis, including the following:
- Average time that each customer or object spends in the queue.
- Average queue length.
- Average time that each customer spends in the system (waiting time plus service time).
- Average number of customers in the system.
- Probability that the ·service facility will be idle.
- Utilization factor for the system.
- Probability of a specific number of customers in the system.
Model 1, a basic single-channel, single-phase system with Poisson arrivals and exponential service durations; Model 2, the multichannel version of Model l; Model 3, a constant-service-rate model; and Model 4, a limited-population system are the most extensively used queuing models.
Poisson arrivals, first-in, first-out service, and a single-service phase are all possible with all four models. We look at average time spent waiting in the line and system, average number of clients in the queue and system, idle time, and utilisation rate as examples of typical operating parameters. There are a variety of queuing models that do not require all of the assumptions of standard models to be met. We employ more advanced mathematical models, or a technique called simulation in these circumstances.
Solved example for Queuing
Q.1. A customer arrives every five minutes on average at a repair business, and the average service time is four minutes per customer. The time between arrivals follows a poisson distribution, but service times are exponentially dispersed. Calculate the queueing system's various characteristics (or parameters). This is a server with only one channel.
Solution: (a) Average number of arrivals per minute

And average number of customers served per minute

(b) Probability that the channel is busy 

(c) 
= 80 %
= 1- 0.8 = 2.0
i.e., the probability that the customer will get the service immediately  .
.
 Probability that the customer will have to stand alone


And so on.
(d) Expected number of customers in the system

(e) Average length of the queue

(f) Mean time the customer spends in the system

(g) The average time the customer spends in a queue

References:
- Industrial Engineering and Production Management by Martand T Telsang S. Chand Publishing
- Operations Research Theory & Applications by J K Sharma, Macmillan India Ltd,
- Automation, Production Systems & Computer Integrated Manufacturing by Groover, M.P. PHI
- Operations Research by P. K. Gupta and D. S. Hira, S. Chand & Co.
- Project Planning & Control by Koshy Varghese, Ph.D. Professor
- Building Technology & Construction Management Department of Civil Engineering I.I.T. Madras