UNIT 1
ELECTRON OPTICS AND X- RAYS
Positive rays
In 1897 J. J. Thomson discovered the electron. The electron is a tiny particle, almost two thousand times lighter than the hydrogen atom, and it is negatively charged.
Thomson referred to electrons as 'corpuscles'. They had previously been known as 'cathode rays' because in a vacuum tube they started at the negative electrical terminal called a cathode and moved away from it.
In 1907 Thomson began to investigate the rays that were moving towards the cathode. These rays were positively charged, and Thomson wanted to see if they were also composed of charged particles.
Canal Ray experiment is the experiment performed by German scientist Eugen Goldstein in 1886 that led to the discovery of the proton. Thus positive rays had first been observed by Goldstein in 1886.
In 1896 Goldstein noticed that when a discharge occurred in a tube of low-pressure gas rays appeared to be produced originating from the anode. These he called 'kanalstrahlen’ or sometimes known as canal rays. These rays are called positive rays.
The positive charge of the rays was not identified until sixteen years later when Wien deflected them in a magnetic field. They were much harder to deflect than cathode rays and were deflected in the opposite direction. This shows that they could be massive, positively charged particles.
Wien had used electric and magnetic fields to examine the positive rays. He found their maximum specific charge was around two thousand times smaller than that of the electron. This shows that they could be ionised hydrogen atoms.
Production
The discovery of proton which happened after the discovery of the electron further strengthened the structure of the atom.
- In the experiment, Goldstein applied high voltage across a discharge tube that had a perforated cathode.
- A faint luminous ray was seen extending from the holes in the back of the cathode.
- The apparatus of the experiment is the same apparatus as of cathode ray experiment.
- It is made up of a tube made of glass containing two pieces of metal ions at different ends.
- These metal pieces act as an electrode.
- The two metal pieces are connected with an external voltage.
- The pressure of the gas inside the tube is lowered by evacuating the air. The rays originated within the gas itself, none being produced if the tube
were evacuated.
|
Figure 1: Positive Rays-Production
Working
- Apparatus as setting up by providing a high voltage source and evacuating the air to maintain low pressure inside the tube.
- High voltage is passed to the two metal pieces to ionize the air and make it a conductor of electricity.
- The electricity starts flowing as the circuit was complete. The electrons emitted from the cathode collide with the gas atoms found in the tube, knocking one or two additional electrons out of each of these atoms. These collisions leave behind ions that are positively charged.
- When the voltage was increased to several thousand volts, a faint luminous ray was seen extending from the holes in the back of the cathode.
- When very high voltage is applied, it ionizes the gas and it is positive ions of gas that constitute the canal ray. It is actually the nucleus or kernel of the gas that was used in the tube and hence it has properties different from the cathode rays which were made up of electrons.
- The produced positive ions travel towards the cathode. Any of the positive ions pass through the perforations that create canal rays in the cathode disc. Both electric and magnetic fields deflect the channel rays in the same direction as the cathode rays.
- These rays were moving in the opposite direction of cathode rays and were named canal rays.
A discharge occurs in the low-pressure gas in the bulb at the left-hand end of the apparatus, producing positive rays that pass through the anode and into the right-hand end of the tube. Here they go through electric and magnetic fields that act in the Y-direction; the electric and magnetic forces on the particles are therefore at right angles to each other.
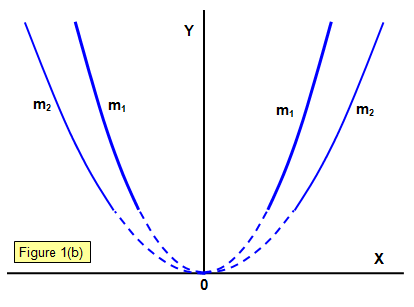
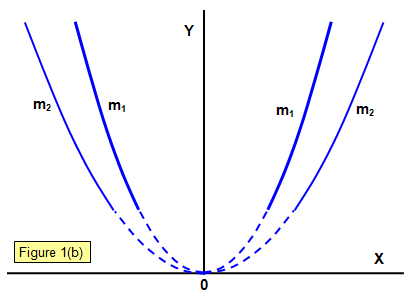
When the particles strike the fluorescent screen a parabola is produced by particles having different velocities, those with the highest velocities having originated closest to the anode (since an ion with zero velocity near the anode will have a longer distance over which to accelerate before it reaches the cathode if it makes no collisions on the way).
|
Figure 2: Two parabola are shown made by particles with different masses m1 and m2 (m1>m2).
It was assumed that the particles were gaseous ions of mass m and charge q. J. J. Thomson found that the value of q/m for the particles in the positive rays with hydrogen in the tube was of the order of 108 Ckg-1. This must mean that the particle that makes up positive rays has either a smaller charge than that of the electron or a much greater mass, and it is the latter that has been accepted.
Unlike cathode rays, canal rays depend upon the nature of gas present in the tube. It is because the canal rays are composed of positive ionized ions formed by ionization of gas present in the tube.
The charge to mass ratio for the particles of the ray was found to be different for different gases.
The behaviour of particles in an electric and magnetic field was opposite to that of cathode rays.
Some positively charged particles carry multiples of the fundamental value of the charge.
Properties
The positive rays showed the following properties:
- They are the streams of positive ions of the gas enclosed in the discharge tube.
- They could be deflected by electric and magnetic fields
- They showed a spectrum of velocities
- They were dependent on the gas in the tube
- They could cause ionisation
- They caused fluorescence and affected photographic plates.
- They travel in straight lines.
- The velocity of canal rays is much smaller than the velocity of cathode rays.
Key Takeaways
- Positive rays had first been observed by Goldstein in 1886. In 1896 Goldstein noticed that when a discharge occurred in a tube of low-pressure gas rays appeared to be produced originating from the anode. These rays are called positive rays.
- Positive rays are also known as canal rays.
- Positive rays are produced in a discharge tube that passes through the anode. Here they go through electric and magnetic fields. the electric and magnetic forces on the particles are therefore at right angles to each other.
- When the particles strike the fluorescent screen a parabola is produced by particles having different velocities, those with the highest velocities having originated closest to the anode.
- Positive rays could be deflected by electric and magnetic fields. They could cause ionisation, fluorescence, and affected photographic plates. They travel in straight lines and the velocity of canal rays is much smaller than the velocity of cathode rays.
J. J. Thomson first determined the specific charge (charge to mass ratio e/m) of the electron in 1887. For his work J. J. Thomson received the Nobel Prize in Physics in 1906, “in recognition of the great merits of his theoretical and experimental investigations on the conduction of electricity by gases”.
The specific charge is defined as the charge per unit mass of the particle. Thomson discovered that the value of (e/m) was independent of the gas used and also independent of the nature of the electrodes. Thomson discovered that the value of (e/m) was independent of the gas used and also independent of the nature of the electrodes.
The importance of the mass-to-charge ratio is that two particles with the same mass-to-charge ratio move in the same path in a vacuum when subjected to the same electric and magnetic fields.
PRINCIPLE
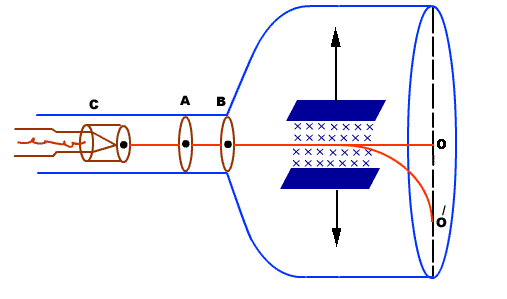
The fact that the cathode rays (electrons) are deflected by electric and magnetic fields is made use of in this method. When a narrow beam of charged particles is projected at a constant speed (v) across a magnetic field in a direction perpendicular to the field, the beam of particles experiences a force, which makes them move in a circular path.
CONSTRUCTION
- It consists of a highly evacuated glass tube, fitted with electrodes.
- Electrons are produced by heating a tungsten filament electrically.
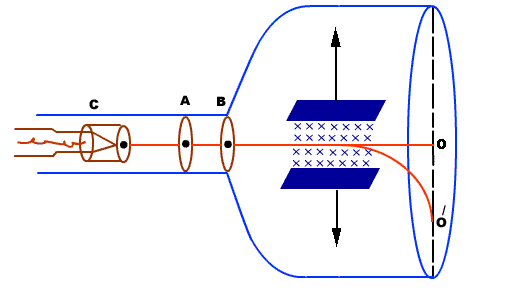
- Electrons are made to accelerate and form a beam by passing through discs A and B.
- They are passed through an electric and magnetic field. Finally, they fall on zinc sulphide screen
|
Figure 3: Thomson’s method
THEORY
Electrons moving sideways are also directed towards the screen by applying a negative potential on a hollow cylinder (c) open on both sides surrounding the filament. Electrons are accelerated by applying a potential difference of above 1000 V between the filament and disc A. A further potential difference of 500 V is applied between discs A and B. The arrangement focuses the beam to the hole of the disc B from where it is further proceeds to a straight line. When a beam of electrons enters a magnetic field it moves in a circular track. The force experienced by the electron is
Fm = evB ……. . (1)
This magnetic field provides necessary centripetal force to the electron so that it follows a circular path. We know Fc =mv2/r. We have
So Fm = Fc
evB =mv2/r
eB =mv/r
e/m =v/Br ……. . (2)
By knowing the values of v, B, and r, the value of e/m can be determined.
RADIUS OF CURVATURE OF PATH
|
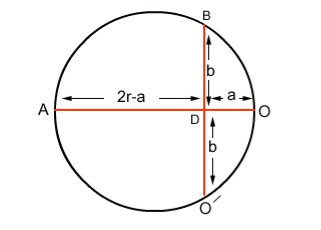
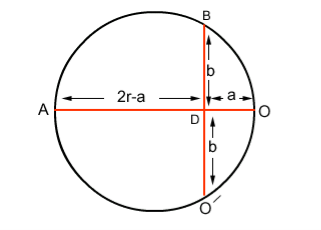
Figure 4: Radius of curvature of the path
If r is the radius of curvature of the circular path, ‘a’ is the distance b/w ‘O’ and ‘O/’, and ‘b’ is the distance b/w electron gun and screen then by using the property of chord:
AD x OD = BD x DO (2r-a) x a =b. b (2ra-a2) = b2 since 2r is very small as compared to a2 2ra = b2 r = b2/2a ……. . (3) |
DETERMINE VELOCITY BY the FIRST METHOD
The electrons are first accelerated by applying a potential (V) b/w discs A and B before entering the magnetic field.
K. E =Ve 1/2mv2 =Ve v= (2Ve/m)1/2 we know from eq (2) e/m =v/Br put value of v in eq (2) we get e/m = {(2Ve/m)1/2}/Br Squaring on both sides, we have e2/m2 = (2Ve/m)/B2r2 e/m = 2V/B2r2 ……. . (4) |
PARTICLE SELECTOR METHOD
This is a more accurate method as compared to the above method. In this method, the beam is passed through a crossed electric and magnetic field. The electric field is so adjusted that the light spot comes back to ‘O’ from ‘O/’. i. e. electron beam passes and straight without deflection.
Force on an electron by an electric field Fe=Ee Force on an electron by the magnetic field Fm= Bev Since both forces balance each other Fm = Fe Bev = Ee v = E/B ……. . (5) We know e/m =v/Br by eq (2), substituting v from the above equation (5) we have e/m = (E/B)/Br e/m = E/B2r ……. . (6) By knowing E, B, and r we can find the e/m ratio. |
Thus In his experiment, J. J. Thomson had found a charged particle that had a specific charge two thousand times that of the hydrogen ion, the lightest particle known at that time. Once the charge on the particles was measured he could conclude with certainty that these particles were two thousand times lighter than hydrogen. This explained how these particles could pass between atoms and make their way out of thin sheets of gold. Measurement of the specific charge of cathode rays for different metals made him conclude that the particles that constituted cathode rays form a part of all the atoms in the universe. The direct measurement of the mass of the electron is difficult by experiments. It is easier to determine the specific charge of the electron e/m from which the mass m can be calculated if the elementary charge e is known.
Key Takeaways
- The specific charge is defined as the charge per unit mass of the particle. Thomson discovered that the value of (e/m) was independent of the gas used and also independent of the nature of the electrodes.
- It is based on the principle that the cathode rays (electrons) are deflected by electric and magnetic fields.
- When a narrow beam of charged particles is projected at a constant speed (v) across a magnetic field in a direction perpendicular to the field, the beam of particles experiences a force, which makes them move in a circular path.
- The e/m ratio is given by
e/m = E/B2r
Bainbridge mass spectrometer is an instrument used for the accurate determination of atomic masses.
PRINCIPLE
Uniform magnetic field acting normal to the path of ions having the same velocity deflects the ions of different masses from a straight path to a circular path of different radii.
CONSTRUCTION
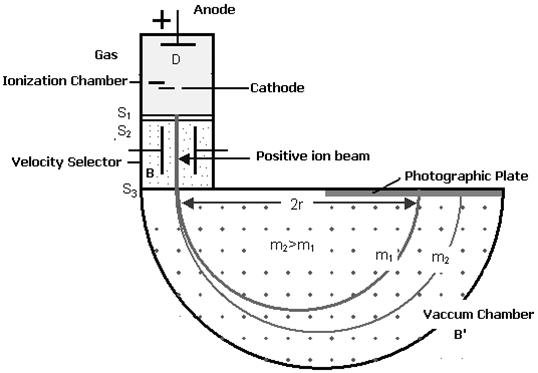
(i) Ionization Chamber
The ionization chamber is used to ionize the gas whose mass or isotope is to be determined and positive ions are produced.
(ii) Velocity Selector
Velocity selector has two fields electric and magnetic field both are applied perpendicular to the moving ion beam. A potential (V) is applied between two electrodes to produce the electric field. A magnetic field (strength B) is applied at right angles to the electrostatic field and so the electrostatic and electromagnetic forces act in opposite directions to each other. A velocity selector is used to produce a mono-velocity ion beam and a transverse magnetic field is employed to discriminate between ions of different masses.
(iii) Vacuum / Analyzing Chamber
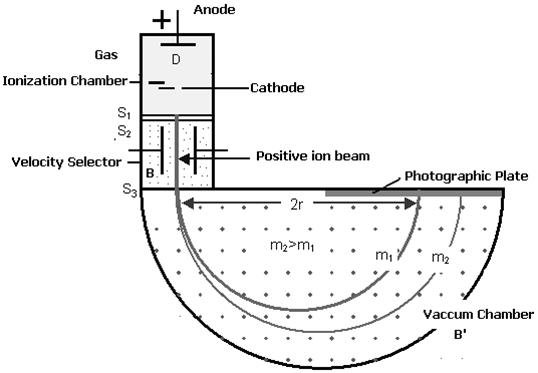
Vacuum / Analyzing Chamber is a semi-spherical cavity in which another magnetic field B’ is applied perpendicular to the moving positive ion.
|
Figure 5: Bainbridge Mass Spectrograph
WORKING
Atoms with one or more electrons removed have a net positive charge and they become positive ions. A beam of positive ions produced in a discharge tube is collimated into a fine beam by two narrow slits S1and S2. This fine beam enters into a velocity selector.
The velocity selector allows the ions of a particular velocity to come out of it, by the combined action of an electric and a magnetic field. The velocity selector consists of two plane-parallel plates P1 and P2, which produces a uniform electric field E and an electromagnet, to produce uniform magnetic field B (represented by the dotted circle). These two fields are at right angles to each other and to the direction of the beam.
The electric field and magnetic field are so adjusted that the deflection produced by one field is nullified by the other so that the ions do not suffer any deflection within the velocity selector.
Ions are formed in the ionization chamber and pass through the cathode, then through collimating slits S1 and S2. The beam is then passed through a velocity selector in which electric and magnetic fields are applied perpendicular to each other. The ion moves in a straight-line path for which both the forces acting on it are equal
Let E and B be the electric field intensity and magnetic induction respectively and q be the charge of the positive ion. The force exerted by the electric field is equal to qE and the force exerted by the magnetic field is equal to qvB where v is the velocity of the positive ion.
qE =qvB
The velocity of ion which passes undeflected through the velocity selector is
v = E/B
In the vacuum chamber, the ions are affected by the magnetic field (B’) alone and so move in circular paths, the lighter ions having the larger path radius. If the mass of an ion is M, its charge q, and its velocity v then
qvB’ =Mv2 /R
R =Mv/qB’
So the radius of the path is directly proportional to the mass of the ion i. e. R ∝ M
Further substitute the value of v
R =ME/qBB’ or M =RqBB’/E
Ions with different masses trace semi-circular paths of different radii and produce dark lines on the plate. The distance between the opening of the chamber and the position of the dark line gives the diameter 2R from which radius R can be calculated.
Since, B, B′, E, and R are known, the mass of the positive ions and hence isotopic masses can be calculated.
Key Takeaways
- Bainbridge mass spectrometer is an instrument used for the accurate determination of atomic masses.
- It is based on the principle of a uniform magnetic field acting normal to the path of ions having the same velocity deflects the ions of different masses from a straight path to a circular path of different radii.
- The radius of the path is directly proportional to the mass of the ion i.e. R ∝ M
- Since, B, B′, E, and R are known, the mass of the positive ions and hence isotopic masses can be calculated by using the formula M =RqBB’/E
The first mass spectrograph was designed by Cambridge scientist F W Aston (1877-1945). It could separate isotopes, which are chemically identical atoms with different masses. The spectrograph's globe contained a compound of the material to be tested and an electric current then knocked electrons from the material's atoms. Aston worked with J J Thomson (1856-1940) to show that over 50 elements were made up of atoms of different atomic masses but the same atomic numbers.
Mass Spectrograph
It is an instrument that is used to determine the mass of atoms or molecules in which a beam of a charged particle is passed through an electromagnetic field that separates particles of different masses. The result of the distribution of the spectrum is recorded on a photographic plate.
Components of Mass Spectrograph
1. Ion Source: - All mass spectrograph starts with an ion source to be detected. The ions are produced either by electron-bombardment of gases or by heating the suitably coated filaments.
2. Energy, Momentum, and Velocity Filter: The positive energy ions are given energies by accelerating them through a potential difference V so that their energy qV is much greater than initial ion energies. To have a beam of the same momentum and mass the ions are then passed through electric and magnetic fields which may act as momentum and velocity filters.
3. Evacuated Chamber:- This chamber is evacuated and provides the path to ion-beam to be detected. Usually, a strong magnetic field is applied perpendicular to the ion beam for its deflection to a circular path.
4. Detector: It may be a photographic plate or an electrometer. The typical Mass Spectrograph is Bainbridge’s, Aston’s, and Dempster’s Mass Spectrograph.
Now we will discuss Aston’s Mass Spectrograph in detail.
Aston’s Mass Spectrograph
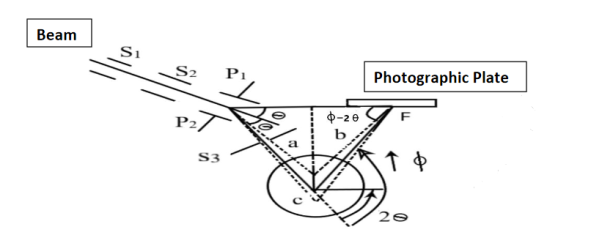
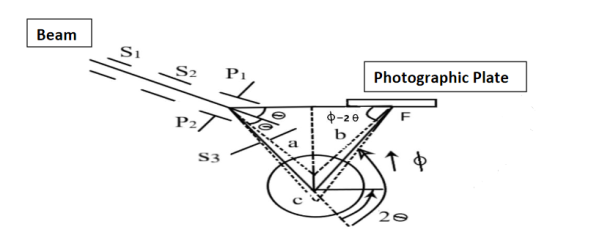
It uses electric and magnetic fields that are mutually perpendicular. The isotope beam is subjected perpendicular to the electric field. The apparatus is shown in figure (6) The given stream of positive ions is rendered into a fine beam by passing it between two narrow slits S1 and S2.
|
Figure 6: Experimental setup for Aston’s Mass Spectrograph
This beam enters the electric field of strength (E) between metal plates P1 and P2. Due to the action of the electric field, all positive ions having the same value of specific charge (q+/M) (where q+ is a positive charge on ion and M is its mass) are not only deflected by an angle 𝜃 from the original path towards negative plate but are also dispersed by an angle d𝜃 due to their different velocities. The beam is then allowed to pass through slit S3 and enter a magnetic field of strength B arranged perpendicular to the electric field to deflect the beam in opposite direction and converge it to a single point F on a photographic plate. The magnetic field deviates the beam through an angle ∅and reconverges them by an angle d∅.
Theory
Condition for Focussing:
Consider a beam of ions having the same value of q+/M but moving with different velocities. Let 𝜃 and ∅ be the mean angles of deviation of the beam in electric and magnetic fields in opposite directions. Let d𝜃 be the dispersion angle due to the electric field and d∅ be the convergence angle due to the magnetic field. Let v be the velocity of an ion, L1 the length of the electric field, and l1 the transverse displacement of an ion from its path due to electric field,
Then acceleration of ion, a1=(q+E/M) and Time by ion to transverse electric field =L1/v Transverse deflection in an electric field,
Angular deviation of the ion beam,
The angle of dispersion of beam in an electric field,
If l1 is the transverse deflection of an ion beam in the magnetic field of strength L2, then in a similar manner,
(since the acceleration of ion in magnetic field B is a2 =(q+vB/M) The deviation produced by the magnetic field is in the opposite direction
Convergence d∅
Comparing eqn. (1) and eqn. (2) we get,
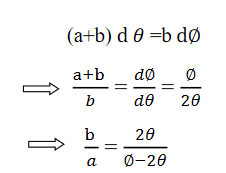
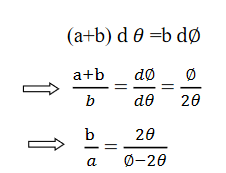
Let a=OC=distance between two fields, Then the width of the ion at C= ad𝜃 Let CF=b=distance of magnetic field and photo-plate. If there had been no magnetic field, the width of the ion beam after traveling a further distance b would have been =(a+b) d𝜃 Therefore magnetic field produces convergence d∅ in a distance b. Thus the width of converged beam= bd∅ Thus the condition of focussing becomes:
|
This gives the distance at which the photographic plate should be placed to record the beam and also the deflection caused by the magnetic field as compared to the electric field.
Detection of isotopes: To determine the masses of isotopes of an element, the element is mixed with a number of other elements of known atomic masses. The traces of all of them are obtained on the same photographic plate. The distance of the traces of known masses is measured from a given reference point on the plate. A calibration curve is then drawn between known atomic masses and the distance of traces from a given point. By measuring the distances of the traces of isotopes of elements from the same reference points, the atomic masses are obtained from the calibration curve.
Advantages:
1. All particles having the same (q+/M) are focusing on a single point of photographic plate unlike, Thomson’s method where they spread out in the form of a parabola. Hence lines on photographic plates in Thomson’s arrangement are feeble.
2. The intensity of a line obtained on a photo-plate is proportional to the total no. of particles of the mass. Thus the relative intensities of various lines give the idea of the relative abundance of different isotopes of an element.
Key Takeaways
- Mass Spectrograph is an instrument that is used to determine the mass of atoms or molecules in which a beam of a charged particle is passed through an electromagnetic field that separates particles of different masses.
- Aston’s Mass Spectrograph uses electric and magnetic fields that are mutually perpendicular. The isotope beam is subjected perpendicular to the electric field.
- Condition of focussing
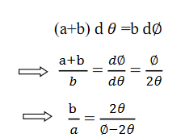
4. This gives the distance at which the photographic plate should be placed to record the beam and also the deflection caused by the magnetic field as compared to the electric field.
The motion of an electron beam in a non-uniform electric field can be understood by studying Bethe’s law. The non-uniform electric field is a field in which electric intensity varies from point to point and field lines are not straight and evenly spaced. Electron motion in a non-uniform electric field is better understood with the help of equipotential surfaces.
Equipotential surfaces are those surfaces where electric potential remains constant and electric lines are perpendicular to the surface at any point. Therefore the normal to the equipotential surface shows the line of action of the electric force on the electron.
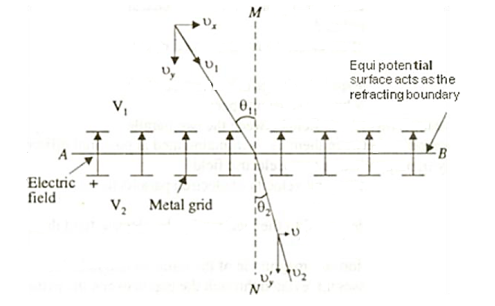
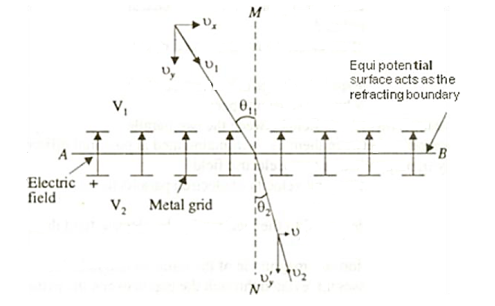
Let us consider a uniform electric field produced in an infinitesimally thin region. This uniform electric field is set up by two metal plates charged to appropriate potentials. The electrons are allowed to pass through the electric field being set up by two closely spaced metal grids as shown in the figure.
|
Figure 7: Electron Refraction
Consider an equipotential surface AB. It is considered as the boundary across which the potential V1abruptly changes to V2. Let electron travel through the region-I with a uniform velocity v1 and enter the region-II and moves with a velocity v2.
As the electrons pass through equipotential surface AB it experiences a force that alters its velocity. Because the electric field exists only in the vertical direction (Y-direction). Hence the normal component of electron velocity vy changes whereas the tangential component vx remains constant.
If V2 >V1, vy increases, and if V2<V1, vy decreases. In the above figure, V2 > V1i. e. V2 is taken to be greater than V1and hence vy increases. The electron path is, therefore, bent nearer to the surface normal. As the tangential component of the velocity remains constant in region-I and region-II we can write, vx = vy
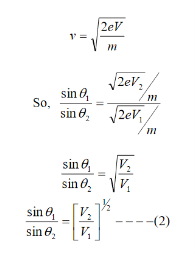
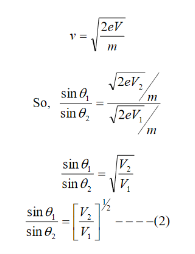
The velocity of the electron in terms of potential is given by
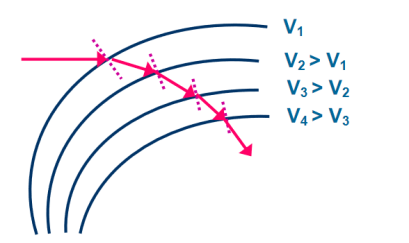
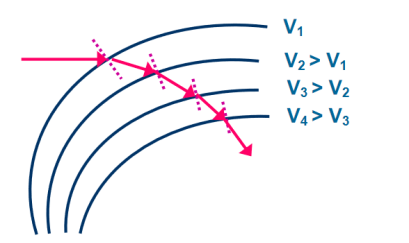
Equation (2) is similar to Snell’s law of refraction in optics and is known as Bethe’s law for electron refraction. When light enters from rarer to the denser medium it gets slowed down and bends towards the normal. However, when electrons are moving from the region of lower potential to a region of higher potential gets accelerated and bends toward the normal. Eqn. (2) can be extended to any arbitrary electrostatic field which is non-uniform. The figure demonstrates the motion of an electron in a non-uniform electric field represented by equipotential surfaces separating equipotential regions of potentials V1, V2, V3, V4, etc.
|
Figure 8: Electron Refraction in a Non -uniform Electric
At each surface electron path bends towards or away from the higher or lower potential region. It is seen that the electron motion occurs along a curved path in a non-uniform electric field.
Comparison between Snell’s Law and Bethe’s Law
Snell’s Law | Bethe’s Law |
1. It deals with the refraction of light. | 1. It deals with the refraction of electrons. |
2. A light entering from a rarer medium to a denser medium bends towards the normal. | 2. An electron entering from a region of low potential to high potential bends toward the normal (i. e. bends toward the direction of the electric field). |
3. A light entering from a rarer medium to a denser medium decreases in velocity. | 3. An electron entering from a region of low potential to a region of high potential increases in velocity. |
|
|
Key Takeaways
- The motion of an electron beam in a non-uniform electric field can be understood by studying Bethe’s law.
- It is similar to Snell’s law of refraction in optics
- However, when electrons are moving from the region of lower potential to a region of higher potential gets accelerated and bends toward the normal.
- Mathematically Bethe’s law is given by
 =
= 
- It is seen that the electron motion occurs along a curved path in a non-uniform electric field.
(CRO) Cathode Ray Oscilloscope
Cathode Ray Oscilloscope is a very important electronic measuring instrument that is used to display and measure electrical signals, time intervals, and phase shift between two electrical signals. Non-electrical quantities such as pressure, strain, and temperature can be measured by first converting them into an equivalent voltage using an appropriate transducer.
Any CRO consists of the following seven major sections
i) Cathode Ray Tube (CRT)
ii) Timebase circuits
iii) Trigger circuits
iv) Vertical Circuits
v) Horizontal Circuits
vi) High Voltage Power Supply
vii) Low Voltage Power Supply
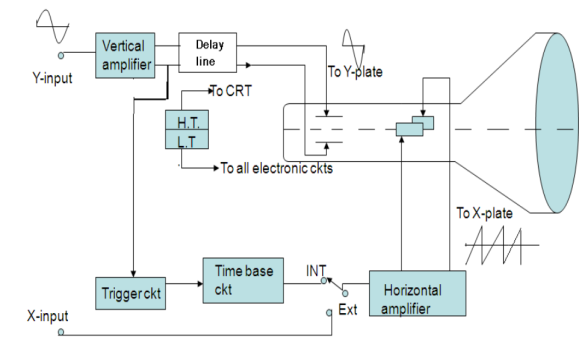
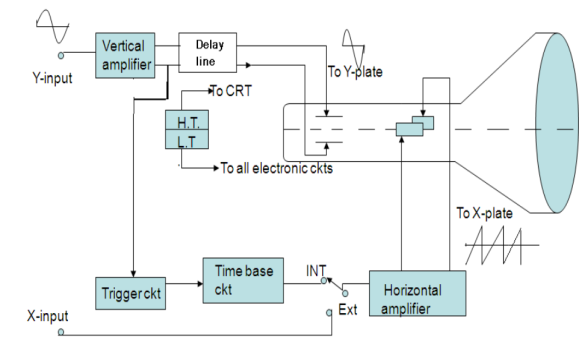
The arrangement of these sections in a CRO is shown in fig in the form of a Block diagram.
|
Figure 9: Block diagram of CRO
CATHODE RAY TUBE (CRT)
A cathode-ray tube with electrostatic deflection forms the central part of a CRO. The CRT generates the electron beam, focuses it, and accelerates it towards the fluorescent screen.
The rest of the sections are electronic circuits that cause the desired movement of a luminous spot on the screen. In its action, the electron beam is similar to a pen. It writes on the fluorescent screen in the form of a bright trace. Writing on paper involves two motions i. e. horizontal motion of the pen sweeping across the page and other is vertical motion of the pen indicating the message. The electron beam should be made to move both horizontally and vertically. A transparent graph called graticule marked in centimeter lines (divisions) both vertically and horizontally is attached to the face of the CRT for making measurements. When a signal is to be displayed, it is applied to the Y-plates of CRO by connecting it to the Y input of CRO.
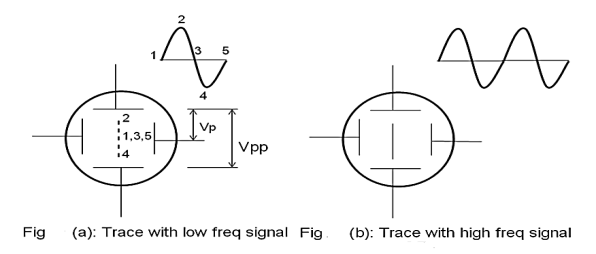
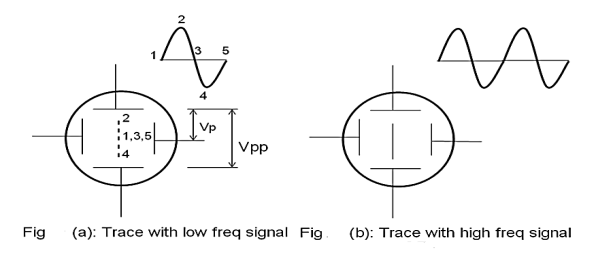
For example, let the signal be a simple harmonic wave. Because of the application of the signal to the Y plates, the luminous spot moves up and down on the screen at the same frequency as that of the applied voltage. The successive positions of the spot can be seen as shown in fig. 10(a)., when the frequency of the signal is less than about 20 Hz. At higher frequencies, the path of the beam is seen as a vertical line (fig 10b). This is due to the persistence of vision and the fluorescence of the coating. The luminous line is called a trace. The length of the vertical trace corresponds to the peak to the peak value of applied voltage.
|
Figure 10: (a) Trace with low-frequency signal (b) Trace with a high-frequency signal
II) TIME BASE CIRCUIT
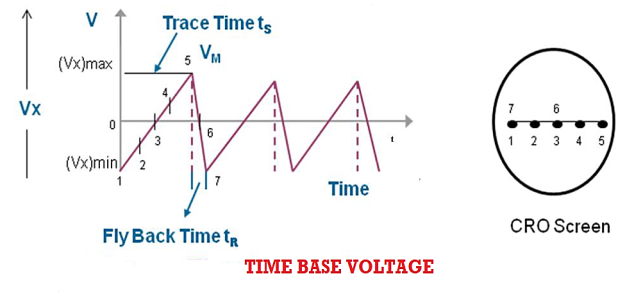
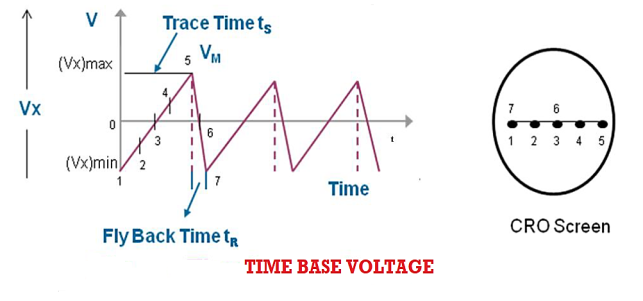
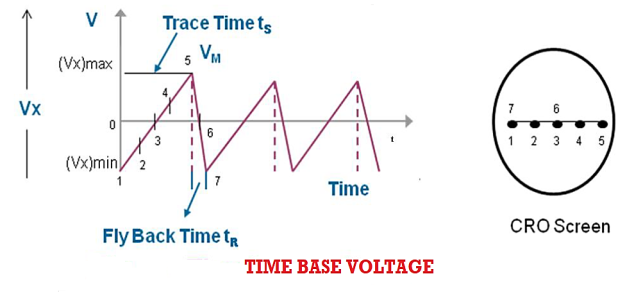
The faithful display of the signal variation by the electron beam requires the beam to move horizontally at a uniform rate across the screen, covering equal distances in equal intervals of time. This condition is satisfied by ramp voltage or saw tooth voltage. The ramp voltage is generated by Time Base Circuit.
The time base circuit consists of a time base generator. The time base generator is a variable frequency oscillator that produces an output voltage of sawtooth shape.
|
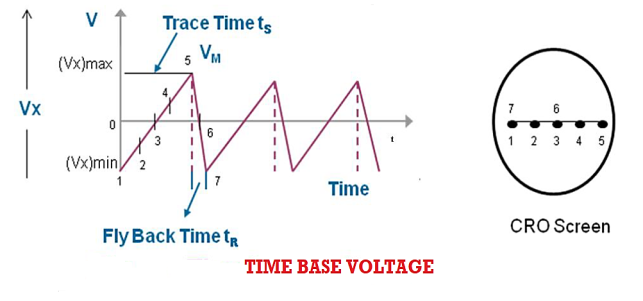
Figure 11: Timebase voltage
To obtain a visual display of the waveform of applied voltage, it is necessary to apply this A. C. voltage to one set of the deflection plates say Y-plates, and the other time base voltage or ramp voltage, generated by time base generator, to X-plates.
This time base voltage is periodic and its frequency can be varied. This voltage increases linearly with time and after reaching a maximum value (Vx)max, it suddenly drops to minimum value (Vx)min. When this voltage is applied to the horizontal deflection plates, the luminous spot sweeps the face of the screen at a uniform velocity from the left edge to the right edge depending on the polarity of the voltage. Because of this reason ramp voltage is also called sweep voltage. The deflection of the spot becomes maximum when the voltage reaches the value (Vx)max after which the spot suddenly returns to its original position. If the frequency of the time base voltage is sufficiently high the trace of the spot appears as a straight line.
Due to the resemblance of sweep voltage to teeth of a saw, it is also called saw-tooth voltage.
Sweep Time or Trace Time (ts):
The time taken by the sweep voltage to rise from its maximum negative voltage to its maximum positive voltage is called sweep time or a trace time tS.
Retrace Time or Flyback Time (tr):
The time taken by the sweep voltage to dip from its maximum positive voltage to its maximum negative voltage is called retrace time or fly back time tR.
Sweep Period (Tsweep):
The sum of sweep time and retrace time constitutes the sweep period Tsweep.
Tsweep= ts+ tr ≈ ts
Blanking:
The retrace path, if seen on the screen, gives a bad visual effect. By making the retrace time equal to zero, the retrace path can be eliminated. The trace during the flyback time or retrace time can be made invisible by applying a high negative voltage pulse to the control grid in the electron gun which turns off the electron beam momentarily. The process of making a retrace path invisible is known as Blanking of the trace.
Display of the signal shape:
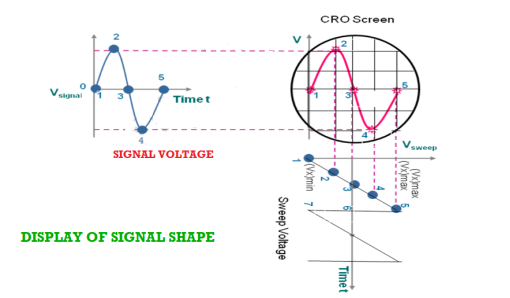
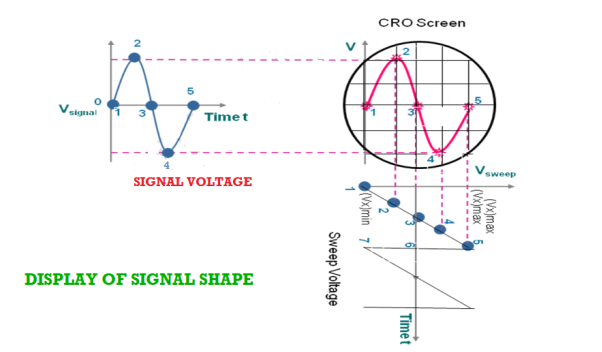
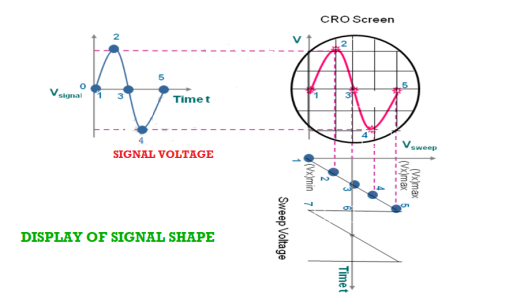
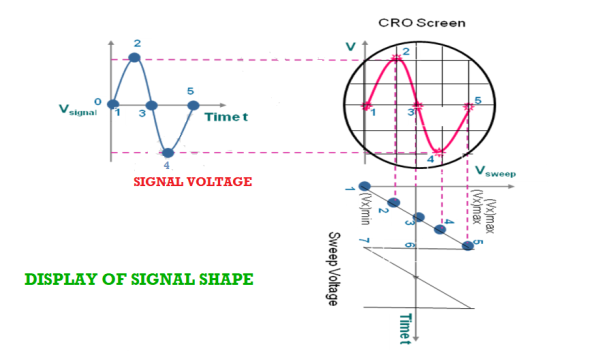
As the signal is applied to the Y-plates and time base voltage (sweep voltage) to the X-plates, the electron beam is simultaneously subjected to two forces acting in a perpendicular direction. The deflection of the beam at any instant is determined by the resultant of these two forces. Referring to the below fig it is seen that
|
Figure 12: Display of signal shape
- At any instant 1, the input signal (signal voltage) is zero and sweep voltage is (Vx)min, the resultant of the forces due to them acts along the left direction and the beam is deflected to the left extreme.
- At instant 2, the signal amplitude is positive and the sweep voltage is at a lesser negative value. The beam is deflected left upward in the second quadrant of the screen.
- At instant 3, both the input and sweep voltages are zero. The resultant force is zero and the beam stays at the centre of the screen.
- At instant 4, the signal amplitude is negative and the sweep voltage is positive. The beam is deflected to right down in the fourth quadrant of the screen.
- At instant 5, the signal voltage is zero, and the sweep voltage is (vx)max, the electron beam is deflected toward the right extreme along the horizontal direction. Then the beam returns to position 1 and the process repeats.
- By joining the resultant positions of the spot, it is seen that waveform of the input voltage is faithfully displayed.
III) TRIGGER CIRCUIT
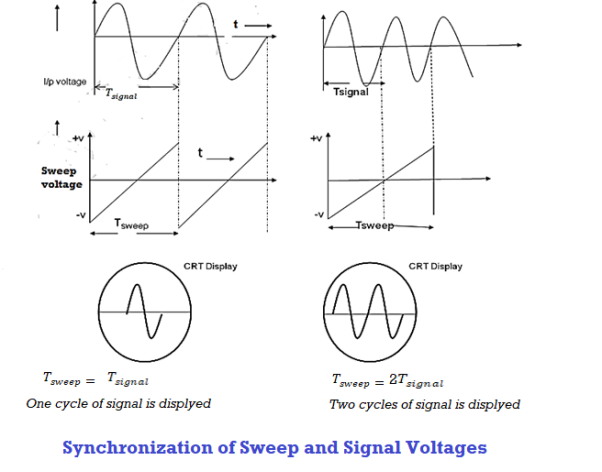
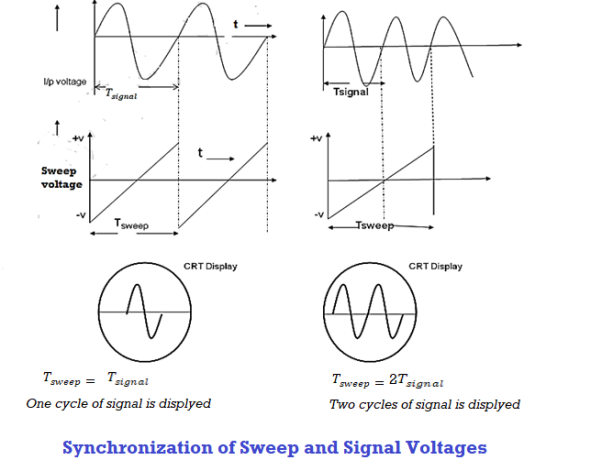
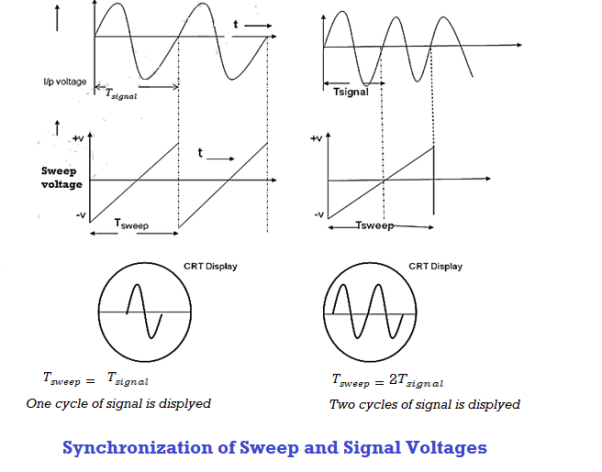
To display a stationary wave pattern on the CRO screen, the horizontal deflection should start at the same point of the input signal in each sweep cycle. When it occurs it is said that the horizontal sweep voltage is synchronized with the input signal. If the sweep and signal voltages are not synchronized a standstill pattern is not displayed on the screen; the wave pattern moves continuously to the right or left of the screen.
Thus synchronization is the method of locking the frequency of the time base generator to the frequency of the input signal so that a stationary display of wave pattern is seen on the CRO screen. The signal will be properly synchronized only when its frequency equals the sweep frequency or submultiple of sweep frequency. That is
fsignal = n fsweep
 =
= 
 =
= 
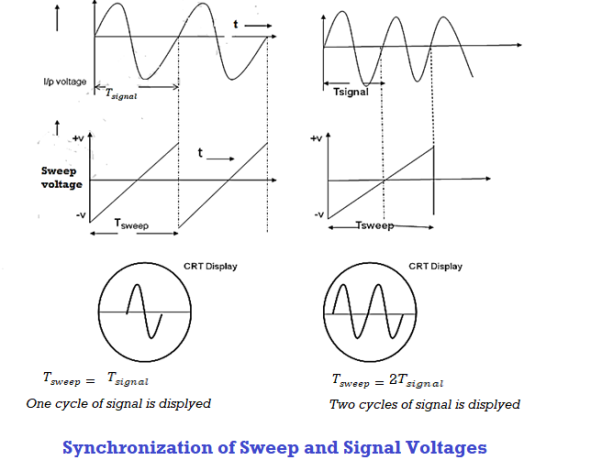
As an example, if the sweep frequency is 50Hz and the signal frequency is 50Hz, one wave is displayed on the screen. On the other hand, if the sweep frequency is 50Hz and the signal frequency is 100Hz, the period of sweep voltage is 20ms, and the period of the signal is 10ms.
In the sweep time which is horizontal trace length, the signal goes through two complete cycles. As a result, the two cycles of the signal voltage are displayed on the screen.
|
Figure 13: Synchronization of sweep and signal voltages
One of the methods of achieving synchronization is the use of a trigger circuit. The trigger circuit initiates the time base so that the horizontal deflection sweeps in synchronization with the vertical signal. For this, a delay line circuit is used which delays the signal before it reaches y-deflecting plates. A part of the output obtained from the vertical amplifier is fed to the trigger generator.
The trigger generator is sensitive to the level of the voltage applied at its input. The circuit monitors the input signal and detects the point when it reaches the selected level while moving towards the selected polarity. When the predetermined level is reached the circuit produces a trigger pulse. This trigger pulse is fed to the time base generator and it acts as a command signal to the time base generator and starts one sweep cycle of the time base.
The sweep voltage is not developed in the trigger mode if the input signal is not given. A portion of the trigger pulse is fed to a second circuit, which produces an unblanking bias voltage to bring the grid of CRT to a potential, which allows the electron beam to appear. Thus a stationary display of the wave is seen only above a predetermined level of the input voltage. It happens in each cycle. Because the signal voltage is initiating the sweep cycle, both voltages will be synchronized. By proper adjustment of controls, the trigger pulse may be made to originate when the input signal is going positive or negative or at any particular voltage level. However, in AUTO trigger mode the trigger circuit will automatically provide a trigger pulse to the sweep generator even when the input signal is not applied to it and the horizontal trace is seen even without signal at Y-input.
IV) VERTICAL CIRCUITS:
The vertical circuits mainly consist of an attenuator and a voltage amplifier. The signal is applied at the Y-input. It goes to the input of the attenuator. The signal amplitude is increased or decreased by changing the amount of attenuation and then fed to the input of the voltage amplifier so that adequate deflection is obtained on the screen.
V) HORIZONTAL CIRCUITS:
The sweep generator output cannot directly drive the horizontal plates. Therefore it must be initially amplified. The horizontal circuits mainly consist of a voltage amplifier. When the sweep selector switch is in the ‘INT’ position, the sweep voltage is applied to the horizontal amplifier. The output of the amplifier is fed to the X-plates and a linear trace is produced on the CRO screen. When the sweep selector switch is held in the ’EXT’ position the horizontal amplifier input is disconnected from the internal sweep generator and is instead connected to the horizontal input jack. In this position, the electron beam remains stationary and produces a luminous spot on the CRO screen.
VI) LOW VOLTAGE POWER SUPPLY
The low voltage power supply powers the electronic circuits such as amplifiers, time base generator, trigger circuit. It gives an output of the order of few tens to a few hundreds of volts.
VII) HIGH VOLTAGE POWER SUPPLY
The high voltage power supply provides voltages to anodes in the electron gun assembly. It supplies voltages of the order of 1600V to 2200V.
DELAY LINE
All electronic circuitry in the CRO causes a certain amount of time delay in the transmission of signal voltages to the deflection plates. Comparing the vertical and horizontal circuits in the CRO block diagram, we obtain that a portion of the output signal applied to the vertical CRT plates triggers the horizontal signal. Signal processing in the horizontal circuit consists of generating a trigger pulse that starts the time base generator (sweep generator) then the output of this is given to the horizontal amplifier and then to the horizontal plates. This whole process takes time. The signal of the vertical CRT plates must therefore be delayed by the same amount of time to reach the signal at the same instant as that of a horizontal one. This is the function of the delay line.
Key Takeaways
- Cathode Ray Oscilloscope is a very important electronic measuring instrument that is used to display and measure electrical signals, time intervals, and phase shift between two electrical signals.
- Non-electrical quantities such as pressure, strain, and temperature can be measured by first converting them into an equivalent voltage using an appropriate transducer.
- Any CRO consists of the following seven major sections - Cathode Ray Tube (CRT), Timebase circuits, Trigger circuits, Vertical Circuits, Horizontal Circuits, High Voltage Power Supply, Low Voltage Power Supply
- The Delay line is because the electronic circuitry in the CRO causes a certain amount of time delay in the transmission of signal voltages to the deflection plates.
CRT (Cathode Ray Tube):
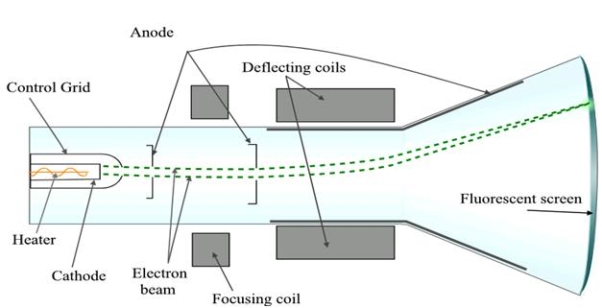
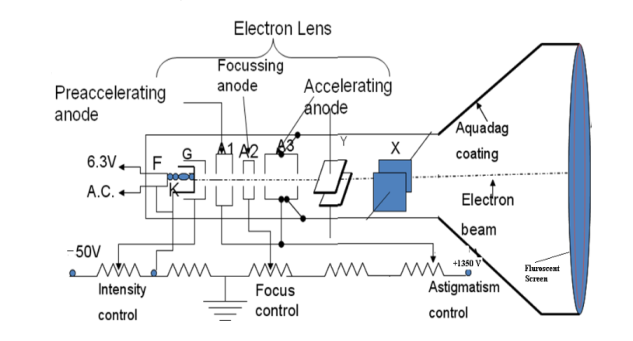
A Cathode Ray Tube (CRT) is a specially constructed vacuum tube in which an electron beam controlled by electric or magnetic fields generates a visual display of input electrical signals on a fluorescent screen.
Construction
It consists of three important parts,
i) Electron Gun
ii) Deflection System
iii) Fluorescent Screen
|
Figure 14: CRT (Cathode Ray Tube)
The CRT resembles a horizontally placed conical flask sealed at its open end.
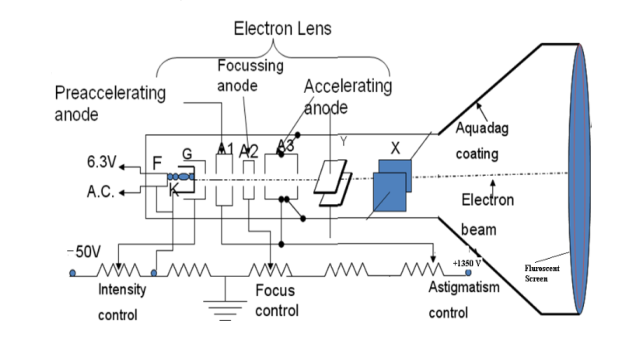
The electron gun consisting of several electrodes is mounted at one end of the tube as a single unit and electrical connections are given to them through base pins. The deflection system consists of two pairs of parallel metal plates mounted in the neck of the tube. They are oriented in such a way that they are in mutually perpendicular directions to the axis of the CRT. The screen consists of a thin coating of phosphors deposited on the inner face of the wide end of the glass envelope. The inner surface of the flare of the envelope is coated with conductive graphite called acquadag. A power supply provides the required potentials to the various elements of CRT.
Working
In the CRT, the electron gun generates an electron beam, focuses it, and accelerates it towards a fluorescent screen located at the further end of the tube. The electron beam may be moved to any spot on the screen with the help of a deflection system.
I) Electron Gun: The indirectly heated cathode K emits a stream of electrons from its coated front face. The electrons pass through the control grid G held at a negative potential. The effective size of the aperture in the grid varies depending upon the potential difference between grid and cathode. The intensity of the glow produced at the screen is determined by the number of electrons striking the screen. Therefore by varying the negative dc voltage on the grid, the intensity of the luminous spot on the screen is controlled. The grid bias is usually varied between 0 to -50V. The anodes A1 and A3 are internally connected and held at a higher positive potential of a few kilovolts and A2 is maintained at a relatively low positive potential. The anode A1 accelerates the incoming electrons. The Grid G and anode A1 forms the first lens system which prefocusses the electron beam. The anode A2 and A3 constitute the second lens system which focuses the electron beam to a fine point on the fluorescent screen. The focus of the beam is adjusted by varying the positive potential on A2. The anode A3 imparts further acceleration to the electrons as they emerge out of the electron gun.
II) Deflection System: There are two types of deflection system namely electrostatic type and electromagnetic type.
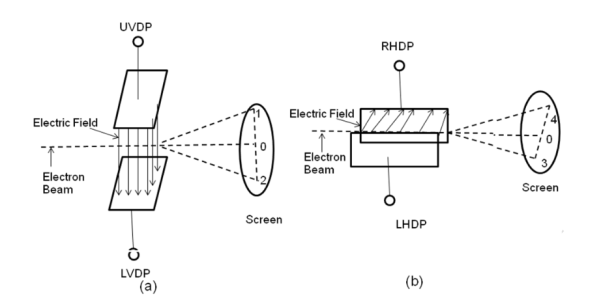
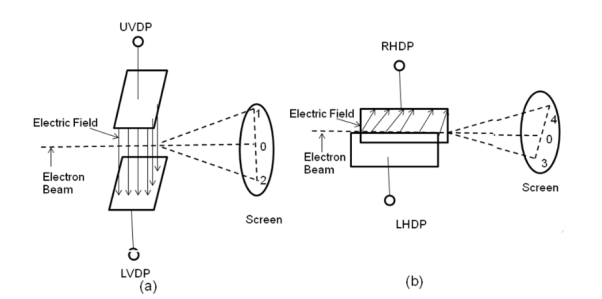
In the electrostatic deflection system, two pairs of metal plates are employed for deflecting the electron beam. The two plates in each pair are aligned strictly parallel to each other as shown in the figure and the two pairs of plates are mounted at right angles to each other and also at right angles to the path of electrons.
One pair of plates is arranged horizontally. When a potential difference is applied to the plates then the uniform electric field is produced in the vertical direction. The fields act perpendicular to the beam and deflect the beam vertically, so these are called vertical deflecting plates or Y-plates.
The second set of plates is oriented vertically and produces a uniform horizontal field when a potential difference is applied between them. The field acts normal to the beam and deflects the beam horizontally so this set of plates is called horizontal deflection plates or X-plates.
|
Figure 15: Electron beam deflection (a) Vertical deflection (b) Horizontal Deflection
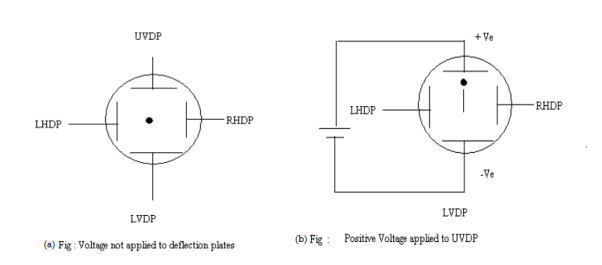
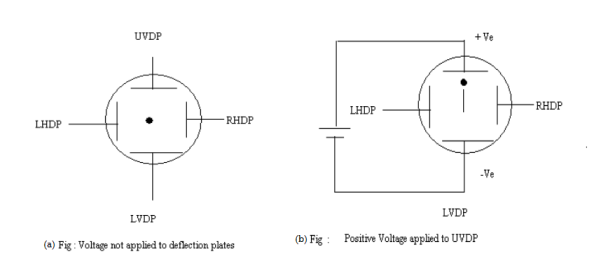
When voltages are not applied to X-plates and Y-plates, the electron beam travels along the CRT axis and strikes the geometrical centre of the viewing screen. When a dc voltage is applied to Y-plates, the electron beam gets deflected vertically and when a dc voltage is applied to the X-plates, the electron beam is deflected horizontally as shown in figures. The amount of deflection depends on the magnitude of the applied voltage. When dc voltages are applied to both the X and Y plates, the electron beam will be acted upon simultaneously by two forces due to vertical and horizontal electric fields and gets deflected along the direction of their resultant is shown in fig. Thus by varying the dc voltages of the vertical and horizontal planes, the luminous spot may be moved to any position in the plane of the screen.
|
Figure 16 (a) Voltage not applied to deflection plates (b) Positive voltage applied to UVDP
III) Fluorescent Screen: The interior surface of the circular front face of the CRT is coated with a thin translucent layer of phosphors. The phosphor coating glows at the point where it is struck by the high energy electron beam. At that spot, the coating continues to glow for a short period even after the electron beam moves away. So electron beam position can be located with the help of a fluorescent screen.
Aquadag Coating
Electrons impinging on the screen tend to charge it negatively and repel the electrons arriving afterward it will reduce the number of electrons reaching the screen leading to a decrease in the brightness of the glow. Therefore the electrons are to be conducted away. Similarly, the cathode assumes gradually a positive charge as electrons are emitted from it in large numbers. It again leads to a reduction in the intensity of the glow on the screen. Therefore the cathode is to be replenished with electrons. This is accomplished by the Aquadag coating. The inner surface of the flare of the glass envelope of CRT is coated with conductive graphite coating called Aquadag. It is used to complete the circuit from screen to cathode. The electrons striking the fluorescent screen not only causes the emission of light but also produce secondary emission of electrons. The secondary electrons are attracted by the Aquadag coating which is electrically connected to anode A3. The electrons are restricted to the cathode through the ground.
The electrostatic CRT is used in CRO as a display device and study of waveforms.
Key Takeaways
- The electrostatic CRT is used in CRO as a display device and study of waveforms.
- A Cathode Ray Tube (CRT) is a specially constructed vacuum tube in which an electron beam controlled by electric or magnetic fields generates a visual display of input electrical signals on a fluorescent screen.
- It consists of three important parts: Electron Gun, Deflection System, Fluorescent Screen
TIME BASE CIRCUIT
The faithful display of the signal variation by the electron beam requires the beam to move horizontally at a uniform rate across the screen, covering equal distances in equal intervals of time. This condition is satisfied by ramp voltage or saw tooth voltage. The ramp voltage is generated by Time Base Circuit.
The time base circuit consists of a time base generator. The time base generator is a variable frequency oscillator that produces an output voltage of sawtooth shape.
|
Figure 17: Time Base Voltage
To obtain a visual display of the waveform of applied voltage, it is necessary to apply this A. C. voltage to one set of the deflection plates say Y-plates, and the other time base voltage or ramp voltage, generated by time base generator, to X-plates.
This time base voltage is periodic in nature and its frequency can be varied. This voltage increases linearly with time and after reaching a maximum value (Vx)max, it suddenly drops to minimum value (Vx)min. When this voltage is applied to the horizontal deflection plates, the luminous spot sweeps the face of the screen at a uniform velocity from the left edge to the right edge depending on the polarity of the voltage. Because of this reason ramp voltage is also called sweep voltage. The deflection of the spot becomes maximum when the voltage reaches the value (Vx)max after which the spot suddenly returns to its original position. If the frequency of the time base voltage is sufficiently high the trace of the spot appears as a straight line.
Due to the resemblance of sweep voltage to teeth of a saw, it is also called saw-tooth voltage.
Sweep Time or Trace Time (ts):
The time taken by the sweep voltage to rise from its maximum negative voltage to its maximum positive voltage is called sweep time or a trace time tS.
Retrace Time or Flyback Time (tr):
The time taken by the sweep voltage to dip from its maximum positive voltage to its maximum negative voltage is called retrace time or fly back time tR.
Sweep Period (Tsweep):
The sum of sweep time and retrace time constitutes the sweep period Tsweep.
Tsweep= ts+ tr ≈ ts
Blanking:
The retrace path, if seen on the screen, gives a bad visual effect. By making the retrace time equal to zero, the retrace path can be eliminated. The trace during the flyback time or retrace time can be made invisible by applying a high negative voltage pulse to the control grid in the electron gun which turns off the electron beam momentarily. The process of making a retrace path invisible is known as Blanking of the trace.
Display of the signal shape:
As the signal is applied to the Y-plates and time base voltage (sweep voltage) to the X-plates, the electron beam is simultaneously subjected to two forces acting in a perpendicular direction. The deflection of the beam at any instant is determined by the resultant of these two forces. Referring to the below fig it is seen that
|
Figure 18: Display of signal shape
- At any instant 1, the input signal (signal voltage) is zero and sweep voltage is (Vx)min, the resultant of the forces due to them acts along the left direction and the beam is deflected to the left extreme.
- At instant 2, the signal amplitude is positive and the sweep voltage is at a lesser negative value. The beam is deflected left upward in the second quadrant of the screen.
- At instant 3, both the input and sweep voltages are zero. The resultant force is zero and the beam stays at the centre of the screen.
- At instant 4, the signal amplitude is negative and the sweep voltage is positive. The beam is deflected to right down in the fourth quadrant of the screen.
- At instant 5, the signal voltage is zero, and the sweep voltage is (vx)max, the electron beam is deflected toward the right extreme along the horizontal direction. Then the beam returns to position 1 and the process repeats.
- By joining the resultant positions of the spot, it is seen that waveform of the input voltage is faithfully displayed.
TRIGGER CIRCUIT
To display a stationary wave pattern on the CRO screen, the horizontal deflection should start at the same point of the input signal in each sweep cycle. When it occurs it is said that the horizontal sweep voltage is synchronized with the input signal. If the sweep and signal voltages are not synchronized a standstill pattern is not displayed on the screen; the wave pattern moves continuously to the right or left of the screen.
Thus synchronization is the method of locking the frequency of the time base generator to the frequency of the input signal so that a stationary display of wave pattern is seen on the CRO screen. The signal will be properly synchronized only when its frequency equals the sweep frequency or submultiple of sweep frequency. That is
fsignal = n fsweep
 =
= 
 =
= 
As an example, if the sweep frequency is 50Hz and the signal frequency is 50Hz, one wave is displayed on the screen. On the other hand, if the sweep frequency is 50Hz and the signal frequency is 100Hz, the period of sweep voltage is 20ms, and the period of the signal is 10ms.
In the sweep time which is horizontal trace length, the signal goes through two complete cycles. As a result, the two cycles of the signal voltage are displayed on the screen.
|
Figure 19: Synchronization of sweep and signal Voltages
One of the methods of achieving synchronization is the use of a trigger circuit. The trigger circuit initiates the time base so that the horizontal deflection sweeps in synchronization with the vertical signal. For this, a delay line circuit is used which delays the signal before it reaches y-deflecting plates. A part of the output obtained from the vertical amplifier is fed to the trigger generator.
The trigger generator is sensitive to the level of the voltage applied at its input. The circuit monitors the input signal and detects the point when it reaches the selected level while moving towards the selected polarity. When the predetermined level is reached the circuit produces a trigger pulse. This trigger pulse is fed to the time base generator and it acts as a command signal to the time base generator and starts one sweep cycle of the time base.
The sweep voltage is not developed in the trigger mode if the input signal is not given. A portion of the trigger pulse is fed to a second circuit, which produces an unblanking bias voltage to bring the grid of CRT to a potential, which allows the electron beam to appear. Thus a stationary display of the wave is seen only above a predetermined level of the input voltage. It happens in each cycle. Because the signal voltage is initiating the sweep cycle, both voltages will be synchronized. By proper adjustment of controls, the trigger pulse may be made to originate when the input signal is going positive or negative or at any particular voltage level. However, in AUTO trigger mode the trigger circuit will automatically provide a trigger pulse to the sweep generator even when the input signal is not applied to it and the horizontal trace is seen even without signal at Y-input.
Key Takeaways
- The ramp voltage is generated by Time Base Circuit.
- The time base circuit is the faithful display of the signal variation by the electron beam that requires the beam to move horizontally at a uniform rate across the screen, covering equal distances in equal intervals of time. This condition is satisfied by ramp voltage or saw tooth voltage.
- The use of the trigger circuit is achieving synchronization.
- The trigger circuit initiates the time base so that the horizontal deflection sweeps in synchronization with the vertical signal.
- Synchronization is the method of locking the frequency of the time base generator to the frequency of the input signal so that a stationary display of wave pattern is seen on the CRO screen.
- The signal will be properly synchronized only when its frequency equals the sweep frequency or submultiple of sweep frequency. That is
fsignal = n fsweep
 =
= 
 =
= 
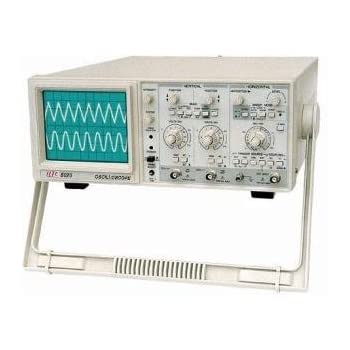
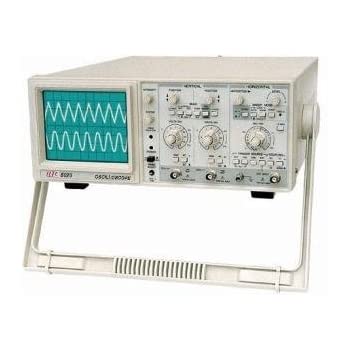
The cathode ray oscilloscope is an electronic test instrument; it is used to obtain waveforms when the different input signals are given. In the early days, it is called an Oscillograph. The oscilloscope observes the changes in the electrical signals over time, thus the voltage and time describe a shape and it is continuously graphed beside a scale. By seeing the waveform, we can analyze some properties like amplitude, frequency, rise time, distortion, time interval, etc.
|
Figure 20:CRO
The main applications of CRO are to observe the properties of electrical and electronic signals, oscillation distortion testing, the frequency response of signals, etc. The important uses of CRO are the measurement of voltage, current, frequency, etc.
Application of CRO
1. There are huge applications of CRO in Radio stations. Indeed, our conventional CRO is not used in those radio stations but they almost the same as our conventional CRO. The CROs are used in the radio station to observe the sending and receiving signal properties.
2. CRO helps to view the characteristics and property of a signal that is why it also helps to control the analog signals.
3. The shape of voltage and current waveform can be observed by CRO which helps to take the necessary decision in a radio station or communication station.
4. CRO is used for research purposes. When scientists are designed a new circuit, they check the voltage, current waveforms of each part of the circuit using the Cathode Ray Oscilloscope.
5. CRO is used with the resonance circuit to observe the bandwidth, wave shape, etc.
6. CRO is also used to observe the characteristics of Amplitude Modulation Circuits, Frequency Modulation Circuits, etc.
USE OF CRO (CATHODE RAY OSCILLOSCOPE)
The CRO is a versatile electronic instrument and it is used in measuring a variety of electrical parameters.
a) Study of the WaveForms: CRO is widely used in maintenance and troubleshooting where the wave shapes of voltages in different electronic circuits are to be examined. The signal under study is applied at the Y-input terminal and the sweep voltage is internally applied to X-plates. The size of the figure displayed on the screen may be adjusted suitably by adjusting the gain control.
b) Measurement of D. C. Voltages: The D. C. voltage understudy is applied at Y-input. The trace gets deflected upward or downward depending upon the polarity of the applied voltage. The deflection of the spot produces on the screen can be measured and by multiplying it with the deflection sensitivity (volts/div), the magnitude of unknown voltage can be obtained.
c) Measurement of A. C. Voltages: For this measurement, the trace is to be adjusted at the center of the screen, and the A. C. voltage understudy is applied at Y-input. The peak to peak distance is measured and by multiplying it with deflection sensitivity (volts/div), peak to the peak value of applied A. C. voltage can be calculated. The rms value and average value of the voltage are calculated using the formulae,
VP = 
Vrms 
Vaver = 0. 636 
d) Measurement of Current: We can measure the value of current or magnitude and direction of current using CRO. By calculating the amplitude variation, horizontal and vertical cells in the CRO screen we can measure the current. We can measure both AC and DC in CRO.
For this measurement, the current has to be passed through the suitable known resistor and the potential developed across it can be measured as has been explained above. The current may then be calculated. However, if the cathode ray oscilloscope having a magnetic deflection system, the currents may be measured by passing it through one of the deflection coils.
e) Measurement of Frequency:
We not only measure voltage and current using CRO, but we can also measure the frequency of a signal by calculating the period. Once we measure the period of a signal then we can easily measure the frequency. The measurement of the period using CRO also very easy.
1) Calibration Method: A sinusoidal signal whose frequency is to be determined is applied to Y-input. The time base control is adjusted to obtain 2 or 3 cycles of the signal on the screen. The horizontal spread of one cycle is noted. By multiplying it with the time base sensitivity (time/div), the period of the signal is obtained. The reciprocal of the period gives the frequency of the signal.
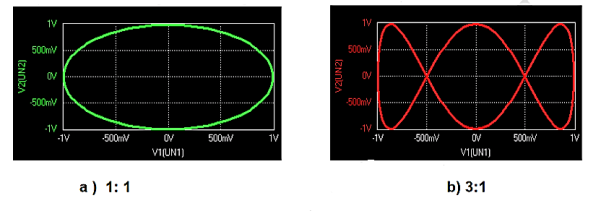
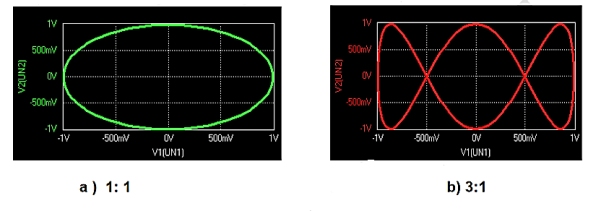
2) Lissajous Method: Alternatively, the frequency of a test signal can be determined using Lissajous patterns. When two sine waves oscillating in mutually perpendicular planes are combined, different types of closed-loop patterns are obtained. They are called Lissajous patterns in honour of the French physicist Lissajous. The signal of unknown frequency is applied to vertical input (Y) and a voltage of known frequency obtained from the standard variable frequency generator is given to horizontal input (X). The frequency of this frequency generator can be varied until a suitable stationary Lissajous figure is obtained. Knowing the frequency from the frequency generator and counting the number of tangency points along horizontal and vertical axes, the unknown frequency can be determined. If fY and fX are the unknown and known frequencies of the sinusoidal voltage fed to the vertical and horizontal plates of CRO respectively and nx and ny are the number of tangency points along the X and Y-axis respectively then the unknown frequency is calculated from
 ………(1)
Where fx is the known frequency. Examples of measurements are:
|
Figure 21: Measurement of Frequency
f) Measurement of phase difference:
Most of the CROs have two channels. We can apply two different signals at a time on the CRO. And we can measure easily the phase difference between the two different signals. Lissajous figures in the CRO screen help us to measure the phase difference between two signals. Using this method we can also measure the frequency of two signals at a time.
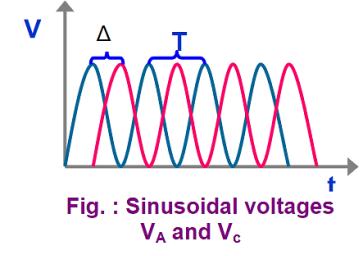
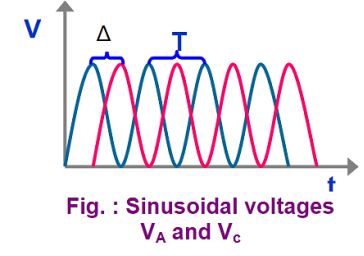
(i) Dual Sweep Method: It requires a dual trace CRO. The phase relationship between two sinusoidal signals of the same frequency may be directly measured by displaying both waveforms on the CRO screen and determining the delay time between the two waveforms.
|
Figure 22: Measurement of the phase difference
The sensitivity and trigger controls of each channel are adjusted for two stationary sinusoidal signals. The sweep speed is initially adjusted such that the period T of the sine wave is measured. Then the sweep speed is increased and the delay time Td between the two sine waves is accurately determined. The difference is calculated using the relation
= 
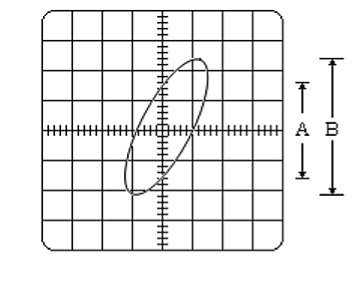
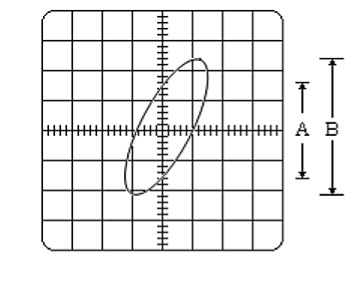
(ii) Lissajous Pattern Method: A second method for determining the phase difference of two sine waves of the same frequency is to feed one sine wave to vertical input and another sine wave to horizontal input. The sweep selector switch is kept in EXT position. A Lissajous pattern namely an ellipse is obtained on the screen. By measuring the lengths A= 2Y1and B=2Y2 of the elliptical
= sin-1(  )
)
Pattern the phase shift is calculated.
= sin-1 
|
Figure 23: Lissajous Pattern Method
Key Takeaways
- The main applications of CRO are to observe the properties of electrical and electronic signals, oscillation distortion testing, the frequency response of signals, etc. The important uses of CRO are the measurement of voltage, current, frequency, etc.
- The CRO is a versatile electronic instrument and it is used in measuring a variety of electrical parameters such as the Study of the waveforms, Measurement of D.C. Voltages, A.C. Voltages, Current, Frequency, and phase difference.
German physicist Wilhelm Roentgen, Professor of Physics in discovered X-rays in 1895—accidentally—while testing whether cathode rays could pass through glass. William Roentgen is honoured with Nobel Prize in 1901.
An X-ray is a packet of electromagnetic energy known as a photon that originates from the electron cloud of an atom. This is generally caused by energy changes in an electron, which moves from a higher energy level to a lower one, causing the excess energy to be released. X-rays are similar to gamma rays however the main difference is the way they are produced; X-rays are produced by electrons external to the nucleus. Traditionally X-rays had longer-wavelengths and lower energy than gamma rays.
They are high energy photons (1- 100Kev) or electromagnetic radiation, having a very short wavelength of the order of 1 Å. Typical x-ray wavelength lies between the range of 1 Å and 100 Å. Accordingly, they are classified into hard X-rays and soft X-rays.
Soft X-rays have relatively short wavelengths of about 10 nanometres (a nanometre is one-billionth of a meter), and so they fall in the range of the electromagnetic (EM) spectrum between ultraviolet (UV) light and gamma-rays.
Hard X-rays have wavelengths of about 100 Pico meters (a Pico meter is one-trillionth of a meter). These electromagnetic waves occupy the same region of the EM spectrum as gamma-rays. The only difference between them is their source: X-rays are produced by accelerating electrons, whereas gamma-rays are produced by atomic nuclei in one of four nuclear reactions.
- X-rays are electromagnetic waves having a wavelength in the range from 1 Å to 100 Å.
- X-rays are high-energy waves as compared to visible light, UV, infrared radiations, microwaves, and radio waves.
- They have a shorter wavelength of the electromagnetic spectrum.
- X-rays can ionize atoms and molecules of matter.
- They travel by a velocity of light i. e. 3 x10⁸ ms-1 in vacuum or air.
- They are not deflected by magnetic or electric fields and, therefore, do not possess any charge.
- An X-ray can produce a photoelectric effect.
- X-rays can affect photographic plates.
- X-rays can ionize a gas through which they pass.
- X-rays can be made to reflect, refract, and diffract. X-rays show the phenomenon of interference and polarization.
- X-rays can produce fluorescence in certain metals.
- When certain x-rays fall on certain metals, secondary X-rays are produced.
- They show particle-like properties in interacting with the matter as in photoelectric effect and Compton Effect.
- Frequency = 3×10¹⁶ to 3×10¹⁹ Hz
- Energy = 0. 1 to 100 keV
- Requires high voltage to produce X-Rays.
- They are capable of traveling in a vacuum.
- They are pure energy.
- They can penetrate various objects.
- They induce colour changes of Methylene and sodium platinocyanide.
- They destroy the fermenting power of enzymes.
Origin of Continuous X-ray Spectra
The line spectrum of an element originates when electrons are expelled from the inner shells of its atoms and the electrons from higher levels fall into these vacancies in the inner shells. Each such transition causes energy loss equal to the energy difference of shells which appears as an X-ray photon.
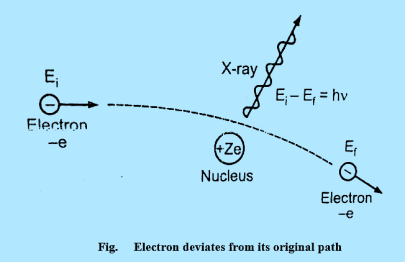
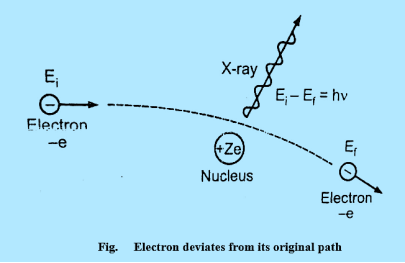
Continuous X-ray spectrum is the result of the inverse photoelectric effect. Continuous X-ray is produced by the phenomenon of “Bremsstrahlung” which is a German word meaning “breaking radiation”. Electrons are emitted from the cathode in the X-rays are accelerated towards the target or plate and strike it, penetrate deep into the interior of its atoms, and are attracted by the nuclei due to strong electrostatic interaction. The electron, therefore, deviates from its original path as shown in figure
|
Figure 24: Electron deviates from its original path
The deviation of the electron from its straight-line path is equivalent to its collision with the nucleus. The electrons are losing more of their kinetic energy due to the collision.
This energy appears as an X-ray photon.
Ei & Ef are initial kinetic energy and the final kinetic respectively.
Ei - Ef h
The electron may suffer several collisions with various nuclei before coming to rest and each collision is accompanied by the emission of an X-ray photon. Hence, several photons of different frequencies are emitted. As there are large numbers of electrons in the beam and each electron collision in a different way, we get photons of almost all frequencies or wavelengths, thus producing a continuous X-ray spectrum.
According to classical theory, the continuous X-ray spectrum should consist of all frequencies between zero and infinity. But according to quantum theory, there is a minimum wavelength up to which is the continuous X-ray spectrum extends. To find the value of min, let the velocity of the incident electron decrease from vi to vf due to the interaction with the nucleus. Then the frequency of X-ray photon is given by
h = When an electron is brought to rest by electrostatic interaction, vf =0 and the photon has a maximum frequency or minimum wavelength. hmax = If V is the potential difference between cathode and target or plate the
From (2) and (3), we have hmax = eV ……………. (4) λmin = from (4) we have λmin = λmin =
|
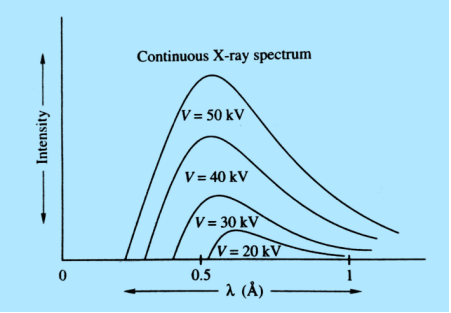
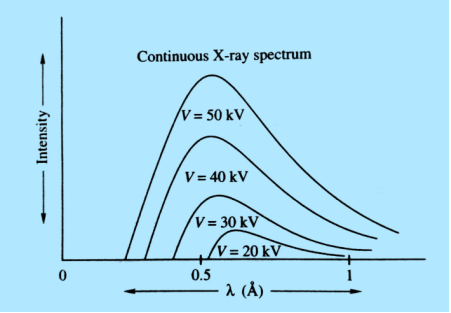
The lowest wavelength limit of continuous spectra is inversely proportional to the accelerating potential of X-ray tube λmin 

Continuous spectrum of X-rays consists of all radiation of all possible X-ray wavelengths within a certain range starting from min (i. e. the wavelength corresponding to minimum energy) onwards. The continuous spectrum is also known as the general spectrum or white spectrum.
The plot of the relative intensity of X-ray spectra versus wavelength in various potential differences applied to an X-ray tube between the cathode and target or plate is shown in the figure. It is clear that by varying the X-ray tube accelerating potential, the min shifts toward left i. e. the X-ray achieve more energy; the intensity of X-rays also increases with voltage.
|
Figure 25: Continuous X-ray spectrum
Key Takeaways
- An X-ray is a packet of electromagnetic energy known as a photon that originates from the electron cloud of an atom.
- This is generally caused by energy changes in an electron, which moves from a higher energy level to a lower one, causing the excess energy to be released.
- Soft X-rays have relatively short wavelengths of about 10 nanometres and hard X-rays have wavelengths of about 100 Pico meters.
- The line spectrum of an element originates when electrons are expelled from the inner shells of its atoms and the electrons from higher levels fall into these vacancies in the inner shells.
- Continuous X-ray spectrum is the result of the inverse photoelectric effect.
- Continuous X-ray is produced by the phenomenon of “Bremsstrahlung”
- The lowest wavelength limit of continuous spectra is inversely proportional to the accelerating potential of X-ray tube λmin


- λmin =
 Å
Å - Continuous spectrum of X-rays consists of all radiation of all possible X-ray wavelengths within a certain range starting from min onwards.
- The continuous spectrum is also known as the general spectrum or white spectrum.
The visible light rays then pass through a sharp edge of an object can form some bright regions inside the geometrical shadow of the object. This is due to the bending nature of light, called diffraction. Diffraction can occur whenever Bragg’s law is satisfied.
LAUE METHOD
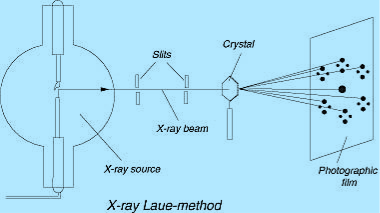
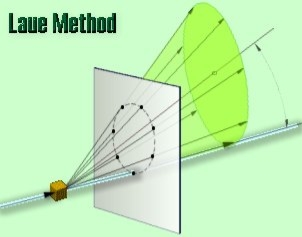
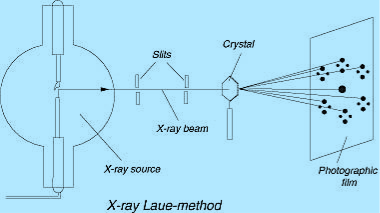
The Laue method was the first diffraction method ever used. This method is used to study the orientation of the crystal and to verify crystal symmetry. A beam of white radiation, the continuous spectrum from an x-ray tube, is allowed to fall on a fixed single crystal. The Bragg angle θ is therefore fixed for every set of planes in the crystal, and each set picks out and diffracts that particular wavelength which satisfies the Bragg law for the particular values of d and involved. Each diffracted beam thus has a different wavelength.
|
Figure 26: Laue method
There are two variations of the Laue method, depending on the relative positions of source, crystal, and film. In each, the film is flat and placed perpendicular to the incident beam. The film in the transmission Laue method (the original Laue method) is placed behind the crystal to record the beams diffracted in the forward direction. This method is so-called because the diffracted beams are partially transmitted through the crystal. These curves are generally ellipses or hyperbolas for transmission patterns.
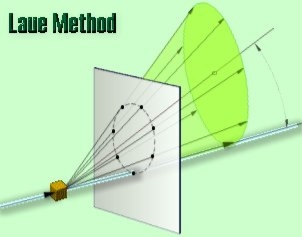
In the transmission Laue method, the film is placed behind the crystal to record beams that are transmitted through the crystal.
One side of the cone of Laue reflections is defined by the transmitted beam. The film intersects the cone, with the diffraction spots generally lying on an ellipse
|
Figure 27: Laue method
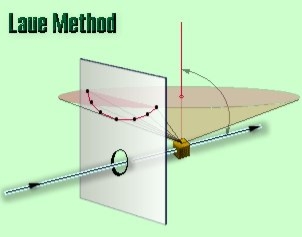
In the back-reflection Laue method, the film is placed between the crystal and the x-ray source, the incident beam passing through a hole in the film, and the beams diffracted in a backward direction are recorded. In either method, the diffracted beams form an array of spots on the film as shown in Figure. This array of spots is commonly called a pattern, more specifically, Laue pattern, but the term is not used in any strict sense and does not imply any periodic arrangement of the spots. On the contrary, the spots are seen to lie on certain curves, as shown in the figure for the transmitted pattern. These curves are generally hyperbolas for back-reflection patterns.
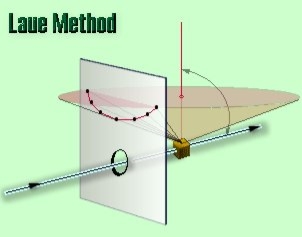
In the back-reflection method, the film is placed between the x-ray source and the crystal. The beams which are diffracted in a backward direction are recorded.
One side of the cone of Laue reflections is defined by the transmitted beam. The film intersects the cone, with the diffraction spots generally lying on a hyperbola.
|
Figure 28: Laue method
The spots lying on any one curve are reflections from planes belonging to one zone. This is because the Laue reflections from planes of a zone all lie on the surface of an imaginary cone whose axis is the zone axis. The positions of the spots on the film, for both the transmission and the back-reflection method, depending on the orientation of the crystal relative to the incident beam, and the spots themselves become distorted and smeared out if the crystal has been bent or twisted in any way.
The facts account for the two main uses of the Laue methods include the determination of crystal orientation and the assessment of crystal perfection.
Laue method is useful to decide the crystal symmetry and orientation of the internal arrangement of atoms/molecules in the crystal.
The atomic arrangement in a crystal can be analyzed by studying the positions and intensities of spots in the Laue pattern.
As several wavelengths of X-rays can reflect in different orders from the same set of planes with the different order reflections superimposed on the same spot in the film, the intensity of the spots and hence the cell parameters of a crystal cannot be determined using the Laue method.
For transmission Laue method, the crystal should be thin.
Laue method can be used to study imperfections or strains in the crystal. The presence of the above defects forms streaks instead of spots in the Laue photograph.
Key Takeaways
- Bending nature of light called diffraction
- Diffraction can occur whenever Bragg’s law is satisfied.
- The Laue method was the first diffraction method ever used. This method is used to study the orientation of the crystal and to verify crystal symmetry.
- Laue method can be used to study imperfections or strains in the crystal.
- The presence of the above defects forms streaks instead of spots in the Laue photograph.
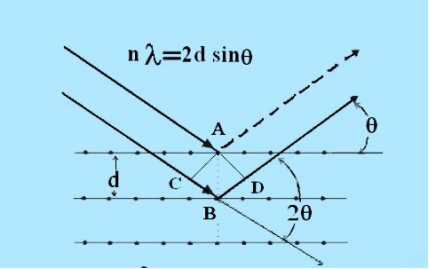
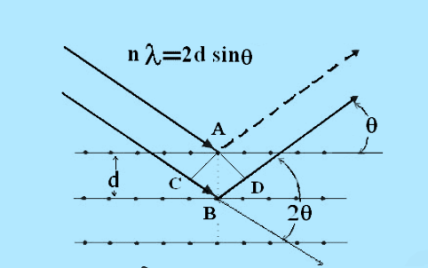
Consider a set of parallel planes called Bragg’s planes. Each atom is acting as a scattering center. The intensity of the reflected beam at certain angles will be maximum when the path difference between two reflected waves from two adjacent planes is an integral multiple of λ.
|
Figure 29: Bragg’s law
Let ‘d’ be the distance between two adjacent planes, 'λ’ be the wavelength of the incident x-ray, ‘θ’ be the glancing angle. The path difference between the rays reflected at A & B is given by
If the two consecutive planes scatter waves in phase with each other, then the path difference must be an integral multiple of the wavelength.
For the reflected light intensity to be maximum, the path difference nλ= 2dsinθ Where ‘n’ is the order of scattering. This is called Bragg’s law Therefore, Bragg’s law states that X-rays diffracted from different parallel planes of a crystal interfere constructively when the path difference is integral multiples of wavelength of X-rays. From Bragg’s law nλ = 2d sin θ, since the maximum possible value for sin θ is 1, nλ/2d ≤ 1 or λ ≤ 2d. This sets the limitation on the wavelength, i. e. in order to get the diffraction pattern by a crystal, the wavelength of X-rays should not exceed twice the inter-planar spacing.
|
Importance of Bragg’s law:
1. Bragg’s law is the essential condition to be satisfied by crystal planes in order to get a diffraction pattern from a crystal.
2. It is used to calculate inter-planar spacing. Knowing the values of inter-planar spacing, lattice parameters can be determined.
Key Takeaways
- Bragg’s law states that X-rays diffracted from different parallel planes of a crystal interfere constructively when the path difference is integral multiples of wavelength of X-rays.
- Bragg’s law is given by nλ= 2dsinθ , Where ‘n’ is the order of scattering.
- Bragg’s law is the essential condition to be satisfied by crystal planes in order to get a diffraction pattern from a crystal.
- It is used to calculate inter-planar spacing.
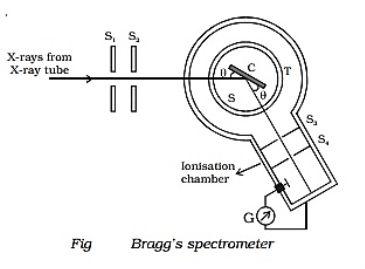
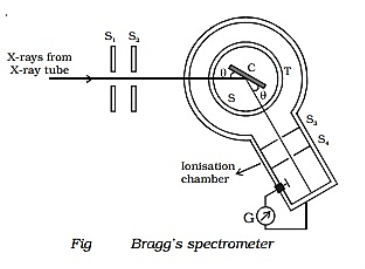
Bragg's spectrometer used to determine the wavelength of X - rays are shown in Figure. Bragg's spectrometer is similar in construction to an ordinary optical spectrometer.
|
Figure 30: Bragg's Spectrometer
Bragg's Spectrometer consists of a collimator containing two slits S1 and S2. It is made up of lead, through which X-ray is passed. A turntable is situated in front of the collimator on which the crystal is placed. The ionization chamber collects the reflected X-ray
Procedure:
X-rays from an X-ray tube are made to pass through two fine slits S1 and S2 which collimate it into a fine pencil. This fine X-ray beam is then made to fall upon the crystal ’C’ (usually sodium chloride crystal) mounted on the spectrometer table. This table is capable of rotation about a vertical axis and its rotation can be read on a circular graduated scale S. The reflected beam after passing through the slits S3 and S4 enters the ionization chamber. The X-rays entering the ionization chamber ionize the gas which causes a current to flow between the electrodes and the current can be measured by galvanometer G. The ionization current is a measure of the intensity of X-rays reflected by the crystal.
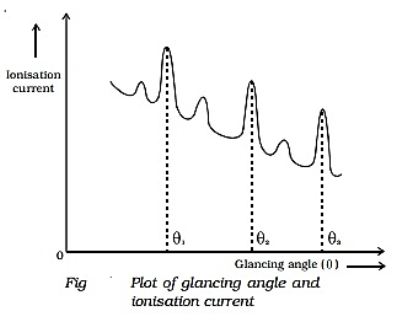
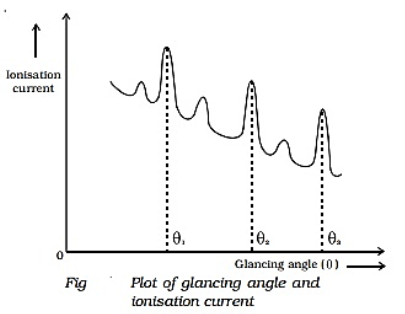
A fine beam of a monochromatic X-ray is made to fall on the crystal. The crystal reflects the X-rays which are collected by the ionization chamber. The turntable is rotated till a sharp increase in the intensity is detected. The sudden increase in intensity suggests that Bragg's Law is satisfied at the given angle θ. Then the inter-planar spacing can be determined by using Bragg's Law nλ = 2d. sinθ. The peak in ionization current occurs more than once for different values of "n"
The ionization current is measured for different values of glancing angle θ. A graph is drawn between the glancing angle θ and the ionization current (Figure).
|
Figure 31: Plot of glancing angle and ionization current
For certain values of glancing angle θ, the ionization current increases abruptly. The first peak corresponds to the first order, the second peak to the second-order, and so on. From the graph, the glancing angles for different orders of reflection can be measured. Knowing the angle θ and the spacing d for the crystal, the wavelength of X-rays can be determined.
Key Takeaways
- Bragg's spectrometer used to determine the wavelength of X - rays
- Knowing the angle θ and the spacing d for the crystal, the wavelength of X-rays can be determined by nλ = 2d.sinθ.
X-rays are types of electromagnetic radiation probably most well-known for their ability to see through a person's skin and reveal images of the bones beneath it. Advances in technology have led to more powerful and focused X-ray beams as well as ever greater applications of these light waves from imaging teeny biological cells and structural components of materials like cement to killing cancer cells.
Most people are familiar with x-rays because of their use in medical imaging but there are many other applications of the radiation:
- In diagnostic medicine, x-rays are used to view bone structures, to detect the breakage in human bones.
- Hard x-radiation is used to minimize the absorption of low energy x-rays. A filter is placed over the x-ray tube to prevent transmission of the lower energy radiation.
- The high atomic mass of calcium atoms in teeth and bones absorbs x-radiation, allowing most of the other radiation to pass through the body.
- Computer tomography (CT scans), fluoroscopy, and radiotherapy are other x-radiation diagnostic techniques.
- X-rays may also be used for therapeutic techniques, such as cancer treatments.
- X-rays are used for crystallography, astronomy, microscopy, industrial radiography, spectroscopy, fluorescence and to implode fission devices.
- X-rays may be used to create art and also to analyze paintings.
- Banned uses include x-ray hair removal and shoe-fitting fluoroscopes, which were both popular in the 1920s.
- They are used for medical purposes
- X-rays are used for airport security. They are used as a scanner to scan the luggage of passengers in airports, rail terminals, and other places.
- It is emitted by celestial objects and is studied to understand the environment.
- It is widely used to detect defects in the welds.
Key Takeaways
- X-rays are types of electromagnetic radiation probably most well-known for their ability to see through a person's skin and reveal images of the bones beneath it.
- Powerful and focused X-ray beams have greater applications from imaging teeny biological cells and structural components of materials like cement to killing cancer cells.
In his 1923 experiment, Compton provided the most conclusive confirmation of the particle aspect of radiation.
By scattering X-rays off free electrons, he found that the wavelength of the scattered radiation is larger than the wavelength of the incident radiation. This can be explained only by assuming that the X-ray photons behave like particles.
According to classical physics, the incident and scattered radiation should have the same wavelength.
Also, we know that the energy of the X-ray radiation is too high to be absorbed by a free electron therefore the incident X-ray would then provide an oscillatory electric field which sets the electron into oscillatory motion, hence making it radiate light with the same wavelength but with an intensity I that depends on the intensity of the incident radiation I0
But neither of these two predictions of classical physics is compatible with experiment.
|
Figure 32s: Elastic scattering of a photon from a free electron
By experiment Compton reveals that the wavelength of the scattered X-radiation increases by an amount  , called the wavelength shift and that
  depends not on the intensity of the incident radiation, but only on the scattering angle.
Compton succeeded in explaining his experimental results only after treating the incident radiation as a stream of particles—photons—colliding elastically with individual electrons.
Here we will discuss the elastic scattering of a photon from a free-electron as shown in the figure. Consider that the incident photon, of energy E =hν and momentum p = hν /c, collides with an electron that is initially at rest. If the photon scatters with a momentum
Which leads
Energy Conservation The energies of the electron before and after the collision are given, respectively, by E0 =mec2 ………. . (3)
Since the energies of the incident and scattered photons are given by E = hν and E0 = hν’, respectively, conservation of energy dictates that E + E0 = E’ + Ee ………. . (4)
Which leads to
Squaring both sides of (5) and simplifying, we get
Hence wavelength shift is given by
Where λC = h/mec = 2. 426 x 10-12 m is called the Compton wavelength of the electron.
This relation connects the initial and final wavelengths to the scattering angle. Compton’s experimental observation:
Example High energy photons are scattered from electrons initially at rest. Assume the photons are backscattered and their energies are much larger than the electron’s rest-mass energy, E = mec2. (a) Calculate the wavelength shift. (b) Show that the energy of the scattered photons is half the rest mass energy of the electron, regardless of the energy of the incident photons. (c) Calculate the electron’s recoil kinetic energy if the energy of the incident photons is 150 MeV.
Solution: (a) In the case where the photons backscatter i. e. θ = π The wavelength shift becomes
(b) Since the energy of the scattered photons E’ is related to the wavelength
Where E = hc/
(c) If E = 150 MeV, the kinetic energy of the recoiling electrons can be obtained from the conservation of energy Ke = E – E’
Example X-rays with an energy of 300 keV undergo Compton scattering with a target. If the scattered X-rays are detected at 30° relative to the incident X-rays, determine the Compton shift at this angle, the energy of the scattered X-ray, and the energy of the recoiling electron.
Solution: The Compton shift When it is scattered through an angle θ by an electron: λ′−λ= λe(1−cosθ) We know Compton wavelength of the electron λe= h/mec= 2. 43 pm me mass of the electron = 511 keV/c2 θ = 30° Compton shift is λ′−λ= λe(1−cosθ) = 2. 426 x 10-12 m (1−cos30◦. ) = 0. 325 pm The energy E′ of the scattered photon is E′=hc/ λ′ And λ=hc/E E=300 keV is the wavelength of the incoming photon. It follows that E′= 278 keV. By conservation of energy, the energy lost by the photon in the collision is converted into kinetic energy K of the recoiling electrons K= 22 keV |
Key Takeaways
|
Reference Books
I. Engineering physics- Gaur and Gupta, & S. Chand Publication
2. Engineering physics - Avadhanalu and Kshirsagar, S. Chand Publication
3. Introduction to Solid State Physics -- Charles Kittel
4. Solid State Physics -- S. O. Pillai
5. Engineering physics- Hitendra K Malik, A. K. Singh, Tata McGraw Hill Education Private Limited, New Delhi
6. Essential University Physics Volume – l and 2 Richard Wolfson, Pearson, Noida 7. Engineering Physics Dattu R Joshi Tata Mc-Graw Hill Education Private Limited
UNIT 1
ELECTRON OPTICS AND X- RAYS
Positive rays
In 1897 J. J. Thomson discovered the electron. The electron is a tiny particle, almost two thousand times lighter than the hydrogen atom, and it is negatively charged.
Thomson referred to electrons as 'corpuscles'. They had previously been known as 'cathode rays' because in a vacuum tube they started at the negative electrical terminal called a cathode and moved away from it.
In 1907 Thomson began to investigate the rays that were moving towards the cathode. These rays were positively charged, and Thomson wanted to see if they were also composed of charged particles.
Canal Ray experiment is the experiment performed by German scientist Eugen Goldstein in 1886 that led to the discovery of the proton. Thus positive rays had first been observed by Goldstein in 1886.
In 1896 Goldstein noticed that when a discharge occurred in a tube of low-pressure gas rays appeared to be produced originating from the anode. These he called 'kanalstrahlen’ or sometimes known as canal rays. These rays are called positive rays.
The positive charge of the rays was not identified until sixteen years later when Wien deflected them in a magnetic field. They were much harder to deflect than cathode rays and were deflected in the opposite direction. This shows that they could be massive, positively charged particles.
Wien had used electric and magnetic fields to examine the positive rays. He found their maximum specific charge was around two thousand times smaller than that of the electron. This shows that they could be ionised hydrogen atoms.
Production
The discovery of proton which happened after the discovery of the electron further strengthened the structure of the atom.
- In the experiment, Goldstein applied high voltage across a discharge tube that had a perforated cathode.
- A faint luminous ray was seen extending from the holes in the back of the cathode.
- The apparatus of the experiment is the same apparatus as of cathode ray experiment.
- It is made up of a tube made of glass containing two pieces of metal ions at different ends.
- These metal pieces act as an electrode.
- The two metal pieces are connected with an external voltage.
- The pressure of the gas inside the tube is lowered by evacuating the air. The rays originated within the gas itself, none being produced if the tube
were evacuated.
|
Figure 1: Positive Rays-Production
Working
- Apparatus as setting up by providing a high voltage source and evacuating the air to maintain low pressure inside the tube.
- High voltage is passed to the two metal pieces to ionize the air and make it a conductor of electricity.
- The electricity starts flowing as the circuit was complete. The electrons emitted from the cathode collide with the gas atoms found in the tube, knocking one or two additional electrons out of each of these atoms. These collisions leave behind ions that are positively charged.
- When the voltage was increased to several thousand volts, a faint luminous ray was seen extending from the holes in the back of the cathode.
- When very high voltage is applied, it ionizes the gas and it is positive ions of gas that constitute the canal ray. It is actually the nucleus or kernel of the gas that was used in the tube and hence it has properties different from the cathode rays which were made up of electrons.
- The produced positive ions travel towards the cathode. Any of the positive ions pass through the perforations that create canal rays in the cathode disc. Both electric and magnetic fields deflect the channel rays in the same direction as the cathode rays.
- These rays were moving in the opposite direction of cathode rays and were named canal rays.
A discharge occurs in the low-pressure gas in the bulb at the left-hand end of the apparatus, producing positive rays that pass through the anode and into the right-hand end of the tube. Here they go through electric and magnetic fields that act in the Y-direction; the electric and magnetic forces on the particles are therefore at right angles to each other.
When the particles strike the fluorescent screen a parabola is produced by particles having different velocities, those with the highest velocities having originated closest to the anode (since an ion with zero velocity near the anode will have a longer distance over which to accelerate before it reaches the cathode if it makes no collisions on the way).
|
Figure 2: Two parabola are shown made by particles with different masses m1 and m2 (m1>m2).
It was assumed that the particles were gaseous ions of mass m and charge q. J. J. Thomson found that the value of q/m for the particles in the positive rays with hydrogen in the tube was of the order of 108 Ckg-1. This must mean that the particle that makes up positive rays has either a smaller charge than that of the electron or a much greater mass, and it is the latter that has been accepted.
Unlike cathode rays, canal rays depend upon the nature of gas present in the tube. It is because the canal rays are composed of positive ionized ions formed by ionization of gas present in the tube.
The charge to mass ratio for the particles of the ray was found to be different for different gases.
The behaviour of particles in an electric and magnetic field was opposite to that of cathode rays.
Some positively charged particles carry multiples of the fundamental value of the charge.
Properties
The positive rays showed the following properties:
- They are the streams of positive ions of the gas enclosed in the discharge tube.
- They could be deflected by electric and magnetic fields
- They showed a spectrum of velocities
- They were dependent on the gas in the tube
- They could cause ionisation
- They caused fluorescence and affected photographic plates.
- They travel in straight lines.
- The velocity of canal rays is much smaller than the velocity of cathode rays.
Key Takeaways
- Positive rays had first been observed by Goldstein in 1886. In 1896 Goldstein noticed that when a discharge occurred in a tube of low-pressure gas rays appeared to be produced originating from the anode. These rays are called positive rays.
- Positive rays are also known as canal rays.
- Positive rays are produced in a discharge tube that passes through the anode. Here they go through electric and magnetic fields. the electric and magnetic forces on the particles are therefore at right angles to each other.
- When the particles strike the fluorescent screen a parabola is produced by particles having different velocities, those with the highest velocities having originated closest to the anode.
- Positive rays could be deflected by electric and magnetic fields. They could cause ionisation, fluorescence, and affected photographic plates. They travel in straight lines and the velocity of canal rays is much smaller than the velocity of cathode rays.
J. J. Thomson first determined the specific charge (charge to mass ratio e/m) of the electron in 1887. For his work J. J. Thomson received the Nobel Prize in Physics in 1906, “in recognition of the great merits of his theoretical and experimental investigations on the conduction of electricity by gases”.
The specific charge is defined as the charge per unit mass of the particle. Thomson discovered that the value of (e/m) was independent of the gas used and also independent of the nature of the electrodes. Thomson discovered that the value of (e/m) was independent of the gas used and also independent of the nature of the electrodes.
The importance of the mass-to-charge ratio is that two particles with the same mass-to-charge ratio move in the same path in a vacuum when subjected to the same electric and magnetic fields.
PRINCIPLE
The fact that the cathode rays (electrons) are deflected by electric and magnetic fields is made use of in this method. When a narrow beam of charged particles is projected at a constant speed (v) across a magnetic field in a direction perpendicular to the field, the beam of particles experiences a force, which makes them move in a circular path.
CONSTRUCTION
- It consists of a highly evacuated glass tube, fitted with electrodes.
- Electrons are produced by heating a tungsten filament electrically.
- Electrons are made to accelerate and form a beam by passing through discs A and B.
- They are passed through an electric and magnetic field. Finally, they fall on zinc sulphide screen
|
Figure 3: Thomson’s method
THEORY
Electrons moving sideways are also directed towards the screen by applying a negative potential on a hollow cylinder (c) open on both sides surrounding the filament. Electrons are accelerated by applying a potential difference of above 1000 V between the filament and disc A. A further potential difference of 500 V is applied between discs A and B. The arrangement focuses the beam to the hole of the disc B from where it is further proceeds to a straight line. When a beam of electrons enters a magnetic field it moves in a circular track. The force experienced by the electron is
Fm = evB ……. . (1)
This magnetic field provides necessary centripetal force to the electron so that it follows a circular path. We know Fc =mv2/r. We have
So Fm = Fc
evB =mv2/r
eB =mv/r
e/m =v/Br ……. . (2)
By knowing the values of v, B, and r, the value of e/m can be determined.
RADIUS OF CURVATURE OF PATH
|
Figure 4: Radius of curvature of the path
If r is the radius of curvature of the circular path, ‘a’ is the distance b/w ‘O’ and ‘O/’, and ‘b’ is the distance b/w electron gun and screen then by using the property of chord:
AD x OD = BD x DO (2r-a) x a =b. b (2ra-a2) = b2 since 2r is very small as compared to a2 2ra = b2 r = b2/2a ……. . (3) |
DETERMINE VELOCITY BY the FIRST METHOD
The electrons are first accelerated by applying a potential (V) b/w discs A and B before entering the magnetic field.
K. E =Ve 1/2mv2 =Ve v= (2Ve/m)1/2 we know from eq (2) e/m =v/Br put value of v in eq (2) we get e/m = {(2Ve/m)1/2}/Br Squaring on both sides, we have e2/m2 = (2Ve/m)/B2r2 e/m = 2V/B2r2 ……. . (4) |
PARTICLE SELECTOR METHOD
This is a more accurate method as compared to the above method. In this method, the beam is passed through a crossed electric and magnetic field. The electric field is so adjusted that the light spot comes back to ‘O’ from ‘O/’. i. e. electron beam passes and straight without deflection.
Force on an electron by an electric field Fe=Ee Force on an electron by the magnetic field Fm= Bev Since both forces balance each other Fm = Fe Bev = Ee v = E/B ……. . (5) We know e/m =v/Br by eq (2), substituting v from the above equation (5) we have e/m = (E/B)/Br e/m = E/B2r ……. . (6) By knowing E, B, and r we can find the e/m ratio. |
Thus In his experiment, J. J. Thomson had found a charged particle that had a specific charge two thousand times that of the hydrogen ion, the lightest particle known at that time. Once the charge on the particles was measured he could conclude with certainty that these particles were two thousand times lighter than hydrogen. This explained how these particles could pass between atoms and make their way out of thin sheets of gold. Measurement of the specific charge of cathode rays for different metals made him conclude that the particles that constituted cathode rays form a part of all the atoms in the universe. The direct measurement of the mass of the electron is difficult by experiments. It is easier to determine the specific charge of the electron e/m from which the mass m can be calculated if the elementary charge e is known.
Key Takeaways
- The specific charge is defined as the charge per unit mass of the particle. Thomson discovered that the value of (e/m) was independent of the gas used and also independent of the nature of the electrodes.
- It is based on the principle that the cathode rays (electrons) are deflected by electric and magnetic fields.
- When a narrow beam of charged particles is projected at a constant speed (v) across a magnetic field in a direction perpendicular to the field, the beam of particles experiences a force, which makes them move in a circular path.
- The e/m ratio is given by
e/m = E/B2r
Bainbridge mass spectrometer is an instrument used for the accurate determination of atomic masses.
PRINCIPLE
Uniform magnetic field acting normal to the path of ions having the same velocity deflects the ions of different masses from a straight path to a circular path of different radii.
CONSTRUCTION
(i) Ionization Chamber
The ionization chamber is used to ionize the gas whose mass or isotope is to be determined and positive ions are produced.
(ii) Velocity Selector
Velocity selector has two fields electric and magnetic field both are applied perpendicular to the moving ion beam. A potential (V) is applied between two electrodes to produce the electric field. A magnetic field (strength B) is applied at right angles to the electrostatic field and so the electrostatic and electromagnetic forces act in opposite directions to each other. A velocity selector is used to produce a mono-velocity ion beam and a transverse magnetic field is employed to discriminate between ions of different masses.
(iii) Vacuum / Analyzing Chamber
Vacuum / Analyzing Chamber is a semi-spherical cavity in which another magnetic field B’ is applied perpendicular to the moving positive ion.
|
Figure 5: Bainbridge Mass Spectrograph
WORKING
Atoms with one or more electrons removed have a net positive charge and they become positive ions. A beam of positive ions produced in a discharge tube is collimated into a fine beam by two narrow slits S1and S2. This fine beam enters into a velocity selector.
The velocity selector allows the ions of a particular velocity to come out of it, by the combined action of an electric and a magnetic field. The velocity selector consists of two plane-parallel plates P1 and P2, which produces a uniform electric field E and an electromagnet, to produce uniform magnetic field B (represented by the dotted circle). These two fields are at right angles to each other and to the direction of the beam.
The electric field and magnetic field are so adjusted that the deflection produced by one field is nullified by the other so that the ions do not suffer any deflection within the velocity selector.
Ions are formed in the ionization chamber and pass through the cathode, then through collimating slits S1 and S2. The beam is then passed through a velocity selector in which electric and magnetic fields are applied perpendicular to each other. The ion moves in a straight-line path for which both the forces acting on it are equal
Let E and B be the electric field intensity and magnetic induction respectively and q be the charge of the positive ion. The force exerted by the electric field is equal to qE and the force exerted by the magnetic field is equal to qvB where v is the velocity of the positive ion.
qE =qvB
The velocity of ion which passes undeflected through the velocity selector is
v = E/B
In the vacuum chamber, the ions are affected by the magnetic field (B’) alone and so move in circular paths, the lighter ions having the larger path radius. If the mass of an ion is M, its charge q, and its velocity v then
qvB’ =Mv2 /R
R =Mv/qB’
So the radius of the path is directly proportional to the mass of the ion i. e. R ∝ M
Further substitute the value of v
R =ME/qBB’ or M =RqBB’/E
Ions with different masses trace semi-circular paths of different radii and produce dark lines on the plate. The distance between the opening of the chamber and the position of the dark line gives the diameter 2R from which radius R can be calculated.
Since, B, B′, E, and R are known, the mass of the positive ions and hence isotopic masses can be calculated.
Key Takeaways
- Bainbridge mass spectrometer is an instrument used for the accurate determination of atomic masses.
- It is based on the principle of a uniform magnetic field acting normal to the path of ions having the same velocity deflects the ions of different masses from a straight path to a circular path of different radii.
- The radius of the path is directly proportional to the mass of the ion i.e. R ∝ M
- Since, B, B′, E, and R are known, the mass of the positive ions and hence isotopic masses can be calculated by using the formula M =RqBB’/E
The first mass spectrograph was designed by Cambridge scientist F W Aston (1877-1945). It could separate isotopes, which are chemically identical atoms with different masses. The spectrograph's globe contained a compound of the material to be tested and an electric current then knocked electrons from the material's atoms. Aston worked with J J Thomson (1856-1940) to show that over 50 elements were made up of atoms of different atomic masses but the same atomic numbers.
Mass Spectrograph
It is an instrument that is used to determine the mass of atoms or molecules in which a beam of a charged particle is passed through an electromagnetic field that separates particles of different masses. The result of the distribution of the spectrum is recorded on a photographic plate.
Components of Mass Spectrograph
1. Ion Source: - All mass spectrograph starts with an ion source to be detected. The ions are produced either by electron-bombardment of gases or by heating the suitably coated filaments.
2. Energy, Momentum, and Velocity Filter: The positive energy ions are given energies by accelerating them through a potential difference V so that their energy qV is much greater than initial ion energies. To have a beam of the same momentum and mass the ions are then passed through electric and magnetic fields which may act as momentum and velocity filters.
3. Evacuated Chamber:- This chamber is evacuated and provides the path to ion-beam to be detected. Usually, a strong magnetic field is applied perpendicular to the ion beam for its deflection to a circular path.
4. Detector: It may be a photographic plate or an electrometer. The typical Mass Spectrograph is Bainbridge’s, Aston’s, and Dempster’s Mass Spectrograph.
Now we will discuss Aston’s Mass Spectrograph in detail.
Aston’s Mass Spectrograph
It uses electric and magnetic fields that are mutually perpendicular. The isotope beam is subjected perpendicular to the electric field. The apparatus is shown in figure (6) The given stream of positive ions is rendered into a fine beam by passing it between two narrow slits S1 and S2.
|
Figure 6: Experimental setup for Aston’s Mass Spectrograph
This beam enters the electric field of strength (E) between metal plates P1 and P2. Due to the action of the electric field, all positive ions having the same value of specific charge (q+/M) (where q+ is a positive charge on ion and M is its mass) are not only deflected by an angle 𝜃 from the original path towards negative plate but are also dispersed by an angle d𝜃 due to their different velocities. The beam is then allowed to pass through slit S3 and enter a magnetic field of strength B arranged perpendicular to the electric field to deflect the beam in opposite direction and converge it to a single point F on a photographic plate. The magnetic field deviates the beam through an angle ∅and reconverges them by an angle d∅.
Theory
Condition for Focussing:
Consider a beam of ions having the same value of q+/M but moving with different velocities. Let 𝜃 and ∅ be the mean angles of deviation of the beam in electric and magnetic fields in opposite directions. Let d𝜃 be the dispersion angle due to the electric field and d∅ be the convergence angle due to the magnetic field. Let v be the velocity of an ion, L1 the length of the electric field, and l1 the transverse displacement of an ion from its path due to electric field,
Then acceleration of ion, a1=(q+E/M) and Time by ion to transverse electric field =L1/v Transverse deflection in an electric field,
Angular deviation of the ion beam,
The angle of dispersion of beam in an electric field,
If l1 is the transverse deflection of an ion beam in the magnetic field of strength L2, then in a similar manner,
(since the acceleration of ion in magnetic field B is a2 =(q+vB/M) The deviation produced by the magnetic field is in the opposite direction
Convergence d∅
Comparing eqn. (1) and eqn. (2) we get,
Let a=OC=distance between two fields, Then the width of the ion at C= ad𝜃 Let CF=b=distance of magnetic field and photo-plate. If there had been no magnetic field, the width of the ion beam after traveling a further distance b would have been =(a+b) d𝜃 Therefore magnetic field produces convergence d∅ in a distance b. Thus the width of converged beam= bd∅ Thus the condition of focussing becomes:
|
This gives the distance at which the photographic plate should be placed to record the beam and also the deflection caused by the magnetic field as compared to the electric field.
Detection of isotopes: To determine the masses of isotopes of an element, the element is mixed with a number of other elements of known atomic masses. The traces of all of them are obtained on the same photographic plate. The distance of the traces of known masses is measured from a given reference point on the plate. A calibration curve is then drawn between known atomic masses and the distance of traces from a given point. By measuring the distances of the traces of isotopes of elements from the same reference points, the atomic masses are obtained from the calibration curve.
Advantages:
1. All particles having the same (q+/M) are focusing on a single point of photographic plate unlike, Thomson’s method where they spread out in the form of a parabola. Hence lines on photographic plates in Thomson’s arrangement are feeble.
2. The intensity of a line obtained on a photo-plate is proportional to the total no. of particles of the mass. Thus the relative intensities of various lines give the idea of the relative abundance of different isotopes of an element.
Key Takeaways
- Mass Spectrograph is an instrument that is used to determine the mass of atoms or molecules in which a beam of a charged particle is passed through an electromagnetic field that separates particles of different masses.
- Aston’s Mass Spectrograph uses electric and magnetic fields that are mutually perpendicular. The isotope beam is subjected perpendicular to the electric field.
- Condition of focussing
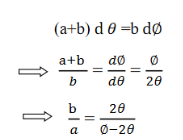
4. This gives the distance at which the photographic plate should be placed to record the beam and also the deflection caused by the magnetic field as compared to the electric field.
The motion of an electron beam in a non-uniform electric field can be understood by studying Bethe’s law. The non-uniform electric field is a field in which electric intensity varies from point to point and field lines are not straight and evenly spaced. Electron motion in a non-uniform electric field is better understood with the help of equipotential surfaces.
Equipotential surfaces are those surfaces where electric potential remains constant and electric lines are perpendicular to the surface at any point. Therefore the normal to the equipotential surface shows the line of action of the electric force on the electron.
Let us consider a uniform electric field produced in an infinitesimally thin region. This uniform electric field is set up by two metal plates charged to appropriate potentials. The electrons are allowed to pass through the electric field being set up by two closely spaced metal grids as shown in the figure.
|
Figure 7: Electron Refraction
Consider an equipotential surface AB. It is considered as the boundary across which the potential V1abruptly changes to V2. Let electron travel through the region-I with a uniform velocity v1 and enter the region-II and moves with a velocity v2.
As the electrons pass through equipotential surface AB it experiences a force that alters its velocity. Because the electric field exists only in the vertical direction (Y-direction). Hence the normal component of electron velocity vy changes whereas the tangential component vx remains constant.
If V2 >V1, vy increases, and if V2<V1, vy decreases. In the above figure, V2 > V1i. e. V2 is taken to be greater than V1and hence vy increases. The electron path is, therefore, bent nearer to the surface normal. As the tangential component of the velocity remains constant in region-I and region-II we can write, vx = vy
The velocity of the electron in terms of potential is given by
Equation (2) is similar to Snell’s law of refraction in optics and is known as Bethe’s law for electron refraction. When light enters from rarer to the denser medium it gets slowed down and bends towards the normal. However, when electrons are moving from the region of lower potential to a region of higher potential gets accelerated and bends toward the normal. Eqn. (2) can be extended to any arbitrary electrostatic field which is non-uniform. The figure demonstrates the motion of an electron in a non-uniform electric field represented by equipotential surfaces separating equipotential regions of potentials V1, V2, V3, V4, etc.
|
Figure 8: Electron Refraction in a Non -uniform Electric
At each surface electron path bends towards or away from the higher or lower potential region. It is seen that the electron motion occurs along a curved path in a non-uniform electric field.
Comparison between Snell’s Law and Bethe’s Law
Snell’s Law | Bethe’s Law |
1. It deals with the refraction of light. | 1. It deals with the refraction of electrons. |
2. A light entering from a rarer medium to a denser medium bends towards the normal. | 2. An electron entering from a region of low potential to high potential bends toward the normal (i. e. bends toward the direction of the electric field). |
3. A light entering from a rarer medium to a denser medium decreases in velocity. | 3. An electron entering from a region of low potential to a region of high potential increases in velocity. |
|
|
Key Takeaways
- The motion of an electron beam in a non-uniform electric field can be understood by studying Bethe’s law.
- It is similar to Snell’s law of refraction in optics
- However, when electrons are moving from the region of lower potential to a region of higher potential gets accelerated and bends toward the normal.
- Mathematically Bethe’s law is given by
 =
= 
- It is seen that the electron motion occurs along a curved path in a non-uniform electric field.
(CRO) Cathode Ray Oscilloscope
Cathode Ray Oscilloscope is a very important electronic measuring instrument that is used to display and measure electrical signals, time intervals, and phase shift between two electrical signals. Non-electrical quantities such as pressure, strain, and temperature can be measured by first converting them into an equivalent voltage using an appropriate transducer.
Any CRO consists of the following seven major sections
i) Cathode Ray Tube (CRT)
ii) Timebase circuits
iii) Trigger circuits
iv) Vertical Circuits
v) Horizontal Circuits
vi) High Voltage Power Supply
vii) Low Voltage Power Supply
The arrangement of these sections in a CRO is shown in fig in the form of a Block diagram.
|
Figure 9: Block diagram of CRO
CATHODE RAY TUBE (CRT)
A cathode-ray tube with electrostatic deflection forms the central part of a CRO. The CRT generates the electron beam, focuses it, and accelerates it towards the fluorescent screen.
The rest of the sections are electronic circuits that cause the desired movement of a luminous spot on the screen. In its action, the electron beam is similar to a pen. It writes on the fluorescent screen in the form of a bright trace. Writing on paper involves two motions i. e. horizontal motion of the pen sweeping across the page and other is vertical motion of the pen indicating the message. The electron beam should be made to move both horizontally and vertically. A transparent graph called graticule marked in centimeter lines (divisions) both vertically and horizontally is attached to the face of the CRT for making measurements. When a signal is to be displayed, it is applied to the Y-plates of CRO by connecting it to the Y input of CRO.
For example, let the signal be a simple harmonic wave. Because of the application of the signal to the Y plates, the luminous spot moves up and down on the screen at the same frequency as that of the applied voltage. The successive positions of the spot can be seen as shown in fig. 10(a)., when the frequency of the signal is less than about 20 Hz. At higher frequencies, the path of the beam is seen as a vertical line (fig 10b). This is due to the persistence of vision and the fluorescence of the coating. The luminous line is called a trace. The length of the vertical trace corresponds to the peak to the peak value of applied voltage.
|
Figure 10: (a) Trace with low-frequency signal (b) Trace with a high-frequency signal
II) TIME BASE CIRCUIT
The faithful display of the signal variation by the electron beam requires the beam to move horizontally at a uniform rate across the screen, covering equal distances in equal intervals of time. This condition is satisfied by ramp voltage or saw tooth voltage. The ramp voltage is generated by Time Base Circuit.
The time base circuit consists of a time base generator. The time base generator is a variable frequency oscillator that produces an output voltage of sawtooth shape.
|
Figure 11: Timebase voltage
To obtain a visual display of the waveform of applied voltage, it is necessary to apply this A. C. voltage to one set of the deflection plates say Y-plates, and the other time base voltage or ramp voltage, generated by time base generator, to X-plates.
This time base voltage is periodic and its frequency can be varied. This voltage increases linearly with time and after reaching a maximum value (Vx)max, it suddenly drops to minimum value (Vx)min. When this voltage is applied to the horizontal deflection plates, the luminous spot sweeps the face of the screen at a uniform velocity from the left edge to the right edge depending on the polarity of the voltage. Because of this reason ramp voltage is also called sweep voltage. The deflection of the spot becomes maximum when the voltage reaches the value (Vx)max after which the spot suddenly returns to its original position. If the frequency of the time base voltage is sufficiently high the trace of the spot appears as a straight line.
Due to the resemblance of sweep voltage to teeth of a saw, it is also called saw-tooth voltage.
Sweep Time or Trace Time (ts):
The time taken by the sweep voltage to rise from its maximum negative voltage to its maximum positive voltage is called sweep time or a trace time tS.
Retrace Time or Flyback Time (tr):
The time taken by the sweep voltage to dip from its maximum positive voltage to its maximum negative voltage is called retrace time or fly back time tR.
Sweep Period (Tsweep):
The sum of sweep time and retrace time constitutes the sweep period Tsweep.
Tsweep= ts+ tr ≈ ts
Blanking:
The retrace path, if seen on the screen, gives a bad visual effect. By making the retrace time equal to zero, the retrace path can be eliminated. The trace during the flyback time or retrace time can be made invisible by applying a high negative voltage pulse to the control grid in the electron gun which turns off the electron beam momentarily. The process of making a retrace path invisible is known as Blanking of the trace.
Display of the signal shape:
As the signal is applied to the Y-plates and time base voltage (sweep voltage) to the X-plates, the electron beam is simultaneously subjected to two forces acting in a perpendicular direction. The deflection of the beam at any instant is determined by the resultant of these two forces. Referring to the below fig it is seen that
|
Figure 12: Display of signal shape
- At any instant 1, the input signal (signal voltage) is zero and sweep voltage is (Vx)min, the resultant of the forces due to them acts along the left direction and the beam is deflected to the left extreme.
- At instant 2, the signal amplitude is positive and the sweep voltage is at a lesser negative value. The beam is deflected left upward in the second quadrant of the screen.
- At instant 3, both the input and sweep voltages are zero. The resultant force is zero and the beam stays at the centre of the screen.
- At instant 4, the signal amplitude is negative and the sweep voltage is positive. The beam is deflected to right down in the fourth quadrant of the screen.
- At instant 5, the signal voltage is zero, and the sweep voltage is (vx)max, the electron beam is deflected toward the right extreme along the horizontal direction. Then the beam returns to position 1 and the process repeats.
- By joining the resultant positions of the spot, it is seen that waveform of the input voltage is faithfully displayed.
III) TRIGGER CIRCUIT
To display a stationary wave pattern on the CRO screen, the horizontal deflection should start at the same point of the input signal in each sweep cycle. When it occurs it is said that the horizontal sweep voltage is synchronized with the input signal. If the sweep and signal voltages are not synchronized a standstill pattern is not displayed on the screen; the wave pattern moves continuously to the right or left of the screen.
Thus synchronization is the method of locking the frequency of the time base generator to the frequency of the input signal so that a stationary display of wave pattern is seen on the CRO screen. The signal will be properly synchronized only when its frequency equals the sweep frequency or submultiple of sweep frequency. That is
fsignal = n fsweep
 =
= 
 =
= 
As an example, if the sweep frequency is 50Hz and the signal frequency is 50Hz, one wave is displayed on the screen. On the other hand, if the sweep frequency is 50Hz and the signal frequency is 100Hz, the period of sweep voltage is 20ms, and the period of the signal is 10ms.
In the sweep time which is horizontal trace length, the signal goes through two complete cycles. As a result, the two cycles of the signal voltage are displayed on the screen.
|
Figure 13: Synchronization of sweep and signal voltages
One of the methods of achieving synchronization is the use of a trigger circuit. The trigger circuit initiates the time base so that the horizontal deflection sweeps in synchronization with the vertical signal. For this, a delay line circuit is used which delays the signal before it reaches y-deflecting plates. A part of the output obtained from the vertical amplifier is fed to the trigger generator.
The trigger generator is sensitive to the level of the voltage applied at its input. The circuit monitors the input signal and detects the point when it reaches the selected level while moving towards the selected polarity. When the predetermined level is reached the circuit produces a trigger pulse. This trigger pulse is fed to the time base generator and it acts as a command signal to the time base generator and starts one sweep cycle of the time base.
The sweep voltage is not developed in the trigger mode if the input signal is not given. A portion of the trigger pulse is fed to a second circuit, which produces an unblanking bias voltage to bring the grid of CRT to a potential, which allows the electron beam to appear. Thus a stationary display of the wave is seen only above a predetermined level of the input voltage. It happens in each cycle. Because the signal voltage is initiating the sweep cycle, both voltages will be synchronized. By proper adjustment of controls, the trigger pulse may be made to originate when the input signal is going positive or negative or at any particular voltage level. However, in AUTO trigger mode the trigger circuit will automatically provide a trigger pulse to the sweep generator even when the input signal is not applied to it and the horizontal trace is seen even without signal at Y-input.
IV) VERTICAL CIRCUITS:
The vertical circuits mainly consist of an attenuator and a voltage amplifier. The signal is applied at the Y-input. It goes to the input of the attenuator. The signal amplitude is increased or decreased by changing the amount of attenuation and then fed to the input of the voltage amplifier so that adequate deflection is obtained on the screen.
V) HORIZONTAL CIRCUITS:
The sweep generator output cannot directly drive the horizontal plates. Therefore it must be initially amplified. The horizontal circuits mainly consist of a voltage amplifier. When the sweep selector switch is in the ‘INT’ position, the sweep voltage is applied to the horizontal amplifier. The output of the amplifier is fed to the X-plates and a linear trace is produced on the CRO screen. When the sweep selector switch is held in the ’EXT’ position the horizontal amplifier input is disconnected from the internal sweep generator and is instead connected to the horizontal input jack. In this position, the electron beam remains stationary and produces a luminous spot on the CRO screen.
VI) LOW VOLTAGE POWER SUPPLY
The low voltage power supply powers the electronic circuits such as amplifiers, time base generator, trigger circuit. It gives an output of the order of few tens to a few hundreds of volts.
VII) HIGH VOLTAGE POWER SUPPLY
The high voltage power supply provides voltages to anodes in the electron gun assembly. It supplies voltages of the order of 1600V to 2200V.
DELAY LINE
All electronic circuitry in the CRO causes a certain amount of time delay in the transmission of signal voltages to the deflection plates. Comparing the vertical and horizontal circuits in the CRO block diagram, we obtain that a portion of the output signal applied to the vertical CRT plates triggers the horizontal signal. Signal processing in the horizontal circuit consists of generating a trigger pulse that starts the time base generator (sweep generator) then the output of this is given to the horizontal amplifier and then to the horizontal plates. This whole process takes time. The signal of the vertical CRT plates must therefore be delayed by the same amount of time to reach the signal at the same instant as that of a horizontal one. This is the function of the delay line.
Key Takeaways
- Cathode Ray Oscilloscope is a very important electronic measuring instrument that is used to display and measure electrical signals, time intervals, and phase shift between two electrical signals.
- Non-electrical quantities such as pressure, strain, and temperature can be measured by first converting them into an equivalent voltage using an appropriate transducer.
- Any CRO consists of the following seven major sections - Cathode Ray Tube (CRT), Timebase circuits, Trigger circuits, Vertical Circuits, Horizontal Circuits, High Voltage Power Supply, Low Voltage Power Supply
- The Delay line is because the electronic circuitry in the CRO causes a certain amount of time delay in the transmission of signal voltages to the deflection plates.
CRT (Cathode Ray Tube):
A Cathode Ray Tube (CRT) is a specially constructed vacuum tube in which an electron beam controlled by electric or magnetic fields generates a visual display of input electrical signals on a fluorescent screen.
Construction
It consists of three important parts,
i) Electron Gun
ii) Deflection System
iii) Fluorescent Screen
|
Figure 14: CRT (Cathode Ray Tube)
The CRT resembles a horizontally placed conical flask sealed at its open end.
The electron gun consisting of several electrodes is mounted at one end of the tube as a single unit and electrical connections are given to them through base pins. The deflection system consists of two pairs of parallel metal plates mounted in the neck of the tube. They are oriented in such a way that they are in mutually perpendicular directions to the axis of the CRT. The screen consists of a thin coating of phosphors deposited on the inner face of the wide end of the glass envelope. The inner surface of the flare of the envelope is coated with conductive graphite called acquadag. A power supply provides the required potentials to the various elements of CRT.
Working
In the CRT, the electron gun generates an electron beam, focuses it, and accelerates it towards a fluorescent screen located at the further end of the tube. The electron beam may be moved to any spot on the screen with the help of a deflection system.
I) Electron Gun: The indirectly heated cathode K emits a stream of electrons from its coated front face. The electrons pass through the control grid G held at a negative potential. The effective size of the aperture in the grid varies depending upon the potential difference between grid and cathode. The intensity of the glow produced at the screen is determined by the number of electrons striking the screen. Therefore by varying the negative dc voltage on the grid, the intensity of the luminous spot on the screen is controlled. The grid bias is usually varied between 0 to -50V. The anodes A1 and A3 are internally connected and held at a higher positive potential of a few kilovolts and A2 is maintained at a relatively low positive potential. The anode A1 accelerates the incoming electrons. The Grid G and anode A1 forms the first lens system which prefocusses the electron beam. The anode A2 and A3 constitute the second lens system which focuses the electron beam to a fine point on the fluorescent screen. The focus of the beam is adjusted by varying the positive potential on A2. The anode A3 imparts further acceleration to the electrons as they emerge out of the electron gun.
II) Deflection System: There are two types of deflection system namely electrostatic type and electromagnetic type.
In the electrostatic deflection system, two pairs of metal plates are employed for deflecting the electron beam. The two plates in each pair are aligned strictly parallel to each other as shown in the figure and the two pairs of plates are mounted at right angles to each other and also at right angles to the path of electrons.
One pair of plates is arranged horizontally. When a potential difference is applied to the plates then the uniform electric field is produced in the vertical direction. The fields act perpendicular to the beam and deflect the beam vertically, so these are called vertical deflecting plates or Y-plates.
The second set of plates is oriented vertically and produces a uniform horizontal field when a potential difference is applied between them. The field acts normal to the beam and deflects the beam horizontally so this set of plates is called horizontal deflection plates or X-plates.
|
Figure 15: Electron beam deflection (a) Vertical deflection (b) Horizontal Deflection
When voltages are not applied to X-plates and Y-plates, the electron beam travels along the CRT axis and strikes the geometrical centre of the viewing screen. When a dc voltage is applied to Y-plates, the electron beam gets deflected vertically and when a dc voltage is applied to the X-plates, the electron beam is deflected horizontally as shown in figures. The amount of deflection depends on the magnitude of the applied voltage. When dc voltages are applied to both the X and Y plates, the electron beam will be acted upon simultaneously by two forces due to vertical and horizontal electric fields and gets deflected along the direction of their resultant is shown in fig. Thus by varying the dc voltages of the vertical and horizontal planes, the luminous spot may be moved to any position in the plane of the screen.
|
Figure 16 (a) Voltage not applied to deflection plates (b) Positive voltage applied to UVDP
III) Fluorescent Screen: The interior surface of the circular front face of the CRT is coated with a thin translucent layer of phosphors. The phosphor coating glows at the point where it is struck by the high energy electron beam. At that spot, the coating continues to glow for a short period even after the electron beam moves away. So electron beam position can be located with the help of a fluorescent screen.
Aquadag Coating
Electrons impinging on the screen tend to charge it negatively and repel the electrons arriving afterward it will reduce the number of electrons reaching the screen leading to a decrease in the brightness of the glow. Therefore the electrons are to be conducted away. Similarly, the cathode assumes gradually a positive charge as electrons are emitted from it in large numbers. It again leads to a reduction in the intensity of the glow on the screen. Therefore the cathode is to be replenished with electrons. This is accomplished by the Aquadag coating. The inner surface of the flare of the glass envelope of CRT is coated with conductive graphite coating called Aquadag. It is used to complete the circuit from screen to cathode. The electrons striking the fluorescent screen not only causes the emission of light but also produce secondary emission of electrons. The secondary electrons are attracted by the Aquadag coating which is electrically connected to anode A3. The electrons are restricted to the cathode through the ground.
The electrostatic CRT is used in CRO as a display device and study of waveforms.
Key Takeaways
- The electrostatic CRT is used in CRO as a display device and study of waveforms.
- A Cathode Ray Tube (CRT) is a specially constructed vacuum tube in which an electron beam controlled by electric or magnetic fields generates a visual display of input electrical signals on a fluorescent screen.
- It consists of three important parts: Electron Gun, Deflection System, Fluorescent Screen
TIME BASE CIRCUIT
The faithful display of the signal variation by the electron beam requires the beam to move horizontally at a uniform rate across the screen, covering equal distances in equal intervals of time. This condition is satisfied by ramp voltage or saw tooth voltage. The ramp voltage is generated by Time Base Circuit.
The time base circuit consists of a time base generator. The time base generator is a variable frequency oscillator that produces an output voltage of sawtooth shape.
|
Figure 17: Time Base Voltage
To obtain a visual display of the waveform of applied voltage, it is necessary to apply this A. C. voltage to one set of the deflection plates say Y-plates, and the other time base voltage or ramp voltage, generated by time base generator, to X-plates.
This time base voltage is periodic in nature and its frequency can be varied. This voltage increases linearly with time and after reaching a maximum value (Vx)max, it suddenly drops to minimum value (Vx)min. When this voltage is applied to the horizontal deflection plates, the luminous spot sweeps the face of the screen at a uniform velocity from the left edge to the right edge depending on the polarity of the voltage. Because of this reason ramp voltage is also called sweep voltage. The deflection of the spot becomes maximum when the voltage reaches the value (Vx)max after which the spot suddenly returns to its original position. If the frequency of the time base voltage is sufficiently high the trace of the spot appears as a straight line.
Due to the resemblance of sweep voltage to teeth of a saw, it is also called saw-tooth voltage.
Sweep Time or Trace Time (ts):
The time taken by the sweep voltage to rise from its maximum negative voltage to its maximum positive voltage is called sweep time or a trace time tS.
Retrace Time or Flyback Time (tr):
The time taken by the sweep voltage to dip from its maximum positive voltage to its maximum negative voltage is called retrace time or fly back time tR.
Sweep Period (Tsweep):
The sum of sweep time and retrace time constitutes the sweep period Tsweep.
Tsweep= ts+ tr ≈ ts
Blanking:
The retrace path, if seen on the screen, gives a bad visual effect. By making the retrace time equal to zero, the retrace path can be eliminated. The trace during the flyback time or retrace time can be made invisible by applying a high negative voltage pulse to the control grid in the electron gun which turns off the electron beam momentarily. The process of making a retrace path invisible is known as Blanking of the trace.
Display of the signal shape:
As the signal is applied to the Y-plates and time base voltage (sweep voltage) to the X-plates, the electron beam is simultaneously subjected to two forces acting in a perpendicular direction. The deflection of the beam at any instant is determined by the resultant of these two forces. Referring to the below fig it is seen that
|
Figure 18: Display of signal shape
- At any instant 1, the input signal (signal voltage) is zero and sweep voltage is (Vx)min, the resultant of the forces due to them acts along the left direction and the beam is deflected to the left extreme.
- At instant 2, the signal amplitude is positive and the sweep voltage is at a lesser negative value. The beam is deflected left upward in the second quadrant of the screen.
- At instant 3, both the input and sweep voltages are zero. The resultant force is zero and the beam stays at the centre of the screen.
- At instant 4, the signal amplitude is negative and the sweep voltage is positive. The beam is deflected to right down in the fourth quadrant of the screen.
- At instant 5, the signal voltage is zero, and the sweep voltage is (vx)max, the electron beam is deflected toward the right extreme along the horizontal direction. Then the beam returns to position 1 and the process repeats.
- By joining the resultant positions of the spot, it is seen that waveform of the input voltage is faithfully displayed.
TRIGGER CIRCUIT
To display a stationary wave pattern on the CRO screen, the horizontal deflection should start at the same point of the input signal in each sweep cycle. When it occurs it is said that the horizontal sweep voltage is synchronized with the input signal. If the sweep and signal voltages are not synchronized a standstill pattern is not displayed on the screen; the wave pattern moves continuously to the right or left of the screen.
Thus synchronization is the method of locking the frequency of the time base generator to the frequency of the input signal so that a stationary display of wave pattern is seen on the CRO screen. The signal will be properly synchronized only when its frequency equals the sweep frequency or submultiple of sweep frequency. That is
fsignal = n fsweep
 =
= 
 =
= 
As an example, if the sweep frequency is 50Hz and the signal frequency is 50Hz, one wave is displayed on the screen. On the other hand, if the sweep frequency is 50Hz and the signal frequency is 100Hz, the period of sweep voltage is 20ms, and the period of the signal is 10ms.
In the sweep time which is horizontal trace length, the signal goes through two complete cycles. As a result, the two cycles of the signal voltage are displayed on the screen.
|
Figure 19: Synchronization of sweep and signal Voltages
One of the methods of achieving synchronization is the use of a trigger circuit. The trigger circuit initiates the time base so that the horizontal deflection sweeps in synchronization with the vertical signal. For this, a delay line circuit is used which delays the signal before it reaches y-deflecting plates. A part of the output obtained from the vertical amplifier is fed to the trigger generator.
The trigger generator is sensitive to the level of the voltage applied at its input. The circuit monitors the input signal and detects the point when it reaches the selected level while moving towards the selected polarity. When the predetermined level is reached the circuit produces a trigger pulse. This trigger pulse is fed to the time base generator and it acts as a command signal to the time base generator and starts one sweep cycle of the time base.
The sweep voltage is not developed in the trigger mode if the input signal is not given. A portion of the trigger pulse is fed to a second circuit, which produces an unblanking bias voltage to bring the grid of CRT to a potential, which allows the electron beam to appear. Thus a stationary display of the wave is seen only above a predetermined level of the input voltage. It happens in each cycle. Because the signal voltage is initiating the sweep cycle, both voltages will be synchronized. By proper adjustment of controls, the trigger pulse may be made to originate when the input signal is going positive or negative or at any particular voltage level. However, in AUTO trigger mode the trigger circuit will automatically provide a trigger pulse to the sweep generator even when the input signal is not applied to it and the horizontal trace is seen even without signal at Y-input.
Key Takeaways
- The ramp voltage is generated by Time Base Circuit.
- The time base circuit is the faithful display of the signal variation by the electron beam that requires the beam to move horizontally at a uniform rate across the screen, covering equal distances in equal intervals of time. This condition is satisfied by ramp voltage or saw tooth voltage.
- The use of the trigger circuit is achieving synchronization.
- The trigger circuit initiates the time base so that the horizontal deflection sweeps in synchronization with the vertical signal.
- Synchronization is the method of locking the frequency of the time base generator to the frequency of the input signal so that a stationary display of wave pattern is seen on the CRO screen.
- The signal will be properly synchronized only when its frequency equals the sweep frequency or submultiple of sweep frequency. That is
fsignal = n fsweep
 =
= 
 =
= 
The cathode ray oscilloscope is an electronic test instrument; it is used to obtain waveforms when the different input signals are given. In the early days, it is called an Oscillograph. The oscilloscope observes the changes in the electrical signals over time, thus the voltage and time describe a shape and it is continuously graphed beside a scale. By seeing the waveform, we can analyze some properties like amplitude, frequency, rise time, distortion, time interval, etc.
|
Figure 20:CRO
The main applications of CRO are to observe the properties of electrical and electronic signals, oscillation distortion testing, the frequency response of signals, etc. The important uses of CRO are the measurement of voltage, current, frequency, etc.
Application of CRO
1. There are huge applications of CRO in Radio stations. Indeed, our conventional CRO is not used in those radio stations but they almost the same as our conventional CRO. The CROs are used in the radio station to observe the sending and receiving signal properties.
2. CRO helps to view the characteristics and property of a signal that is why it also helps to control the analog signals.
3. The shape of voltage and current waveform can be observed by CRO which helps to take the necessary decision in a radio station or communication station.
4. CRO is used for research purposes. When scientists are designed a new circuit, they check the voltage, current waveforms of each part of the circuit using the Cathode Ray Oscilloscope.
5. CRO is used with the resonance circuit to observe the bandwidth, wave shape, etc.
6. CRO is also used to observe the characteristics of Amplitude Modulation Circuits, Frequency Modulation Circuits, etc.
USE OF CRO (CATHODE RAY OSCILLOSCOPE)
The CRO is a versatile electronic instrument and it is used in measuring a variety of electrical parameters.
a) Study of the WaveForms: CRO is widely used in maintenance and troubleshooting where the wave shapes of voltages in different electronic circuits are to be examined. The signal under study is applied at the Y-input terminal and the sweep voltage is internally applied to X-plates. The size of the figure displayed on the screen may be adjusted suitably by adjusting the gain control.
b) Measurement of D. C. Voltages: The D. C. voltage understudy is applied at Y-input. The trace gets deflected upward or downward depending upon the polarity of the applied voltage. The deflection of the spot produces on the screen can be measured and by multiplying it with the deflection sensitivity (volts/div), the magnitude of unknown voltage can be obtained.
c) Measurement of A. C. Voltages: For this measurement, the trace is to be adjusted at the center of the screen, and the A. C. voltage understudy is applied at Y-input. The peak to peak distance is measured and by multiplying it with deflection sensitivity (volts/div), peak to the peak value of applied A. C. voltage can be calculated. The rms value and average value of the voltage are calculated using the formulae,
VP = 
Vrms 
Vaver = 0. 636 
d) Measurement of Current: We can measure the value of current or magnitude and direction of current using CRO. By calculating the amplitude variation, horizontal and vertical cells in the CRO screen we can measure the current. We can measure both AC and DC in CRO.
For this measurement, the current has to be passed through the suitable known resistor and the potential developed across it can be measured as has been explained above. The current may then be calculated. However, if the cathode ray oscilloscope having a magnetic deflection system, the currents may be measured by passing it through one of the deflection coils.
e) Measurement of Frequency:
We not only measure voltage and current using CRO, but we can also measure the frequency of a signal by calculating the period. Once we measure the period of a signal then we can easily measure the frequency. The measurement of the period using CRO also very easy.
1) Calibration Method: A sinusoidal signal whose frequency is to be determined is applied to Y-input. The time base control is adjusted to obtain 2 or 3 cycles of the signal on the screen. The horizontal spread of one cycle is noted. By multiplying it with the time base sensitivity (time/div), the period of the signal is obtained. The reciprocal of the period gives the frequency of the signal.
2) Lissajous Method: Alternatively, the frequency of a test signal can be determined using Lissajous patterns. When two sine waves oscillating in mutually perpendicular planes are combined, different types of closed-loop patterns are obtained. They are called Lissajous patterns in honour of the French physicist Lissajous. The signal of unknown frequency is applied to vertical input (Y) and a voltage of known frequency obtained from the standard variable frequency generator is given to horizontal input (X). The frequency of this frequency generator can be varied until a suitable stationary Lissajous figure is obtained. Knowing the frequency from the frequency generator and counting the number of tangency points along horizontal and vertical axes, the unknown frequency can be determined. If fY and fX are the unknown and known frequencies of the sinusoidal voltage fed to the vertical and horizontal plates of CRO respectively and nx and ny are the number of tangency points along the X and Y-axis respectively then the unknown frequency is calculated from
 ………(1)
Where fx is the known frequency. Examples of measurements are:
|
Figure 21: Measurement of Frequency
f) Measurement of phase difference:
Most of the CROs have two channels. We can apply two different signals at a time on the CRO. And we can measure easily the phase difference between the two different signals. Lissajous figures in the CRO screen help us to measure the phase difference between two signals. Using this method we can also measure the frequency of two signals at a time.
(i) Dual Sweep Method: It requires a dual trace CRO. The phase relationship between two sinusoidal signals of the same frequency may be directly measured by displaying both waveforms on the CRO screen and determining the delay time between the two waveforms.
|
Figure 22: Measurement of the phase difference
The sensitivity and trigger controls of each channel are adjusted for two stationary sinusoidal signals. The sweep speed is initially adjusted such that the period T of the sine wave is measured. Then the sweep speed is increased and the delay time Td between the two sine waves is accurately determined. The difference is calculated using the relation
= 
(ii) Lissajous Pattern Method: A second method for determining the phase difference of two sine waves of the same frequency is to feed one sine wave to vertical input and another sine wave to horizontal input. The sweep selector switch is kept in EXT position. A Lissajous pattern namely an ellipse is obtained on the screen. By measuring the lengths A= 2Y1and B=2Y2 of the elliptical
= sin-1(  )
)
Pattern the phase shift is calculated.
= sin-1 
|
Figure 23: Lissajous Pattern Method
Key Takeaways
- The main applications of CRO are to observe the properties of electrical and electronic signals, oscillation distortion testing, the frequency response of signals, etc. The important uses of CRO are the measurement of voltage, current, frequency, etc.
- The CRO is a versatile electronic instrument and it is used in measuring a variety of electrical parameters such as the Study of the waveforms, Measurement of D.C. Voltages, A.C. Voltages, Current, Frequency, and phase difference.
German physicist Wilhelm Roentgen, Professor of Physics in discovered X-rays in 1895—accidentally—while testing whether cathode rays could pass through glass. William Roentgen is honoured with Nobel Prize in 1901.
An X-ray is a packet of electromagnetic energy known as a photon that originates from the electron cloud of an atom. This is generally caused by energy changes in an electron, which moves from a higher energy level to a lower one, causing the excess energy to be released. X-rays are similar to gamma rays however the main difference is the way they are produced; X-rays are produced by electrons external to the nucleus. Traditionally X-rays had longer-wavelengths and lower energy than gamma rays.
They are high energy photons (1- 100Kev) or electromagnetic radiation, having a very short wavelength of the order of 1 Å. Typical x-ray wavelength lies between the range of 1 Å and 100 Å. Accordingly, they are classified into hard X-rays and soft X-rays.
Soft X-rays have relatively short wavelengths of about 10 nanometres (a nanometre is one-billionth of a meter), and so they fall in the range of the electromagnetic (EM) spectrum between ultraviolet (UV) light and gamma-rays.
Hard X-rays have wavelengths of about 100 Pico meters (a Pico meter is one-trillionth of a meter). These electromagnetic waves occupy the same region of the EM spectrum as gamma-rays. The only difference between them is their source: X-rays are produced by accelerating electrons, whereas gamma-rays are produced by atomic nuclei in one of four nuclear reactions.
- X-rays are electromagnetic waves having a wavelength in the range from 1 Å to 100 Å.
- X-rays are high-energy waves as compared to visible light, UV, infrared radiations, microwaves, and radio waves.
- They have a shorter wavelength of the electromagnetic spectrum.
- X-rays can ionize atoms and molecules of matter.
- They travel by a velocity of light i. e. 3 x10⁸ ms-1 in vacuum or air.
- They are not deflected by magnetic or electric fields and, therefore, do not possess any charge.
- An X-ray can produce a photoelectric effect.
- X-rays can affect photographic plates.
- X-rays can ionize a gas through which they pass.
- X-rays can be made to reflect, refract, and diffract. X-rays show the phenomenon of interference and polarization.
- X-rays can produce fluorescence in certain metals.
- When certain x-rays fall on certain metals, secondary X-rays are produced.
- They show particle-like properties in interacting with the matter as in photoelectric effect and Compton Effect.
- Frequency = 3×10¹⁶ to 3×10¹⁹ Hz
- Energy = 0. 1 to 100 keV
- Requires high voltage to produce X-Rays.
- They are capable of traveling in a vacuum.
- They are pure energy.
- They can penetrate various objects.
- They induce colour changes of Methylene and sodium platinocyanide.
- They destroy the fermenting power of enzymes.
Origin of Continuous X-ray Spectra
The line spectrum of an element originates when electrons are expelled from the inner shells of its atoms and the electrons from higher levels fall into these vacancies in the inner shells. Each such transition causes energy loss equal to the energy difference of shells which appears as an X-ray photon.
Continuous X-ray spectrum is the result of the inverse photoelectric effect. Continuous X-ray is produced by the phenomenon of “Bremsstrahlung” which is a German word meaning “breaking radiation”. Electrons are emitted from the cathode in the X-rays are accelerated towards the target or plate and strike it, penetrate deep into the interior of its atoms, and are attracted by the nuclei due to strong electrostatic interaction. The electron, therefore, deviates from its original path as shown in figure
|
Figure 24: Electron deviates from its original path
The deviation of the electron from its straight-line path is equivalent to its collision with the nucleus. The electrons are losing more of their kinetic energy due to the collision.
This energy appears as an X-ray photon.
Ei & Ef are initial kinetic energy and the final kinetic respectively.
Ei - Ef h
The electron may suffer several collisions with various nuclei before coming to rest and each collision is accompanied by the emission of an X-ray photon. Hence, several photons of different frequencies are emitted. As there are large numbers of electrons in the beam and each electron collision in a different way, we get photons of almost all frequencies or wavelengths, thus producing a continuous X-ray spectrum.
According to classical theory, the continuous X-ray spectrum should consist of all frequencies between zero and infinity. But according to quantum theory, there is a minimum wavelength up to which is the continuous X-ray spectrum extends. To find the value of min, let the velocity of the incident electron decrease from vi to vf due to the interaction with the nucleus. Then the frequency of X-ray photon is given by
h = When an electron is brought to rest by electrostatic interaction, vf =0 and the photon has a maximum frequency or minimum wavelength. hmax = If V is the potential difference between cathode and target or plate the
From (2) and (3), we have hmax = eV ……………. (4) λmin = from (4) we have λmin = λmin =
|
The lowest wavelength limit of continuous spectra is inversely proportional to the accelerating potential of X-ray tube λmin 

Continuous spectrum of X-rays consists of all radiation of all possible X-ray wavelengths within a certain range starting from min (i. e. the wavelength corresponding to minimum energy) onwards. The continuous spectrum is also known as the general spectrum or white spectrum.
The plot of the relative intensity of X-ray spectra versus wavelength in various potential differences applied to an X-ray tube between the cathode and target or plate is shown in the figure. It is clear that by varying the X-ray tube accelerating potential, the min shifts toward left i. e. the X-ray achieve more energy; the intensity of X-rays also increases with voltage.
|
Figure 25: Continuous X-ray spectrum
Key Takeaways
- An X-ray is a packet of electromagnetic energy known as a photon that originates from the electron cloud of an atom.
- This is generally caused by energy changes in an electron, which moves from a higher energy level to a lower one, causing the excess energy to be released.
- Soft X-rays have relatively short wavelengths of about 10 nanometres and hard X-rays have wavelengths of about 100 Pico meters.
- The line spectrum of an element originates when electrons are expelled from the inner shells of its atoms and the electrons from higher levels fall into these vacancies in the inner shells.
- Continuous X-ray spectrum is the result of the inverse photoelectric effect.
- Continuous X-ray is produced by the phenomenon of “Bremsstrahlung”
- The lowest wavelength limit of continuous spectra is inversely proportional to the accelerating potential of X-ray tube λmin


- λmin =
 Å
Å - Continuous spectrum of X-rays consists of all radiation of all possible X-ray wavelengths within a certain range starting from min onwards.
- The continuous spectrum is also known as the general spectrum or white spectrum.
The visible light rays then pass through a sharp edge of an object can form some bright regions inside the geometrical shadow of the object. This is due to the bending nature of light, called diffraction. Diffraction can occur whenever Bragg’s law is satisfied.
LAUE METHOD
The Laue method was the first diffraction method ever used. This method is used to study the orientation of the crystal and to verify crystal symmetry. A beam of white radiation, the continuous spectrum from an x-ray tube, is allowed to fall on a fixed single crystal. The Bragg angle θ is therefore fixed for every set of planes in the crystal, and each set picks out and diffracts that particular wavelength which satisfies the Bragg law for the particular values of d and involved. Each diffracted beam thus has a different wavelength.
|
Figure 26: Laue method
There are two variations of the Laue method, depending on the relative positions of source, crystal, and film. In each, the film is flat and placed perpendicular to the incident beam. The film in the transmission Laue method (the original Laue method) is placed behind the crystal to record the beams diffracted in the forward direction. This method is so-called because the diffracted beams are partially transmitted through the crystal. These curves are generally ellipses or hyperbolas for transmission patterns.
In the transmission Laue method, the film is placed behind the crystal to record beams that are transmitted through the crystal.
One side of the cone of Laue reflections is defined by the transmitted beam. The film intersects the cone, with the diffraction spots generally lying on an ellipse
|
Figure 27: Laue method
In the back-reflection Laue method, the film is placed between the crystal and the x-ray source, the incident beam passing through a hole in the film, and the beams diffracted in a backward direction are recorded. In either method, the diffracted beams form an array of spots on the film as shown in Figure. This array of spots is commonly called a pattern, more specifically, Laue pattern, but the term is not used in any strict sense and does not imply any periodic arrangement of the spots. On the contrary, the spots are seen to lie on certain curves, as shown in the figure for the transmitted pattern. These curves are generally hyperbolas for back-reflection patterns.
In the back-reflection method, the film is placed between the x-ray source and the crystal. The beams which are diffracted in a backward direction are recorded.
One side of the cone of Laue reflections is defined by the transmitted beam. The film intersects the cone, with the diffraction spots generally lying on a hyperbola.
|
Figure 28: Laue method
The spots lying on any one curve are reflections from planes belonging to one zone. This is because the Laue reflections from planes of a zone all lie on the surface of an imaginary cone whose axis is the zone axis. The positions of the spots on the film, for both the transmission and the back-reflection method, depending on the orientation of the crystal relative to the incident beam, and the spots themselves become distorted and smeared out if the crystal has been bent or twisted in any way.
The facts account for the two main uses of the Laue methods include the determination of crystal orientation and the assessment of crystal perfection.
Laue method is useful to decide the crystal symmetry and orientation of the internal arrangement of atoms/molecules in the crystal.
The atomic arrangement in a crystal can be analyzed by studying the positions and intensities of spots in the Laue pattern.
As several wavelengths of X-rays can reflect in different orders from the same set of planes with the different order reflections superimposed on the same spot in the film, the intensity of the spots and hence the cell parameters of a crystal cannot be determined using the Laue method.
For transmission Laue method, the crystal should be thin.
Laue method can be used to study imperfections or strains in the crystal. The presence of the above defects forms streaks instead of spots in the Laue photograph.
Key Takeaways
- Bending nature of light called diffraction
- Diffraction can occur whenever Bragg’s law is satisfied.
- The Laue method was the first diffraction method ever used. This method is used to study the orientation of the crystal and to verify crystal symmetry.
- Laue method can be used to study imperfections or strains in the crystal.
- The presence of the above defects forms streaks instead of spots in the Laue photograph.
Consider a set of parallel planes called Bragg’s planes. Each atom is acting as a scattering center. The intensity of the reflected beam at certain angles will be maximum when the path difference between two reflected waves from two adjacent planes is an integral multiple of λ.
|
Figure 29: Bragg’s law
Let ‘d’ be the distance between two adjacent planes, 'λ’ be the wavelength of the incident x-ray, ‘θ’ be the glancing angle. The path difference between the rays reflected at A & B is given by
If the two consecutive planes scatter waves in phase with each other, then the path difference must be an integral multiple of the wavelength.
For the reflected light intensity to be maximum, the path difference nλ= 2dsinθ Where ‘n’ is the order of scattering. This is called Bragg’s law Therefore, Bragg’s law states that X-rays diffracted from different parallel planes of a crystal interfere constructively when the path difference is integral multiples of wavelength of X-rays. From Bragg’s law nλ = 2d sin θ, since the maximum possible value for sin θ is 1, nλ/2d ≤ 1 or λ ≤ 2d. This sets the limitation on the wavelength, i. e. in order to get the diffraction pattern by a crystal, the wavelength of X-rays should not exceed twice the inter-planar spacing.
|
Importance of Bragg’s law:
1. Bragg’s law is the essential condition to be satisfied by crystal planes in order to get a diffraction pattern from a crystal.
2. It is used to calculate inter-planar spacing. Knowing the values of inter-planar spacing, lattice parameters can be determined.
Key Takeaways
- Bragg’s law states that X-rays diffracted from different parallel planes of a crystal interfere constructively when the path difference is integral multiples of wavelength of X-rays.
- Bragg’s law is given by nλ= 2dsinθ , Where ‘n’ is the order of scattering.
- Bragg’s law is the essential condition to be satisfied by crystal planes in order to get a diffraction pattern from a crystal.
- It is used to calculate inter-planar spacing.
Bragg's spectrometer used to determine the wavelength of X - rays are shown in Figure. Bragg's spectrometer is similar in construction to an ordinary optical spectrometer.
|
Figure 30: Bragg's Spectrometer
Bragg's Spectrometer consists of a collimator containing two slits S1 and S2. It is made up of lead, through which X-ray is passed. A turntable is situated in front of the collimator on which the crystal is placed. The ionization chamber collects the reflected X-ray
Procedure:
X-rays from an X-ray tube are made to pass through two fine slits S1 and S2 which collimate it into a fine pencil. This fine X-ray beam is then made to fall upon the crystal ’C’ (usually sodium chloride crystal) mounted on the spectrometer table. This table is capable of rotation about a vertical axis and its rotation can be read on a circular graduated scale S. The reflected beam after passing through the slits S3 and S4 enters the ionization chamber. The X-rays entering the ionization chamber ionize the gas which causes a current to flow between the electrodes and the current can be measured by galvanometer G. The ionization current is a measure of the intensity of X-rays reflected by the crystal.
A fine beam of a monochromatic X-ray is made to fall on the crystal. The crystal reflects the X-rays which are collected by the ionization chamber. The turntable is rotated till a sharp increase in the intensity is detected. The sudden increase in intensity suggests that Bragg's Law is satisfied at the given angle θ. Then the inter-planar spacing can be determined by using Bragg's Law nλ = 2d. sinθ. The peak in ionization current occurs more than once for different values of "n"
The ionization current is measured for different values of glancing angle θ. A graph is drawn between the glancing angle θ and the ionization current (Figure).
|
Figure 31: Plot of glancing angle and ionization current
For certain values of glancing angle θ, the ionization current increases abruptly. The first peak corresponds to the first order, the second peak to the second-order, and so on. From the graph, the glancing angles for different orders of reflection can be measured. Knowing the angle θ and the spacing d for the crystal, the wavelength of X-rays can be determined.
Key Takeaways
- Bragg's spectrometer used to determine the wavelength of X - rays
- Knowing the angle θ and the spacing d for the crystal, the wavelength of X-rays can be determined by nλ = 2d.sinθ.
X-rays are types of electromagnetic radiation probably most well-known for their ability to see through a person's skin and reveal images of the bones beneath it. Advances in technology have led to more powerful and focused X-ray beams as well as ever greater applications of these light waves from imaging teeny biological cells and structural components of materials like cement to killing cancer cells.
Most people are familiar with x-rays because of their use in medical imaging but there are many other applications of the radiation:
- In diagnostic medicine, x-rays are used to view bone structures, to detect the breakage in human bones.
- Hard x-radiation is used to minimize the absorption of low energy x-rays. A filter is placed over the x-ray tube to prevent transmission of the lower energy radiation.
- The high atomic mass of calcium atoms in teeth and bones absorbs x-radiation, allowing most of the other radiation to pass through the body.
- Computer tomography (CT scans), fluoroscopy, and radiotherapy are other x-radiation diagnostic techniques.
- X-rays may also be used for therapeutic techniques, such as cancer treatments.
- X-rays are used for crystallography, astronomy, microscopy, industrial radiography, spectroscopy, fluorescence and to implode fission devices.
- X-rays may be used to create art and also to analyze paintings.
- Banned uses include x-ray hair removal and shoe-fitting fluoroscopes, which were both popular in the 1920s.
- They are used for medical purposes
- X-rays are used for airport security. They are used as a scanner to scan the luggage of passengers in airports, rail terminals, and other places.
- It is emitted by celestial objects and is studied to understand the environment.
- It is widely used to detect defects in the welds.
Key Takeaways
- X-rays are types of electromagnetic radiation probably most well-known for their ability to see through a person's skin and reveal images of the bones beneath it.
- Powerful and focused X-ray beams have greater applications from imaging teeny biological cells and structural components of materials like cement to killing cancer cells.
In his 1923 experiment, Compton provided the most conclusive confirmation of the particle aspect of radiation.
By scattering X-rays off free electrons, he found that the wavelength of the scattered radiation is larger than the wavelength of the incident radiation. This can be explained only by assuming that the X-ray photons behave like particles.
According to classical physics, the incident and scattered radiation should have the same wavelength.
Also, we know that the energy of the X-ray radiation is too high to be absorbed by a free electron therefore the incident X-ray would then provide an oscillatory electric field which sets the electron into oscillatory motion, hence making it radiate light with the same wavelength but with an intensity I that depends on the intensity of the incident radiation I0
But neither of these two predictions of classical physics is compatible with experiment.
|
Figure 32s: Elastic scattering of a photon from a free electron
By experiment Compton reveals that the wavelength of the scattered X-radiation increases by an amount  , called the wavelength shift and that
  depends not on the intensity of the incident radiation, but only on the scattering angle.
Compton succeeded in explaining his experimental results only after treating the incident radiation as a stream of particles—photons—colliding elastically with individual electrons.
Here we will discuss the elastic scattering of a photon from a free-electron as shown in the figure. Consider that the incident photon, of energy E =hν and momentum p = hν /c, collides with an electron that is initially at rest. If the photon scatters with a momentum
Which leads
Energy Conservation The energies of the electron before and after the collision are given, respectively, by E0 =mec2 ………. . (3)
Since the energies of the incident and scattered photons are given by E = hν and E0 = hν’, respectively, conservation of energy dictates that E + E0 = E’ + Ee ………. . (4)
Which leads to
Squaring both sides of (5) and simplifying, we get
Hence wavelength shift is given by
Where λC = h/mec = 2. 426 x 10-12 m is called the Compton wavelength of the electron.
This relation connects the initial and final wavelengths to the scattering angle. Compton’s experimental observation:
Example High energy photons are scattered from electrons initially at rest. Assume the photons are backscattered and their energies are much larger than the electron’s rest-mass energy, E = mec2. (a) Calculate the wavelength shift. (b) Show that the energy of the scattered photons is half the rest mass energy of the electron, regardless of the energy of the incident photons. (c) Calculate the electron’s recoil kinetic energy if the energy of the incident photons is 150 MeV.
Solution: (a) In the case where the photons backscatter i. e. θ = π The wavelength shift becomes
(b) Since the energy of the scattered photons E’ is related to the wavelength
Where E = hc/
(c) If E = 150 MeV, the kinetic energy of the recoiling electrons can be obtained from the conservation of energy Ke = E – E’
Example X-rays with an energy of 300 keV undergo Compton scattering with a target. If the scattered X-rays are detected at 30° relative to the incident X-rays, determine the Compton shift at this angle, the energy of the scattered X-ray, and the energy of the recoiling electron.
Solution: The Compton shift When it is scattered through an angle θ by an electron: λ′−λ= λe(1−cosθ) We know Compton wavelength of the electron λe= h/mec= 2. 43 pm me mass of the electron = 511 keV/c2 θ = 30° Compton shift is λ′−λ= λe(1−cosθ) = 2. 426 x 10-12 m (1−cos30◦. ) = 0. 325 pm The energy E′ of the scattered photon is E′=hc/ λ′ And λ=hc/E E=300 keV is the wavelength of the incoming photon. It follows that E′= 278 keV. By conservation of energy, the energy lost by the photon in the collision is converted into kinetic energy K of the recoiling electrons K= 22 keV |
Key Takeaways
|
Reference Books
I. Engineering physics- Gaur and Gupta, & S. Chand Publication
2. Engineering physics - Avadhanalu and Kshirsagar, S. Chand Publication
3. Introduction to Solid State Physics -- Charles Kittel
4. Solid State Physics -- S. O. Pillai
5. Engineering physics- Hitendra K Malik, A. K. Singh, Tata McGraw Hill Education Private Limited, New Delhi
6. Essential University Physics Volume – l and 2 Richard Wolfson, Pearson, Noida 7. Engineering Physics Dattu R Joshi Tata Mc-Graw Hill Education Private Limited
