UNIT- 4
WAVE OPTICS & ELECTRON BALLISTICS
4.1.1 INTERFERENCE
Interference in light waves occurs whenever two or more waves overlap at a given point.
TYPES OF INTERFERENCE
The interference of light waves can be either constructive interference or destructive interference.
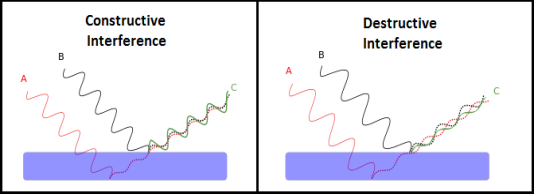
- Constructive Interference: Constructive interference takes place when the crest of one wave falls on the crest of another wave such that the amplitude is maximum. These waves will have the same displacement and are in the same phase.
- Destructive Interference: In destructive interference, the crest of one wave falls on the trough of another wave such that the amplitude is minimum. The displacement and phase of these waves are not the same.
|
Figure 1: Constructive interference & destructive interference
Light waves also interfere with each other. Fundamentally, all interference associated with light waves arises when the electromagnetic fields that constitute the individual waves combine.
If two light bulbs are placed side by side, no interference effects are observed because the light waves from one bulb are emitted independently of those from the other bulb. The emissions from the two light bulbs do not maintain a constant phase relationship with each other over time. Light waves from an ordinary source such as a light bulb undergo random phase changes in time intervals less than a nanosecond.
COHERENT SOURCES
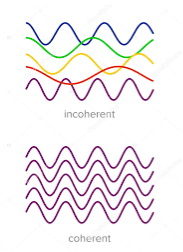
Interference from such waves happen all the time, the randomly phased light waves constantly produce bright and dark fringes at every point. But, we cannot see them since they occur randomly. A point that has a dark fringe at one moment may have a bright fringe at the next moment. This cancels out the effect of the interference effect, and we see only an average brightness value. The interference is not said to be sustained since we cannot observe it.
Definition: - A predictable correlation of the amplitude and phase at any one point with another point is called coherence.
|
Figure 2: Incoherence & coherence
Two waves are said to be coherent, the waves must have
In the case of conventional light, the property of coherence exhibits between a source and its virtual source whereas in the case of laser the property coherence exists between any two or more light waves.
There are two types of coherence
i) Temporal coherence
ii) Spatial coherence
TEMPORAL COHERENCE (OR LONGITUDINAL COHERENCE): -
The predictable correlation of amplitude and phase at one point on the wave train w.r. at another point on the same wave train, then the wave is said to be temporal coherence
To understand this, let us consider two points P1 and P2 on the same wave train, which is continuous as shown in the figure.
|
Figure 3: Wave train
Suppose the phase and amplitude at any one point is known, then we can easily calculate the amplitude and phase for any other point on the same wave train by using the wave equation
y= a sin ( (ct-x))
Where ‘a’ is the amplitude of the wave and ‘x’ is the displacement of the wave at any instant of time ‘t’.
SPATIAL COHERENCE (OR TRANSVERSE COHERENCE)
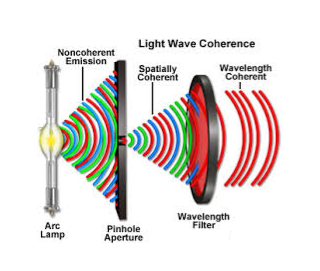
The predictable correlation of amplitude and phase at one point on the wave train w. r .t another point on a second wave, then the waves are said to be spatial coherence (or transverse coherence)
|
Figure 4: Spatial Coherence
CONDITIONS OF INTERFERENCE
- The sources must be coherent, that is, they must maintain a constant phase with respect to each other.
- The two light sources must emit continuous waves of the same wavelength and have the same period.
- The distance between the two sources of light must be small. This gives large fringe width so that the fringes are separately visible.
- The sources should be monochromatic, that is, of a single wavelength.
- The two light sources must emit waves in nearly the same direction.
- The light source must be a point source.
- The distance between the two sources and the screen must be large. This gives again large fringe width so that the fringes are separately visible.
4.1.2 INTERFERENCE DUE TO THIN FILMS OF UNIFORM
A film of thickness from 0.5 to 10 μm is a transparent medium of glass, mica, air enclosed between glass, soap film, etc. When the light is made incident on this thin film partial reflection and partial refraction occur from the top surface of the film. The refracted beam travels in the medium and again suffers partial reflection and partial refraction at the bottom surface of the film. In this way several reflected and refracted rays are produces by a single incident ray. As they move are superimposed on each other and produces interference pattern.
|
Figure 5: Thin Films
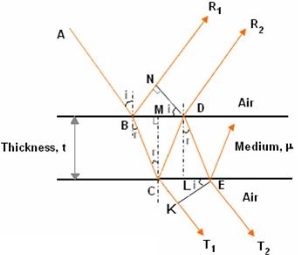
Consider a thin film of uniform thickness ‘t’ and refractive index μ bounded between air. Let us consider monochromatic ray AB is made incident on the film, at B part of ray is reflected (R1) and a part is refracted along BC. At C The beam BC again suffer partial reflection and partial refraction; the reflected beam CD moves again suffer partial reflection and partial refraction at D. The refracted beam R2 moves in air. These two reflected rays R1 and R2 interfere to produce interference pattern.
|
Figure 6: Interference due to thin films of uniform
The optical path difference between the two reflected rays
In ΔBDN, sin i = BN / BD and BC = CD as ΔBMC ≡ ΔMCD, therefore
In ΔBMC, cos r = t /BC, therefore
In ΔBMC, tan r = BM / t, therefore
Correction on account of phase change at reflection: When a beam is reflected from a denser medium (ray R1 at B), a path change of λ/2 occur for the ray.
Therefore, the true path difference is Condition of Maxima (Bright Fringe) Maxima occur when path difference
Condition for Minima (Dark Fringe) Minima occur when path difference
INTERFERENCE IN THIN FILM (TRANSMITTED RAYS) The optical path difference between transmitted rays T1 and T2 will be This path difference is calculated in the same way as above to get
Condition of Maxima (Bright Fringe) Maxima occur when path difference,
Condition for Minima (Dark Fringe) Minima occur when path difference,
|
4.1.3 INTERFERENCE DUE TO THIN FILMS OF NON-UNIFORM THICKNESS
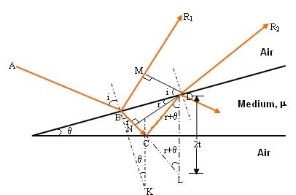
The wedge shaped film has a thin film of varying thickness, having thickness zero at one end and increases at the other. The angle of wedge is θ. Wedge shaped film is one whose surface are inclined at an angle θ of refractive index μ bounded by non-uniform thickness.
|
Figure 7: Interference due to non-uniform films
The optical path difference between the two reflected rays R1 and R2 will be
From the geometry
As in ΔBMD;
Or Thus
As in ΔNDL
|
Correction on account of phase change at reflection: when a beam is reflected from a denser medium (ray R1 at B), a path change of  /2 occur for the ray.
Therefore, the true path difference is
Condition of Maxima (Bright Fringe) Maxima occur when path difference,
Condition for Minima (Dark Fringe) Minima occur when path difference
|
PRODUCTION OF COLOURS IN THIN FILMS
When a transparent thin film is illuminated with a white light, coloured fringes are observed. These fringes are due to the interference of light waves reflected from the top and bottom surface of the thin film. The path difference between the reflected waves depends on thickness t of the film, refractive index μ of the film and the angle of refraction r. The reflected light from the thin film of particular thickness t should satisfy the constructive interference condition, i.e.,
2μtcosr=(2n+1)/2
Only this wavelength λ would be present at that point with maximum intensity in the interference pattern in the reflected system. In the interference pattern, each fringe represents the locus of constant film thickness. In such a way, at different portions of the thin film, the reflected light must satisfy the above said condition so that we can observe colours in the interference pattern when thin film is illuminated with white light.
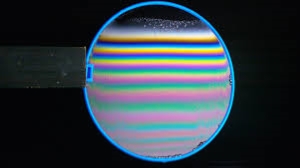
Example: Soap bubble: When white (sun) light is incident on a film of irregular thickness, say soap bubble, at all possible angles, there appears coloured fringes on the film. These fringes are due to interference of light reflected from the two surfaces of the thin film. The interference pattern is produced at a certain place on the soap bubble when its thickness and the angle of incidence of light satisfies the condition of constructive interference for certain wavelength of light. Hence, a soap bubble at that portion would appear with maximum intensity corresponding to that particular wavelength present in the white light. And this happens for each colour in white light. In such away, colours appear on a soap bubble when sunlight is incident on it.
Key Takeaways
- Interference in light waves occurs whenever two or more waves overlap at a given point.
- The interference of light waves can be either constructive interference or destructive interference.
- To obtain sustained interference; the sources must be coherent.
- There are two types of coherence: Temporal coherence & Spatial coherence
- Condition of Maxima (Bright Fringe) and Condition for Minima (Dark Fringe) for thin uniform film
 and
and  respectively.
 - Condition of Maxima (Bright Fringe) and Condition for Minima (Dark Fringe) for thin non-uniform film
 and
and  respectively.
Newton’s Rings are the circular interference pattern first discovered by physicist Sir Isaac Newton in 1704. It is cosists of concentric bright and dark rings with the point of contact of lens and the glass plate as centre,
The fringes obtained by interference of light waves by using the following arrangement
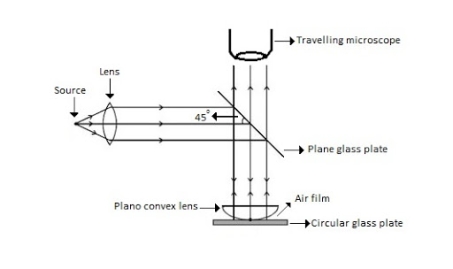
When a Plano convex lens with large radius of curvature is placed on a plane glass plate such that its curved surface faces the glass plate, a wedge air film (of gradually increasing thickness) is formed between the lens and the glass plate. The thickness of the air film is zero at the point of contact and gradually increases away from the point of contact.
|
Figure 8: Newton Ring Assembly
If monochromatic (means light with single wavelength) light is allowed to fall normally on the lens from a source 'S', then two reflected rays R1 (reflected from upper surface of the film) and R2 (reflected from lower surface of the air film) interfere to produce circular interference pattern. This interference pattern has concentric alternate bright and dark rings around the point of contact. This pattern is observed through traveling microscope.
MATHEMATICAL ANALYSIS OF NEWTON’S RING
|
Figure 9: Mathematical analysis of newton’s ring
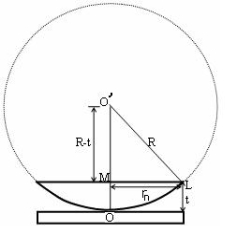
(OL)2 =(O’M)2-(ML)2 ………. (1)
R2=(R-t)2 +rn2
R2=R2 +t2-2Rt +rn2
Radius is large as compared to the thickness
so t2 is neglected as t2<< R2
R2=R2 +-2Rt +rn2
2Rt =rn2
Thickness of the film t =rn2 /2R ………. (2)
THEORY OF FRINGES:
The effective path difference between the two reflected rays R1 and R2 for a wedge shaped film from equation
∆ = 2μtcos(r+θ) +λ/2 ………. (3)
If the light is incident normally on the lens,
r = 0 and near to point of contact θ is small;
Therefore, near point of contact, (r+θ) approaches to 0 and cos(r+θ) =cos0=1
Therefore
∆ = 2μt+λ/2 ………. (4)
Also at point of contact t = 0 therefore the effective path difference ∆ = λ/2
Which is odd multiple of λ/2 Therefore the Central fringe is dark.
BRIGHT FRINGE: CONDITION OF MAXIMA
For the condition of maxima, the effective path difference
∆ = ±nλ
Using equation (4) ∆ = 2μt+λ/2 we have
2μt+λ/2= ±nλ
2μt = ± (2n-1) λ /2 ………. (5)
DIAMETER OF BRIGHT RINGS
we know by equation (2) t =rn2 /2R substitute in equation (5) we have
2μ (rn2 /2R) = ± (2n-1) λ /2
rn2 = ± (2n-1) λR /2μ
We know diameter D=2r and for nth fringe Dn=2rn
so we have Dn2=± 2(2n-1) λR /μ
Dn=
The medium enclosed between the lens and glass plate is if air therefore,  =1. The diameter of nth order bright fringe will be
D= n=0,1,2,3,4……. ………. (6)
The diameter of bright ring is proportional to square root of odd natural numbers
DARK FRINGE: CONDITION FOR MINIMA
For the condition of minima, The effective path difference
∆ =± (2n+1) λ /2
2μt+λ/2 =± (2n+1) λ /2
2μt= ±nλ ………. (7)
it is clear that for particular dark or bright fringe t should be constant.
Every fringe is the locus of points having equal thickness. Hence the fringes are circular in shape.
DIAMETER OF DARK RINGS
we know by equation (2) t =rn2 /2R substitute in equation (7) we have
2μ (rn2 /2R) = nλ
rn2 = nλR/ μ
We know diameter D=2r and for nth fringe Dn=2rn
so we have Dn2= 4nλR/ μ
Dn= 
The medium enclosed between the lens and glass plate is if air therefore,  =1. The diameter of nth order bright fringe will be
Dn=  n=0,1,2,3,4……. ………. (8)
The diameter of dark ring is proportional to square root of natural numbers.
SPACING BETWEEN FRINGES
The Newton’s rings are not equally spaced because the diameter of ring does not increase in the same proportion as the order of ring and rings get closer and closer as ‘n’ increases.
For example the diameter of dark ring is given by Dn=  where n=0,1,2,3,4…….
D3 - D2 = -
-  = (
= ( -
- )
) = 0.635
D7 – D6 = -
-  = (
= ( -
- )
) = 0.392
D10– D9 = -
-  = (
= ( -
- )
) = 0.324
From above result we conclude that the fringe width reduces with increase in n.
APPLICATION OF NEWTON’S RING
- Determination of Wavelength of Light
The diameter of the nth order ring is calculated by subtracting the left and right side position of the microscope. As we know that the square of diameter of nth dark ring is

Therefore, the square of diameter of (n+p) th ring is

Subtracting both the above equation
 ………... (9)
Therefore
 .............(10)
2. Determination of Refractive Index of liquid
In order to determine the refractive index of liquid the Newton’s ring experiment is first performed for the air medium and the difference in the square of the diameter of (n+p) th and nth dark ring is found as discussed above.
 …………. (11)
After this few drops of liquid of μ refractive index is placed on the glass plate. The plano-convex lens is then placed on the glass plate, as a result a film of liquid is formed between the lens and the plate.
The difference in the square of the diameter of (n+p) th and nth dark ring is again calculated in the same manner for the liquid medium.
 ….…. (12)
Dividing equation 2.29 by 2.30, we get
 …….…. (13)
3. Newton’s ring with white light
If the monochromatic source is replaced by the white light, dark and bright fringes are not produced. Because the diameter of the rings depends upon wavelength and it is proportional to the square root of wavelength.
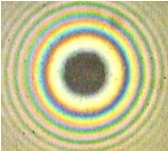
If the monochromatic source is replaced by the white light superposition of rings take place due to different wavelength. Few coloured rings are seen around dark centre later illumination is seen in the field of view. As shown in below figure.
|
Figure 10: Newton’s ring with white light
Example: In a Newton’s rings experiment the diameter of the 15th ring was found to be 0.59 cm and that of the 5th ring is 0.336 cm. If the radius of curvature of the lens is 100 cm, find the wave length of the light.
Solution:
The given data are
Diameter of Newton’s 15th ring (D15) = 0.59 cm = 0.59×10⁻² m
Diameter of Newton’s 5th ring (D5) = 0.336 cm = 0.336 × 10⁻² m
Radius of curvature of lens (R) = 100 cm = 1 m
Wave length of light (λ) =?
Here m is difference between rings = 15-5=10
λ = D2n+m - D2n / 4mR
λ = (0.59×10⁻² )2- (0.336 × 10⁻²)2 / 4 x 10 x 1
λ = 0.3481 x10⁻⁴ – 0.112896 x10⁻⁴ / 40
λ =0.00588 x 10⁻⁴ m
λ =5880 x 10-10 m
λ =5880Å
Key takeaways
- Newton’s Rings consists of concentric bright and dark rings with the point of contact of the lens and the glass plate as centre.
- The diameter of the bright ring is proportional to the square root of odd natural numbers D=
 n=0,1,2,3,4
 - The diameter of the dark ring is proportional to the square root of natural numbers Dn=
 n=0,1,2,3,4
 - The Newton’s rings are not equally spaced because the diameter of the ring does not increase in the same proportion as the order of ring and rings get closer and closer as ‘n’ increases.
- Determination of Wavelength of Light
|
- Determination of Refractive Index of liquid
|
- If the monochromatic source is replaced by the white light, dark and bright fringes are not produced.
Anti-reflective coatings are used in a wide variety of applications where light passes through an optical surface, and low loss or low reflection is desired. Examples include anti-glare coatings on corrective lenses and camera lens elements, and antireflective coatings on solar cells.
Thin film anti-reflection coatings greatly reduce the light loss in multi-element lenses by making use of phase changes and the dependence of the reflectivity on index of refraction. A single quarter-wavelength coating of optimum index can eliminate reflection at one wavelength. Multi-layer coatings can reduce the loss over the visible spectrum.
The idea behind anti-reflection coatings is that the creation of a double interface by means of a thin film gives you two reflected waves. If these waves are out of phase, they partially or totally cancel. If the coating is a quarter wavelength thickness and the coating has an index of refraction less that the glass it is coating, then the two reflections are 180 degrees out of phase.
A single MgF2 (n = 1.38) quarter-wave coating on glass (n = 1.5) substrate reduces its reflectance at normal incidence from 4 to nearly 1.2%. This reduction in reflectance takes place at one particular wavelength. The reflectance increases on either side of this wavelength. To improve the performance of multi-layer AR coatings, we have more variables at our disposal in the forms of the thickness and index of refraction of each of the layers.
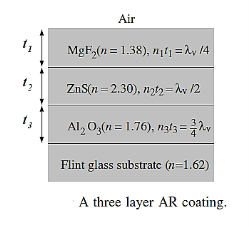
Computer simulations can be carried out to select optimum combinations of thin film coatings to achieve low reflectance over the desired spectral range. Two quarter-wave coatings with materials of high and low indices of refraction can give zero reflectance at two-wavelengths, but reduction in reflectance in the spectral range between the two-wavelengths is rather small. A three-layer coating is more effective in reducing reflectance over a broad spectral range.
|
Figure 11: Three Layer AR coating
Figure shows a sequence of three layers on light flint glass substrate. The reflectance of this combination over most of the visible spectrum is less than 0.03% as compared to 4% reflectance of an air–glass interface and 1.2% reflectance of a MgF2 coated glass substrate. The AR coatings usually have no more than three or four layers and show only marginal degradation in performance for deviations from normal incidence.
Motion of a charged particle in the simultaneous presence of both electric and magnetic fields has variety of manifestations ranging from straight line motion to the cycloid and other complex motion. Both electric and magnetic fields impart acceleration to the charged particle. But, there is a qualification for magnetic field as acceleration due to magnetic field relates only to the change of direction of motion.
Magnetic force being always normal to the velocity of the particle tends to move the particle about a circular trajectory. On the other hand, electric force is along electric field and is capable to bring about change in both direction and magnitude depending upon the initial direction of velocity of the charged particle with respect to electric field. If velocity and electric vectors are at an angle, then the particle follows a parabolic path.
One of the important orientations of electric and magnetic fields is referred as “crossed fields”. We use the term “crossed fields” to mean simultaneous presence of electric and magnetic fields at right angle. The behaviour of charged particles such as electrons under crossed fields has important significance in the study of electromagnetic measurement and application (determination of specific charge of electron, cyclotron etc.).
Before we proceed, we should understand that elementary charged particles have mass of the order of 10−28 kg or less. Therefore, even small electric or magnetic force is capable to generate very high acceleration of the order of 1012 m/s2 or more.
Charged particle is moving along parallel electric and magnetic field
The velocity, electric and magnetic vectors are in in the same direction. Let they are aligned along x-axis. Since magnetic field and velocity vectors are parallel, there is no magnetic force.
FM=v0qBsin0°=0
Where v0 is initial speed of the particle. The charged particle is, however, acted upon by electric field. It is accelerated or decelerated depending on the polarity of charge and direction of electric field.
Considering positive charge, the electric force on the charge is given as
FE=qE
The acceleration of particle carrying charge in x-direction is:
⇒ay= 
The displacement along x-axis after time “t” is given by :
x=v0t+ ayt2
ayt2
x=v0t+ t2
t2
Charge is moving perpendicular to parallel electric and magnetic fields
Let electric and magnetic fields align along y-direction and velocity vector is aligned along positive x-direction. Let the charge be positive and initial velocity be v0.
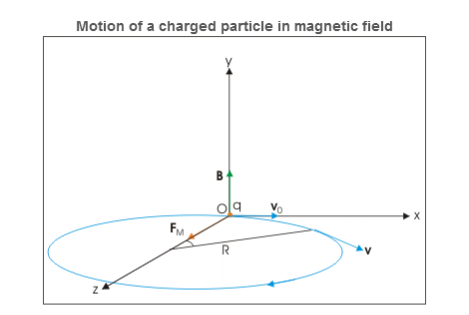
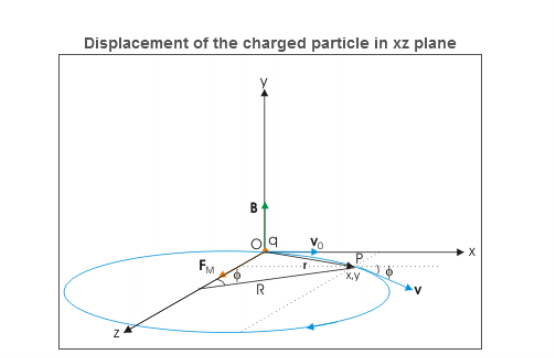
In this case, velocity and magnetic field vectors are perpendicular to each other. Applying Right hand vector cross product rule, we determine that magnetic force is acting in positive z-direction. If electric field is not present, then the particle revolves along a circle in xz plane as shown in the figure below.
|
Figure 12: Motion of charged particle in magnetic field
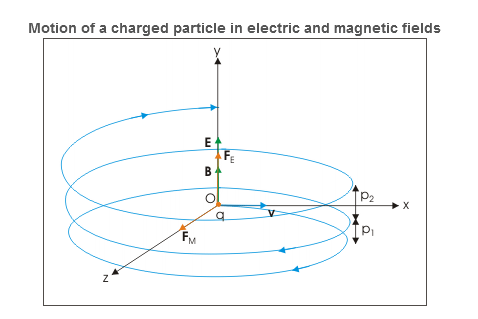
However, electric field in y-direction imparts acceleration in that direction. The particle, therefore, acquires velocity in y-direction and resulting motion is a helical motion. But since particle is accelerated in y –direction, the linear distance between consecutive circular elements of helix increases. In other words, the resulting motion is a helical motion with increasing pitch.
|
Figure 13: Motion of charged particle in Electric field
The radius of each of the circular element and other periodic attributes like time period, frequency and angular frequency are same as for the case of circular motion of charged particle in perpendicular to magnetic field.
R = 
T = 
ν= 
ω=αB
Velocity of the charged particle
The velocity of the particle in xz is:
v=vxi + vzj=v0cosωt i+ vosinωt k
⇒v= v0cosωt i+ vosinωt k
= v0cos(αBt)i+v0sin(αBt)k
where α is specific charge.
We know that magnetic force does not change the magnitude of velocity. It follows then that magnitude of velocity is xy plane is a constant given as:
v2x+v2z=vxy2
But, there is electric field in y-direction. This imparts linear acceleration to the charged particle. As such, the particle which was initially having no component in y direction gains velocity with time as electric field imparts acceleration to the particle in y direction. The velocity components in xz plane, however, remain same. The acceleration in y-direction due to electric field is:
⇒ay=  =
=  =αE
=αE
Since initial velocity in y-direction is zero, the velocity after time t is:
⇒vy=ayt=αEt
The velocity of the particle at a time t, therefore, is given in terms of component velocities as :
v=vxi+ vyj+ vjk
⇒v=v0cos(αBt) i+αEt j+v0sin(αBt) k
Displacement of the charged particle
Component of displacement of the charged particle in xz plane is given as
|
Figure 14: Displacement of the charged particle in xz plane
x=R sin(αBt)=  sin(αBt)
z=R[1−cos(αBt)]=  [1−cos(αBt)]
The motion in y-direction is due to electric force. Let the displacement in this direction be y after time t. Then:
y=  ayt2 =
  t2
t2
The position vector of the particle after time t is :
r=xi+yj+zk
⇒r= sin(αBt)i+
 t2j+
t2j+ [1−cos(αBt)]k
Charge is placed at rest in crossed electric and magnetic fields
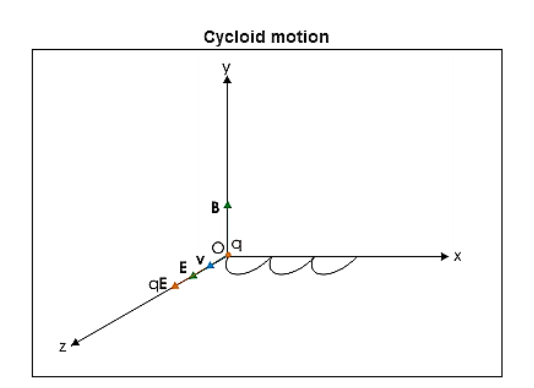
Let electric and magnetic fields are aligned along z and x directions and charge is placed at the origin of coordinate system. Initially, there is no magnetic force as charge is at rest. However, there is electric force, which accelerates the charge in z-direction. As the particle acquires velocity in z-direction, the magnetic force comes into play and tries to rotate the particle in xz plane about a center on x-axis.
|
Figure 15: Cycloid Motion
However, z-component of velocity keeps increasing with time due to electric force in that direction. The magnetic force though draws the charged particle away from z-axis along a curved path. This action of magnetic force is countered by electric force in z-direction. The velocity of charged particle ultimately reduces to zero at x-axis. This cycle repeats itself forming cycloid motion. The cycloid path is generated by a point on the circumference of a rolling wheel.
Key Takeaways
- Motion of a charged particle in the simultaneous presence of both electric and magnetic fields has variety of manifestations ranging from straight line motion to the cycloid and other complex motion.
- One of the important orientations of electric and magnetic fields is referred as “crossed fields”.
- We use the term “crossed fields” to mean simultaneous presence of electric and magnetic fields at right angle.
- The behaviour of charged particles such as electrons under crossed fields has important significance in the study of electromagnetic measurement and application.
- The position vector of the particle after time t is ⇒r=
 sin(αBt)i+
 t2j+
t2j+ [1−cos(αBt)]k
4.5.1 CATHODE RAY TUBE (CRT), CONSTRUCTION AND WORKING
CRT (Cathode Ray Tube):
A Cathode Ray Tube (CRT) is a specially constructed vacuum tube in which an electron beam controlled by electric or magnetic fields generates a visual display of input electrical signals on a fluorescent screen.
Construction
It consists of three important parts,
i) Electron Gun
ii) Deflection System
iii) Fluorescent Screen
|
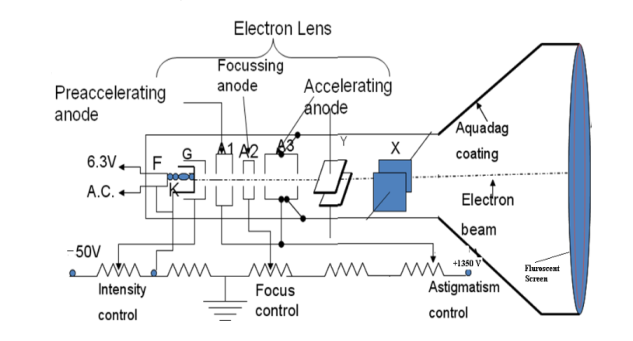
Figure 16: CRT (Cathode Ray Tube)
The CRT resembles a horizontally placed conical flask sealed at its open end.
The electron gun consisting of several electrodes is mounted at one end of the tube as a single unit and electrical connections are given to them through base pins. The deflection system consists of two pairs of parallel metal plates mounted in the neck of the tube. They are oriented in such a way that they are in mutually perpendicular directions to the axis of the CRT. The screen consists of a thin coating of phosphors deposited on the inner face of the wide end of the glass envelope. The inner surface of the flare of the envelope is coated with conductive graphite called acquadag. A power supply provides the required potentials to the various elements of CRT.
Working
In the CRT, the electron gun generates an electron beam, focuses it, and accelerates it towards a fluorescent screen located at the further end of the tube. The electron beam may be moved to any spot on the screen with the help of a deflection system.
I) Electron Gun: The indirectly heated cathode K emits a stream of electrons from its coated front face. The electrons pass through the control grid G held at a negative potential. The effective size of the aperture in the grid varies depending upon the potential difference between grid and cathode. The intensity of the glow produced at the screen is determined by the number of electrons striking the screen. Therefore by varying the negative dc voltage on the grid, the intensity of the luminous spot on the screen is controlled. The grid bias is usually varied between 0 to -50V. The anodes A1 and A3 are internally connected and held at a higher positive potential of a few kilovolts and A2 is maintained at a relatively low positive potential. The anode A1 accelerates the incoming electrons. The Grid G and anode A1 forms the first lens system which prefocusses the electron beam. The anode A2 and A3 constitute the second lens system which focuses the electron beam to a fine point on the fluorescent screen. The focus of the beam is adjusted by varying the positive potential on A2. The anode A3 imparts further acceleration to the electrons as they emerge out of the electron gun.
II) Deflection System: There are two types of deflection system namely electrostatic type and electromagnetic type.
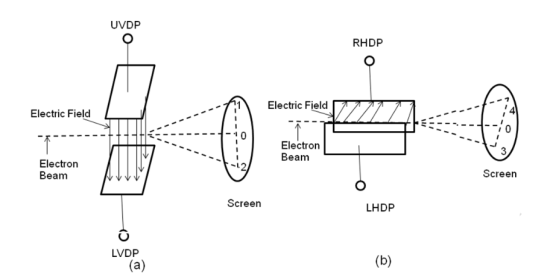
In the electrostatic deflection system, two pairs of metal plates are employed for deflecting the electron beam. The two plates in each pair are aligned strictly parallel to each other as shown in the figure and the two pairs of plates are mounted at right angles to each other and also at right angles to the path of electrons.
One pair of plates is arranged horizontally. When a potential difference is applied to the plates then the uniform electric field is produced in the vertical direction. The fields act perpendicular to the beam and deflect the beam vertically, so these are called vertical deflecting plates or Y-plates.
The second set of plates is oriented vertically and produces the uniform horizontal field when a potential difference is applied between them. The field acts normal to the beam and deflects the beam horizontally so this set of plates is called horizontal deflection plates or X-plates.
|
Figure 17: Electron beam deflection (a) Vertical deflection (b) Horizontal Deflection
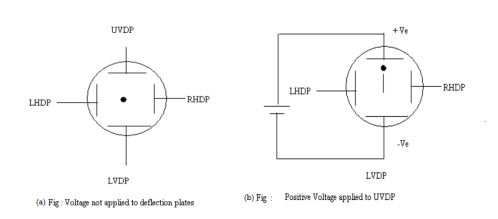
When voltages are not applied to X-plates and Y-plates, the electron beam travels along the CRT axis and strikes the geometrical centre of the viewing screen. When a dc voltage is applied to Y-plates, the electron beam gets deflected vertically and when a dc voltage is applied to the X-plates, the electron beam is deflected horizontally as shown in figures. The amount of deflection depends on the magnitude of the applied voltage. When dc voltages are applied to both the X and Y plates, the electron beam will be acted upon simultaneously by two forces due to vertical and horizontal electric fields and gets deflected along the direction of their resultant is shown in fig. Thus by varying the dc voltages of the vertical and horizontal planes, the luminous spot may be moved to any position in the plane of the screen.
|
Figure 18 (a) Voltage not applied to deflection plates (b) Positive voltage applied to UVDP
III) Fluorescent Screen: The interior surface of the circular front face of the CRT is coated with a thin translucent layer of phosphors. The phosphor coating glows at the point where it is struck by the high energy electron beam. At that spot, the coating continues to glow for a short period even after the electron beam moves away. So electron beam position can be located with the help of a fluorescent screen.
Aquadag Coating
Electrons impinging on the screen tend to charge it negatively and repel the electrons arriving afterward it will reduce the number of electrons reaching the screen leading to a decrease in the brightness of the glow. Therefore the electrons are to be conducted away. Similarly, the cathode assumes gradually a positive charge as electrons are emitted from it in large numbers. It again leads to a reduction in the intensity of the glow on the screen. Therefore the cathode is to be replenished with electrons. This is accomplished by the Aquadag coating. The inner surface of the flare of the glass envelope of CRT is coated with conductive graphite coating called Aquadag. It is used to complete the circuit from screen to cathode. The electrons striking the fluorescent screen not only causes the emission of light but also produce secondary emission of electrons. The secondary electrons are attracted by the Aquadag coating which is electrically connected to anode A3. The electrons are restricted to the cathode through the ground.
The electrostatic CRT is used in CRO as a display device and study of waveforms.
Key Takeaways
- The electrostatic CRT is used in CRO as a display device and study of waveforms.
- A Cathode Ray Tube (CRT) is a specially constructed vacuum tube in which an electron beam controlled by electric or magnetic fields generates a visual display of input electrical signals on a fluorescent screen.
- It consists of three important parts: Electron Gun, Deflection System, Fluorescent Screen
4.5.2 CATHODE RAY OSCILLOSCOPE BLOCK DIAGRAM
(CRO) Cathode Ray Oscilloscope
Cathode Ray Oscilloscope is a very important electronic measuring instrument that is used to display and measure electrical signals, time intervals, and phase shift between two electrical signals. Non-electrical quantities such as pressure, strain, and temperature can be measured by first converting them into an equivalent voltage using an appropriate transducer.
Any CRO consists of the following seven major sections
i) Cathode Ray Tube (CRT)
ii) Time base circuits
iii) Trigger circuits
iv) Vertical Circuits
v) Horizontal Circuits
vi) High Voltage Power Supply
vii) Low Voltage Power Supply
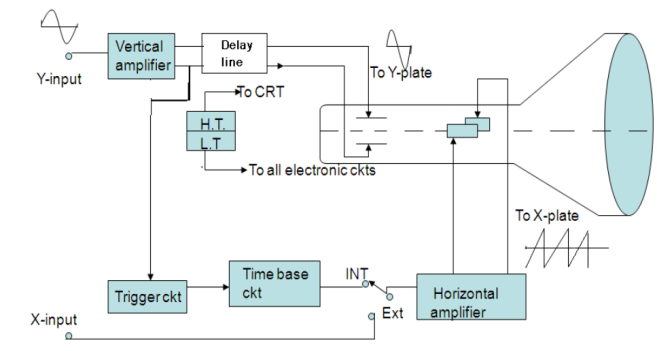
The arrangement of these sections in a CRO is shown in fig in the form of a Block diagram.
|
Figure 19: Block diagram of CRO
CATHODE RAY TUBE (CRT)
A cathode-ray tube with electrostatic deflection forms the central part of a CRO. The CRT generates the electron beam, focuses it, and accelerates it towards the fluorescent screen.
The rest of the sections are electronic circuits that cause the desired movement of a luminous spot on the screen. In its action, the electron beam is similar to a pen. It writes on the fluorescent screen in the form of a bright trace. Writing on paper involves two motions i. e. horizontal motion of the pen sweeping across the page and other is vertical motion of the pen indicating the message. The electron beam should be made to move both horizontally and vertically. A transparent graph called graticule marked in centimeter lines (divisions) both vertically and horizontally is attached to the face of the CRT for making measurements. When a signal is to be displayed, it is applied to the Y-plates of CRO by connecting it to the Y input of CRO.
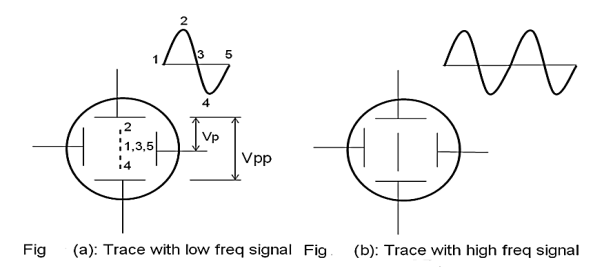
For example, let the signal be a simple harmonic wave. Because of the application of the signal to the Y plates, the luminous spot moves up and down on the screen at the same frequency as that of the applied voltage. The successive positions of the spot can be seen as shown in fig. 10(a)., when the frequency of the signal is less than about 20 Hz. At higher frequencies, the path of the beam is seen as a vertical line (fig 10b). This is due to the persistence of vision and the fluorescence of the coating. The luminous line is called a trace. The length of the vertical trace corresponds to the peak to the peak value of applied voltage.
|
Figure 20: (a) Trace with low frequency signal (b) Trace with high frequency signal
II) TIME BASE CIRCUIT
The faithful display of the signal variation by the electron beam requires the beam to move horizontally at a uniform rate across the screen, covering equal distances in equal intervals of time. This condition is satisfied by ramp voltage or saw tooth voltage. The ramp voltage is generated by Time Base Circuit.
The time base circuit consists of a time base generator. The time base generator is a variable frequency oscillator that produces an output voltage of sawtooth shape.
|
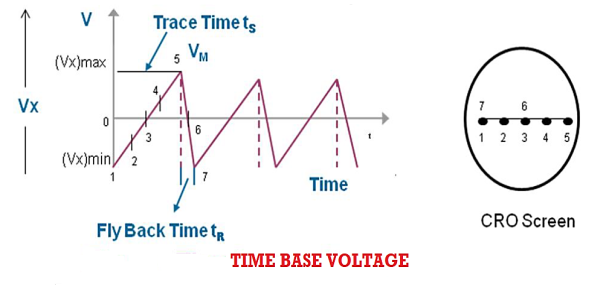
Figure 21: Time base voltage
To obtain a visual display of the waveform of applied voltage, it is necessary to apply this A. C. voltage to one set of the deflection plates say Y-plates, and the other time base voltage or ramp voltage, generated by time base generator, to X-plates.
This time base voltage is periodic and its frequency can be varied. This voltage increases linearly with time and after reaching a maximum value (Vx)max, it suddenly drops to minimum value (Vx)min. When this voltage is applied to the horizontal deflection plates, the luminous spot sweeps the face of the screen at a uniform velocity from the left edge to the right edge depending on the polarity of the voltage. Because of this reason ramp voltage is also called sweep voltage. The deflection of the spot becomes maximum when the voltage reaches the value (Vx)max after which the spot suddenly returns to its original position. If the frequency of the time base voltage is sufficiently high the trace of the spot appears as a straight line.
Due to the resemblance of sweep voltage to teeth of a saw, it is also called saw-tooth voltage.
Sweep Time or Trace Time (ts):
The time taken by the sweep voltage to rise from its maximum negative voltage to its maximum positive voltage is called sweep time or a trace time tS.
Retrace Time or Flyback Time (tr):
The time taken by the sweep voltage to dip from its maximum positive voltage to its maximum negative voltage is called retrace time or fly back time tR.
Sweep Period (Tsweep):
The sum of sweep time and retrace time constitutes the sweep period Tsweep.
Tsweep= ts+ tr ≈ ts
Blanking:
The retrace path, if seen on the screen, gives a bad visual effect. By making the retrace time equal to zero, the retrace path can be eliminated. The trace during the flyback time or retrace time can be made invisible by applying a high negative voltage pulse to the control grid in the electron gun which turns off the electron beam momentarily. The process of making a retrace path invisible is known as Blanking of the trace.
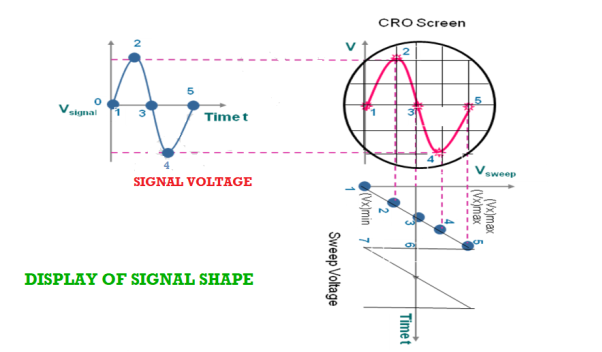
Display of the signal shape:
As the signal is applied to the Y-plates and time base voltage (sweep voltage) to the X-plates, the electron beam is simultaneously subjected to two forces acting in a perpendicular direction. The deflection of the beam at any instant is determined by the resultant of these two forces. Referring to the below fig it is seen that
|
Figure 22: Display of signal shape
- At any instant 1, the input signal (signal voltage) is zero and sweep voltage is (Vx)min, the resultant of the forces due to them acts along the left direction and the beam is deflected to the left extreme.
- At instant 2, the signal amplitude is positive and the sweep voltage is at a lesser negative value. The beam is deflected left upward in the second quadrant of the screen.
- At instant 3, both the input and sweep voltages are zero. The resultant force is zero and the beam stays at the centre of the screen.
- At instant 4, the signal amplitude is negative and the sweep voltage is positive. The beam is deflected to right down in the fourth quadrant of the screen.
- At instant 5, the signal voltage is zero, and the sweep voltage is (vx)max, the electron beam is deflected toward the right extreme along the horizontal direction. Then the beam returns to position 1 and the process repeats.
- By joining the resultant positions of the spot, it is seen that waveform of the input voltage is faithfully displayed.
III) TRIGGER CIRCUIT
To display a stationary wave pattern on the CRO screen, the horizontal deflection should start at the same point of the input signal in each sweep cycle. When it occurs it is said that the horizontal sweep voltage is synchronized with the input signal. If the sweep and signal voltages are not synchronized a standstill pattern is not displayed on the screen; the wave pattern moves continuously to the right or left of the screen.
Thus synchronization is the method of locking the frequency of the time base generator to the frequency of the input signal so that a stationary display of wave pattern is seen on the CRO screen. The signal will be properly synchronized only when its frequency equals the sweep frequency or submultiple of sweep frequency. That is
fsignal = n fsweep
 =
= 
 =
= 
As an example, if the sweep frequency is 50Hz and the signal frequency is 50Hz, one wave is displayed on the screen. On the other hand, if the sweep frequency is 50Hz and the signal frequency is 100Hz, the period of sweep voltage is 20ms, and the period of the signal is 10ms.
In the sweep time which is horizontal trace length, the signal goes through two complete cycles. As a result, the two cycles of the signal voltage are displayed on the screen.
|
Figure 23: Synchronization of sweep and signal voltages
One of the methods of achieving synchronization is the use of a trigger circuit. The trigger circuit initiates the time base so that the horizontal deflection sweeps in synchronization with the vertical signal. For this, a delay line circuit is used which delays the signal before it reaches y-deflecting plates. A part of the output obtained from the vertical amplifier is fed to the trigger generator.
The trigger generator is sensitive to the level of the voltage applied at its input. The circuit monitors the input signal and detects the point when it reaches the selected level while moving towards the selected polarity. When the predetermined level is reached the circuit produces a trigger pulse. This trigger pulse is fed to the time base generator and it acts as a command signal to the time base generator and starts one sweep cycle of the time base.
The sweep voltage is not developed in the trigger mode if the input signal is not given. A portion of the trigger pulse is fed to a second circuit, which produces an unblanking bias voltage to bring the grid of CRT to a potential, which allows the electron beam to appear. Thus a stationary display of the wave is seen only above a predetermined level of the input voltage. It happens in each cycle. Because the signal voltage is initiating the sweep cycle, both voltages will be synchronized. By proper adjustment of controls, the trigger pulse may be made to originate when the input signal is going positive or negative or at any particular voltage level. However, in AUTO trigger mode the trigger circuit will automatically provide a trigger pulse to the sweep generator even when the input signal is not applied to it and the horizontal trace is seen even without signal at Y-input.
IV) VERTICAL CIRCUITS:
The vertical circuits mainly consist of an attenuator and a voltage amplifier. The signal is applied at the Y-input. It goes to the input of the attenuator. The signal amplitude is increased or decreased by changing the amount of attenuation and then fed to the input of the voltage amplifier so that adequate deflection is obtained on the screen.
V) HORIZONTAL CIRCUITS:
The sweep generator output cannot directly drive the horizontal plates. Therefore it must be initially amplified. The horizontal circuits mainly consist of a voltage amplifier. When the sweep selector switch is in the ‘INT’ position, the sweep voltage is applied to the horizontal amplifier. The output of the amplifier is fed to the X-plates and a linear trace is produced on the CRO screen. When the sweep selector switch is held in the ’EXT’ position the horizontal amplifier input is disconnected from the internal sweep generator and is instead connected to the horizontal input jack. In this position, the electron beam remains stationary and produces a luminous spot on the CRO screen.
VI) LOW VOLTAGE POWER SUPPLY
The low voltage power supply powers the electronic circuits such as amplifiers, time base generator, trigger circuit. It gives an output of the order of few tens to a few hundreds of volts.
VII) HIGH VOLTAGE POWER SUPPLY
The high voltage power supply provides voltages to anodes in the electron gun assembly. It supplies voltages of the order of 1600V to 2200V.
DELAY LINE
All electronic circuitry in the CRO causes a certain amount of time delay in the transmission of signal voltages to the deflection plates. Comparing the vertical and horizontal circuits in the CRO block diagram, we obtain that a portion of the output signal applied to the vertical CRT plates triggers the horizontal signal. Signal processing in the horizontal circuit consists of generating a trigger pulse that starts the time base generator (sweep generator) then the output of this is given to the horizontal amplifier and then to the horizontal plates. This whole process takes time. The signal of the vertical CRT plates must therefore be delayed by the same amount of time to reach the signal at the same instant as that of a horizontal one. This is the function of the delay line.
Key Takeaways
- Cathode Ray Oscilloscope is a very important electronic measuring instrument which is used to display and measure electrical signals, time intervals and phase shift between two electrical signals.
- Non-electrical quantities such as pressure, strain and temperature can be measured by first converting them into an equivalent voltage using an appropriate transducer.
- Any CRO basically consists of the following seven major sections - Cathode Ray Tube (CRT), Time base circuits, Trigger circuits, Vertical Circuits, Horizontal Circuits, High Voltage Power Supply, Low Voltage Power Supply
- Delay line is because of the electronic circuitry in the CRO causes a certain amount of time delay in the transmission of signal voltages to the deflection plates.
4.5.3 APPLICATIONS OF CRO
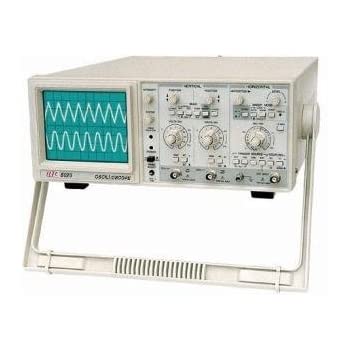
The cathode ray oscilloscope is an electronic test instrument; it is used to obtain waveforms when the different input signals are given. In the early days, it is called an Oscillograph. The oscilloscope observes the changes in the electrical signals over time, thus the voltage and time describe a shape and it is continuously graphed beside a scale. By seeing the waveform, we can analyze some properties like amplitude, frequency, rise time, distortion, time interval, etc.
|
Figure 24:CRO
The main applications of CRO are to observe the properties of electrical and electronic signals, oscillation distortion testing, the frequency response of signals, etc. The important uses of CRO are the measurement of voltage, current, frequency, etc.
Application of CRO
1. There are huge applications of CRO in Radio stations. Indeed, our conventional CRO is not used in those radio stations but they almost the same as our conventional CRO. The CROs are used in the radio station to observe the sending and receiving signal properties.
2. CRO helps to view the characteristics and property of a signal that is why it also helps to control the analog signals.
3. The shape of voltage and current waveform can be observed by CRO which helps to take the necessary decision in a radio station or communication station.
4. CRO is used for research purposes. When scientists are designed a new circuit, they check the voltage, current waveforms of each part of the circuit using the Cathode Ray Oscilloscope.
5. CRO is used with the resonance circuit to observe the bandwidth, wave shape, etc.
6. CRO is also used to observe the characteristics of Amplitude Modulation Circuits, Frequency Modulation Circuits, etc.
USE OF CRO (CATHODE RAY OSCILLOSCOPE)
The CRO is a versatile electronic instrument and it is used in measuring a variety of electrical parameters.
a) Study of the WaveForms: CRO is widely used in maintenance and troubleshooting where the wave shapes of voltages in different electronic circuits are to be examined. The signal under study is applied at the Y-input terminal and the sweep voltage is internally applied to X-plates. The size of the figure displayed on the screen may be adjusted suitably by adjusting the gain control.
b) Measurement of D. C. Voltages: The D. C. voltage understudy is applied at Y-input. The trace gets deflected upward or downward depending upon the polarity of the applied voltage. The deflection of the spot produces on the screen can be measured and by multiplying it with the deflection sensitivity (volts/div), the magnitude of unknown voltage can be obtained.
c) Measurement of A. C. Voltages: For this measurement, the trace is to be adjusted at the center of the screen, and the A. C. voltage understudy is applied at Y-input. The peak to peak distance is measured and by multiplying it with deflection sensitivity (volts/div), peak to the peak value of applied A. C. voltage can be calculated. The rms value and average value of the voltage are calculated using the formulae,
VP = 
Vrms 
Vaver = 0. 636 
d) Measurement of Current: We can measure the value of current or magnitude and direction of current using CRO. By calculating the amplitude variation, horizontal and vertical cells in the CRO screen we can measure the current. We can measure both AC and DC in CRO.
For this measurement, the current has to be passed through the suitable known resistor and the potential developed across it can be measured as has been explained above. The current may then be calculated. However, if the cathode ray oscilloscope having a magnetic deflection system, the currents may be measured by passing it through one of the deflection coils.
e) Measurement of Frequency:
We not only measure voltage and current using CRO, but we can also measure the frequency of a signal by calculating the period. Once we measure the period of a signal then we can easily measure the frequency. The measurement of the period using CRO also very easy.
1) Calibration Method: A sinusoidal signal whose frequency is to be determined is applied to Y-input. The time base control is adjusted to obtain 2 or 3 cycles of the signal on the screen. The horizontal spread of one cycle is noted. By multiplying it with the time base sensitivity (time/div), the period of the signal is obtained. The reciprocal of the period gives the frequency of the signal.
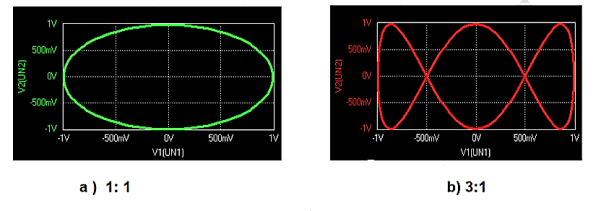
2) Lissajous Method: Alternatively, the frequency of a test signal can be determined using Lissajous patterns. When two sine waves oscillating in mutually perpendicular planes are combined, different types of closed-loop patterns are obtained. They are called Lissajous patterns in honour of the French physicist Lissajous. The signal of unknown frequency is applied to vertical input (Y) and a voltage of known frequency obtained from the standard variable frequency generator is given to horizontal input (X). The frequency of this frequency generator can be varied until a suitable stationary Lissajous figure is obtained. Knowing the frequency from the frequency generator and counting the number of tangency points along horizontal and vertical axes, the unknown frequency can be determined. If fY and fX are the unknown and known frequencies of the sinusoidal voltage fed to the vertical and horizontal plates of CRO respectively and nx and ny are the number of tangency points along the X and Y-axis respectively then the unknown frequency is calculated from
 ………(1)
Where fx is the known frequency. Examples of measurements are:
|
Figure 25: Measurement of Frequency
f) Measurement of phase difference:
Most of the CROs have two channels. We can apply two different signals at a time on the CRO. And we can measure easily the phase difference between the two different signals. Lissajous figures in the CRO screen help us to measure the phase difference between two signals. Using this method we can also measure the frequency of two signals at a time.
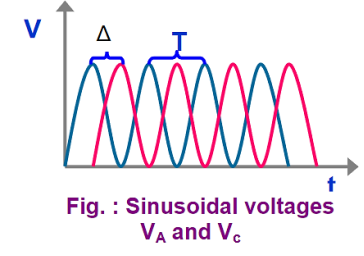
(i) Dual Sweep Method: It requires a dual trace CRO. The phase relationship between two sinusoidal signals of the same frequency may be directly measured by displaying both waveforms on the CRO screen and determining the delay time between the two waveforms.
|
Figure 26: Measurement of phase difference
The sensitivity and trigger controls of each channel are adjusted for two stationary sinusoidal signals. The sweep speed is initially adjusted such that the period T of the sine wave is measured. Then the sweep speed is increased and the delay time Td between the two sine waves is accurately determined. The difference is calculated using the relation
= 
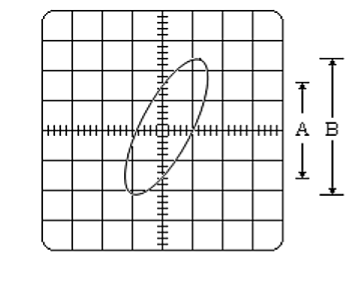
(ii) Lissajous Pattern Method: A second method for determining the phase difference of two sine waves of the same frequency is to feed one sine wave to vertical input and another sine wave to horizontal input. The sweep selector switch is kept in EXT position. A Lissajous pattern namely an ellipse is obtained on the screen. By measuring the lengths A= 2Y1and B=2Y2 of the elliptical
= sin-1(  )
)
Pattern the phase shift is calculated.
= sin-1 
|
Figure 27: Lissajous Pattern Method
Key Takeaways
- The main applications of CRO are to observe the properties of electrical and electronic signals, oscillation distortion testing, the frequency response of signals, etc. The important uses of CRO are the measurement of voltage, current, frequency, etc.
- The CRO is a versatile electronic instrument and it is used in measuring a verity of electrical parameters such as Study of the wave forms, Measurement of D.C. Voltages, A.C. Voltages, Current, Frequency and phase difference.
Bainbridge mass spectrometer is an instrument used for the accurate determination of atomic masses.
PRINCIPLE
Uniform magnetic field acting normal to the path of ions having the same velocity deflects the ions of different masses from a straight path to a circular path of different radii.
CONSTRUCTION
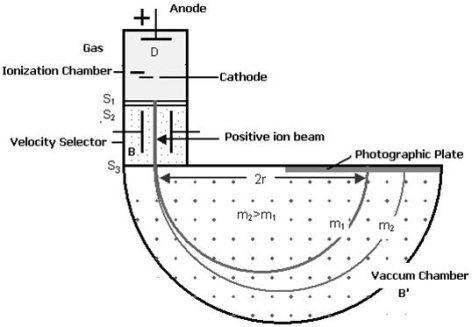
(i) Ionization Chamber
The ionization chamber is used to ionize the gas whose mass or isotope is to be determined and positive ions are produced.
(ii) Velocity Selector
Velocity selector has two fields electric and magnetic field both are applied perpendicular to the moving ion beam. A potential (V) is applied between two electrodes to produce the electric field. A magnetic field (strength B) is applied at right angles to the electrostatic field and so the electrostatic and electromagnetic forces act in opposite directions to each other. A velocity selector is used to produce a mono-velocity ion beam and a transverse magnetic field is employed to discriminate between ions of different masses.
(iii) Vacuum / Analyzing Chamber
Vacuum / Analyzing Chamber is a semi-spherical cavity in which another magnetic field B’ is applied perpendicular to the moving positive ion.
|
Figure 28: Bainbridge Mass Spectrograph
WORKING
Atoms with one or more electrons removed have a net positive charge and they become positive ions. A beam of positive ions produced in a discharge tube is collimated into a fine beam by two narrow slits S1and S2. This fine beam enters into a velocity selector.
The velocity selector allows the ions of a particular velocity to come out of it, by the combined action of an electric and a magnetic field. The velocity selector consists of two plane-parallel plates P1 and P2, which produces a uniform electric field E and an electromagnet, to produce uniform magnetic field B (represented by the dotted circle). These two fields are at right angles to each other and to the direction of the beam.
The electric field and magnetic field are so adjusted that the deflection produced by one field is nullified by the other so that the ions do not suffer any deflection within the velocity selector.
Ions are formed in the ionization chamber and pass through the cathode, then through collimating slits S1 and S2. The beam is then passed through a velocity selector in which electric and magnetic fields are applied perpendicular to each other. The ion moves in a straight-line path for which both the forces acting on it are equal
Let E and B be the electric field intensity and magnetic induction respectively and q be the charge of the positive ion. The force exerted by the electric field is equal to qE and the force exerted by the magnetic field is equal to qvB where v is the velocity of the positive ion.
qE =qvB
The velocity of ion which passes undeflected through the velocity selector is
v = E/B
In the vacuum chamber, the ions are affected by the magnetic field (B’) alone and so move in circular paths, the lighter ions having the larger path radius. If the mass of an ion is M, its charge q, and its velocity v then
qvB’ =Mv2 /R
R =Mv/qB’
So the radius of the path is directly proportional to the mass of the ion i. e. R ∝ M
Further substitute the value of v
R =ME/qBB’ or M =RqBB’/E
Ions with different masses trace semi-circular paths of different radii and produce dark lines on the plate. The distance between the opening of the chamber and the position of the dark line gives the diameter 2R from which radius R can be calculated.
Since, B, B′, E, and R are known, the mass of the positive ions and hence isotopic masses can be calculated.
Key Takeaways
- Bainbridge mass spectrometer is an instrument used for the accurate determination of atomic masses.
- It is based on the principle of Uniform magnetic field acting normal to the path of ions having same velocity deflects the ions of different masses from a straight path to circular path of different radii.
- Radius of path is directly proportional to mass of the ion i.e. R ∝ M
- Since, B,B′,E and R are known, the mass of the positive ions and hence isotopic masses can be calculated by using the formula M = RqBB’/E
Reference
I. Engineering physics- Gaur and Gupta, & S.Chand Publication
2. Engineering physics - Avadhanalu and Kshirsagar, S.Chand Publication
3. Fundamentals of optics-Jenkins and White. McGraw Hill Publication
4. A Text Book of Optics Subrahmanyam, BrijIal, S. Chand Publication
5. Engineering physics- Hitendra K Malik, A.K.Singh, Tata McGraw Hill Education Private Limited, New Delhi
6 Essential University Physics Volume – l and 2 Richard Wolfson, Pearson, Noida 7. Engineering Physics Dattu R Joshi Tata Mc-Graw Hill Education Private Limited
