GUJARAT TECHNOLOGICAL UNIVERSITY
PROPERTIES OF MATTER
MODULE -1
CONTENT
LOAD
Load is a term frequently used in engineering to mean the force exerted on a surface or body.
Force is the dynamic load {force= mass× acceleration} and it can act in any direction. On the other hand, load is a static load { f= mg} and it can act only in downward direction. In simple word force is that which cause rest object to motioned and motioned object to rest and other hand load is that which cause object to be deform.
The main difference is that force is applied by the object and load is applied on the object.
Load is more an engineering term and deduces that there is some system that is supposed to resist forces applied to it. The force that it is supposed to resist is the load.
According to Newton’s formula; F = ma. Where F is Force, m is mass and a is acceleration.
The force of an object at rest is zero newton. Because at rest acceleration is 0 and the mass has certain value. So it has potential energy. Multiply the mass of the object by the gravitational acceleration of the earth (9.8 m/sec2), and the height in meters. This equation is the object at rest's potential energy. Potential energy is measured in joules, this is the load force.
Deformation is the change in shape of the body when a force is applied on it. Even very small magnitude of forces is enough to cause some deformation.
Two terms describe the forces on objects undergoing deformation:
- Stress
- Strain
STRESS
When an external force is acting on an elastic body, it causes deformation that means change in shape or in size or both.
Stress = Force/Area = F/A
The stress is defined as the restoring force acting on unit area.
Unit: The unit for stress is Newton Metre-2 or Nm-2 or Pascal written as Pa.
Restoring Force: Due to elastic property, a force is developed within the material, which is equal and opposite to the applied force, this force is responsible to bring the body to its original shape and size. This force is Restoring Force.
Since the applied force and the restoring force are equal in magnitude, the ‘stress’ is measured as the applied force acting per unit area.
- When the applied force tends to compress the body, the stress is compressive stress.
- When it tends to increase the length in the direction of the force, it is tensile stress.
- When it acts parallel to the surface of a body, the stress is tangential stress or Shear stress.
- When an object is being squeezed from all sides, like a submarine in the depths of an ocean, we call this kind of stress a bulk stress or volume stress.
STRAIN
Within the elastic limits, the strain produced in a body is directly proportional to the stress which causes it.
i.e. strain ∝ stress or stress ∝ strain
Strain: Change in dimensions to original dimensions is known as Strain.
Types of Strain
(1) Linear Strain: When a wire or bar is subjected to two equal and opposite forces namely pulls at its ends there is an increase in the length. If the forces are tensile, the body is elongated. If the forces are compressive, the length is shortened in the direction of the forces. This is called the 'linear strain'.
The linear strain is defined as the ratio of change in length to the original length.
If the change (increase or decrease) in length is ' 5m ' in a wire or bar of original length L=20m.
Linear strain = Change in length/ original length = 5m/20m = 0.25
As the linear strain is ratio of lengths, it has no unit.
(2) Bulk (or) Volume Strain: When a force is applied uniformly and normally to the entire surface of the body, there is a change in volume of the body, without any change in its shape. This strain is called 'bulk or volume strain.
Volume strain is defined as the ratio of change in volume to the original volume.
If 'v' is the change in volume produced in a body of original volume ‘V’
Bulk or volume strain = Change in volume v / original volume V
It has also no unit.
(3) Shearing (or) Rigidity strain: When a force is applied parallel to one face of a body, the opposite side being fixed, there is a change in shape but not in size of the body. This strain is called the shearing strain.
Solids alone can have a shearing strain. It is measured by the angle of the shear 'θ' in radian.
In 17ᵗʰ century physicist Robert Hooke observed that the stress vs strain curve for many materials has a linear region.
Hooke's law: Within the elastic limits, the strain produced in a body is directly proportional to the stress which causes it.
i.e., strain ∝ stress or stress ∝ strain
So
 = constant
This constant is called 'modulus of elasticity.
Hooks law can be defined as
The force required to stretch an elastic object such as a metal spring is directly proportional to the extension of the spring. This is known as Hooke's law and commonly written:
F=−kx
Where F is the force,
x is the length of extension/compression
k is a constant of proportionality known as the spring constant which is usually given in N/m.
Negative sign signify that the restoring force due to the spring is in the opposite direction to the force which caused the displacement.
Dimensional Formula [ML-1T-2]
The total length L of a spring under extension is equal to the nominal length L0 plus the extension x, L=L0+x and during compression of spring, it is given by L=L0 – x.
A stress-strain curve is a graphical representation of the behaviour of a material when it's subjected to a load or force.
The two characteristics stress and strain are plotted. Stress along the y-axis and strain along the x-axis.
We already discussed that Stress is the ratio of the load or force to the cross-sectional area of the material. The standard unit of measurement for stress is Nm2.
Strain, on the other hand, is a measure of the deformation of the material as a result of the applied force. Deformation is a change in the shape of the material.
The stress-strain graph provides engineers and designers a graphical measure of the strength and elasticity of a material. It allows them to predict the behaviour of materials used in a given application. To draw the graph, the material must first undergo a tensile test.
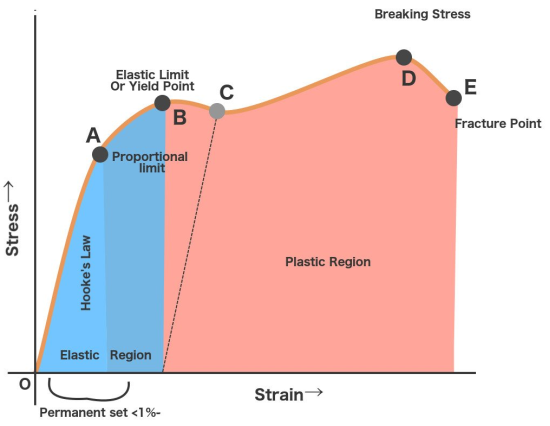
Figure 1: Stress Strain Curve
When a ductile material consider a wire is put under stress, initially the resulting strain is proportional to the magnitude of the forces.
This is represented by the straight-line OA. The straight-line implies that stress and strain share a linear or we can simply say that the material obeys Hooke’s law. Stress corresponding to point A is known as proportionality limit. In this region, the material behaves like elastic.
Now when the stress is increased beyond A then for small stress there is large strain in the wire. Beyond the point A, stress and strain stop to share their linear relationship. The material in this region doesn’t obey Hooke’s law this fact can easily observe from its non-linear shape.
Still, even though the material doesn’t obey Hooke’s Law, it manages to retain its elasticity.
Point B is therefore known as the elastic point or elastic limit. Elastic limit represents the maximum stress on whose removal, the body regains its original shape or dimensions. This region OB is called the elasticity region.
Point B is also known as yield point because if the stress is increased beyond point B, the strain increases and increased in strain is represented by BC part of curve. Now if the load is removed the wire does not regain its original shape. But the increase in length is permanent. This permanent strain in the wire is known as permanent set.
Now further when the stress is increased beyond point C, there is large increase in the stain for small stress is represented by CD part of the curve.
The material from C to D shows plastic behaviour or plastic deformation.
The stress decreases until point C, which is known as the lower-yield point but as we can observe the material continues to elongate.
When plasticity is induced in the material its internal molecular structure suffers constant rearrangements. The material tries to resist this change and tends to harden. This is known as strain hardening.
However as the stress applied to it increases, it continues to elongate along its length, progressively growing longer and thinner until point D, which represents the material’s maximum strength. This is referred to as the material’s ultimate strength point.
Stress greater than D is so unbearable, beyond this wire break. The wire break at point E is known as fracture point.
Uses of stress-strain diagram
1. It is used to categorize the materials into ductile or brittle or plastic in nature.
2. It provides engineers and designers a graphical measure of the strength and elasticity of the material.
DUCTILITY
Ductility is a property of a solid material which indicates that how easily a material gets deformed under tensile stress. Ductility is often categorized by the ability of material to get stretched into a wire by pulling or drawing.
Ductility is an indication of how much plastic strain a material can withstand before it breaks. A ductile material can withstand large strains even after it has begun to yield.
Plastic deformation of ductile material is very large.
The materials for which large amount of plastic deformation take place between the elastic limit and the fracture point are known as ductile material. (definition from the stress strain graph discussed above in figure 1)
With rise in temperature, the ductility of material increases.
BRITTLENESS
Brittleness of a material indicates that how easily it gets fractured when it is subjected to a force or load.
Brittle materials are fractured soon after the elastic limit is crossed.
The materials for which small amount of plastic deformation take place between the elastic limit and the fracture point are known as ductile material. (definition from the stress strain graph discussed above figure 2)
When a brittle material is subjected to a stress it observes very less energy and gets fractures without significant strain.
Brittleness is converse to ductility of material.
Brittleness of material is temperature dependent. Some metals which are ductile at normal temperature become brittle at low temperature.

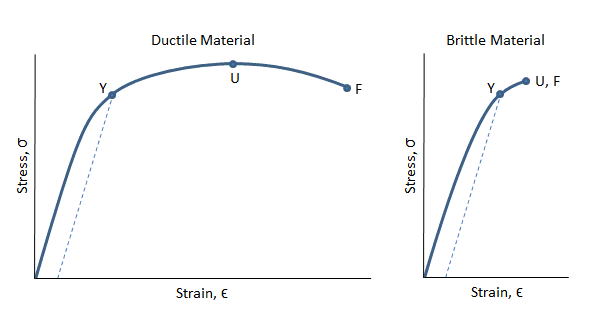 Figure 2: stress-strain curves for a ductile material and a brittle material.
In the figure above, the ductile material can be seen to strain significantly before the fracture point F. There is a long region between the yield at point Y and the ultimate strength at point U where the material is strain hardening.
There is also a long region between the ultimate strength at point U and the fracture point F in which the cross sectional area of the material is decreasing rapidly and necking is occurring.
The brittle material in the figure above can be seen to break shortly after the yield point.
Also, the ultimate strength is coincident with the fracture point. In this case, no necking occurs.
It is seen clearly that the area under the stress-strain curve for the ductile material above is greater than the area under the stress-strain curve for the brittle material, which signifies the ductile material has a higher modulus of toughness. It can absorb much more strain energy before it breaks.
Also the ductile material strains so significantly before it breaks, its deflections will be very high before failure.
PLASTICITY
The property of the material by virtue of which it does not regain its original shape when the external force acting on it is removed. It is called plasticity.
Plasticity.
It is also known as plastic deformation, is the ability of a solid material to undergo permanent deformation.
Under the effect applied forces a non-reversible change of shape is occur.
The transition from elastic behaviour to plastic behaviour is known as yielding.
Paraffin wax, wet clay are the nearest approach to a perfectly plastic bodies.
The property of matter by virtue of which its regains its original shape and size, when deforming forces have been removed is called elasticity.
An elastic body is one that regains its original shape and size when deforming forces are removed.
To know more about elasticity let us look at atomic level. We know that solids are made of atoms (or molecules). They are surrounded by other such atoms which are held by interatomic forces in a state of equilibrium. When an external force is applied these particles are displaced, resulting in the deformation of the solid. When the applied force is removed interatomic forces drive the atoms to regain their state of equilibrium.
In reality no material is perfectly elastic. For example, if you use a hair rubber band to tie your hair, you will found that rubber band loose its elasticity after some time. If you may have noticed that even your hair shows deformation from its original shape, when it is put in certain style for long time that is its size tends to deform after prolonged use. This is because the hair tie eventually loses its elastic nature.
Most solid materials exhibit elastic behaviour to a greater or lesser extent. But there is a limit to the magnitude of the force and the associated deformation within which elastic recovery is possible for any given material. This limit is called the elastic limit. It is defined as the maximum stress or force per unit area within a solid material that can arise before the beginning of permanent deformation.
For such materials the elastic limit marks the end of elastic behaviour and the beginning of plastic behaviour.
Stress beyond the elastic limit cause a material to yield or flow.
For most brittle materials, stresses beyond the elastic limit result in fracture with almost no plastic deformation.
Different materials show different elastic behaviour. The study of the elastic behaviour of a material is of much importance. Almost every engineering design requires knowledge of the elastic behaviour of materials.
Applications of Elastic behaviour of solids:
- In the construction of various structures like bridges, columns, pillars, beam, etc. Knowledge of the strength of the materials used in the construction is of prime importance.
- The principle of elasticity is also used in measuring the height of mountains.
- Metallic machinery are not subjected to stress beyond its elastic limits, otherwise they will be deformed permanently
- Lift and cranes have to support heavy loads, therefore the suspension ropes and cables should have very high strength. Materials having higher young’s modulus are used in selecting the ropes in lifts and trains.
Working stress
Working stress is known as the maximum allowable stress that a material or object will be subjected to when in service.
- This stress is always lower than the Yield stress and the Ultimate Tensile Stress (UTS).
- The ratio of Working Stress to the Yield Stress or UTS is known as the Factor of safety.
- Safe working stress is always less than the Elastic limit for a given material.
Design load
When you design a component the load that component has to carry during its service is calculated taking in to consideration of all the possible loads that might act on it. This calculated load is known as design load.
Why use a factor of safety?
When this design load acts, we expect the component to be safe. That means the stress induced in the member when this design load acts on it has to be less than yield point stress. This is because if the stress reaches yield point stress, the component is considered to be failed (since yielding can't be permitted in most of the applications)
Hence we need to keep the stress during its service well below the yield point stress. By what factor you reduce this stress is left to the design engineer. He select a suitable number (Factor of safety-FoS) by which he divide the yield stress to get the safe value of stress which is known as Design Stress Or Working Stress.
The selection of factor of safety depends on the design engineers experience, cost involved and various other safety parameters. We use this working stress or design stress to find the size of the component required.
Hence the component will be subjected to a maximum stress of design stress when the design load acts on it. Any accidental overloading may increase the stress above design stress; still the stress may fall below yield stress due to the usage of factor of safety.
For ductile materials which has a well defined yield point factor of safety is defined as
Factor of safety (FoS) or Safety factor (SF)
It is defined as the ratio of yield stress to working stress for ductile materials.
Or
Factor of safety is a ratio of maximum stress withstand by an object to applied stress.
FoS = yield or Maximum stress/ working stress
And
Design stress = yield stress / FoS
For brittle materials which have no well-defined yield point the factor of safety is calculated based on ultimate stress.
FoS = Ultimate stress/ working stress
When factor of safety is defined based on the ultimate stress, higher values are generally used.
Factor of Safety usually refers follow points:
1) The actual load-bearing capacity of a structure or component.
2) The required margin of safety for a structure or component according to code, law, or design requirements.
Whenever a Factor of safety is greater than 1 then the applied stress is less than or equal to the maximum stress so the object can withstand load. A FoS of 1 means that a structure or component will fail exactly when it reaches the design load and cannot support any additional load.
But when the ratio is equal to 1 the object tough enough to withstand load.
Whenever a Factor of safety is less than 1, the applied stress is greater than maximum stress then the object can’t withstand the stress applied it led to failure. Structures or components with FoS < 1 are not possible; basically, 1 is the minimum.
Ex:
Suppose the maximum and applied stress of the beam is 50k pa and 10k pa
Then the Factor of safety(FOS)
FOS=maximum stress/applied stress
FOS=50k/10k
FOS=5
The applied stress is 1/5th of the maximum stress, so the beam can withstand the applied stress.
With the equation above if an FoS of 2 means that a component will fail at twice the design load and so on.
One of the difficulties associated with using a FoS or SF is some measure of uncertainty. If the consequences of failure are significant, such as loss of life, personal harm, or property loss, a higher FoS will be required by design or by law. Another consideration is obviously cost from business point of view, how much extra does it cost per part to achieve a certain FoS
It is found that bodies lose their elastic limit, due to elastic fatigue. Therefore, the manufacture should choose the material in such a way that it should regain its elastic property even when it is subjected to large number of cycles of stress.
For example substances like quartz, phosphor, bronze etc. May be employed in manufacturing of galvanometers, electrometers etc. after knowing their elastic properties.
Apart from elastic fatigue some material will have change in their elastic property because of the following factors.
- Effect of stress
- Effect of annealing
- Hammering and Rolling
- Temperature
- Effect of impurities
- Effect of nature of crystals
- Effect of stress
When a material is subjected to a large number of cycles of stresses, it loses its elastic property even within elastic limit, it results in the formation of large crystal grain, which reduces the elastic property of the material. Taking these into account, the working stress on an engineering piece is kept far below its ultimate tensile strength. Therefore the working stress on the material should be kept lower than the ultimate tensile strengthen and the safety factor.
2. Effect of Annealing
Annealing is a process by which the material is heated to a very high temperature and then it is slowly cooled. Usually this process is adopted for the material to increase the softness and ductility in the material. But if annealing is made to a material it results in the formation of large crystal grains, which ultimately reduces the elastic property of the material.
3. Hammering and rolling
Crystal grains break up into smaller units by Hammering and rolling. This results in increase in elasticity of material.
4. Effect of temperature
Intermolecular forces decrease with increase in temperature so The elastic property of the materials decreases with the rise in temperature. Normally the elasticity increases with the decrease in temperature and vice-versa.
Examples
1. Lead is not a good elastic material. But at low temperature it becomes a very good elastic material. The elastic property of lead increases when the temperature is decreased.
2. A carbon filament which is highly elastic at normal temperature becomes plastic when it is at high temperature
3. Invar is a special alloy used for making pendulums and its elasticity is not affected by the temperature change in the normal temperature range.
5. Effect of impurities
The addition of impurities produces variation in the elastic property of the materials. The increase and decrease of elasticity depends upon the type of impurity added to it.
Examples:
1. When potassium is added to gold, the elastic property of gold increases.
2. When carbon is added to molten iron, the elastic property of iron decreases provided the carbon content should be more than 1% in iron.
6. Effect of nature of crystals
The elasticity also depends upon the types of the crystals, whether it is a single crystal or poly crystals. For a single crystal the elasticity is more and for a poly crystal the elasticity is less.
Corresponding to the three types of strain, there are three kinds of moduli of elasticity.
- They are Young’s modulus (Y)
- Bulk modulus (K)
- Rigidity modulus (η)
Modulus is defined as ratio between stress and strain.
1. YOUNG’S MODULUS (Y)
The young’s modulus (Y) is defined as ratio of linear or longitudinal stress to linear or longitudinal strain.
Y=  =
=  ……..(1)
Consider a rod of initial length L0 and cross-sectional area ' A', undergo an extension l, when a stretching force 'F', is applied in the direction of its length. The modulus of elasticity in this case is called Young's modulus and is given by
Y = 
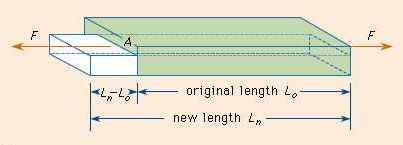
Figure 3
Whereas linear stress is given by = =
=  ……..(2)
Linear strain is given by = =
=  ……..(3)
By using (2) and (3) in equation (1) we get
Y =  =
=  =
=  where change in length ∆L =Ln-L0 can be written as l.
The unit for Young’s modulus is newton metre-2 with symbol N m-2. The single term unit which is widely used for Young's modulus is 'pascal' with symbol 'Pa'.
BULK MODULUS (K)
When uniform force is applied normally to the surface of the entire body, it produces a change in volume without any change of shape.
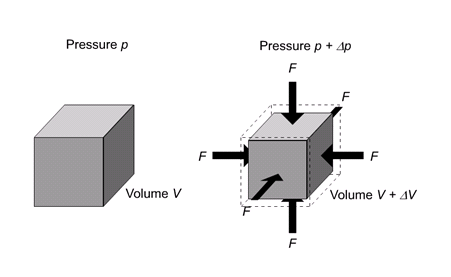
Figure 4
It is defined as the ratio of bulk stress to bulk strain.
The force applied per unit area or pressure gives the bulk stress.
The change in volume per unit volume gives the bulk strain.
Bulk stress =  = Δp
= Δp
Δp – Change in pressure
Bulk Strain =  =
= 
Bulk Modulus (K) =  =
= 
The negative sign indicates when the pressure applied increases, the volume decreases.
Shearing (or) Rigidity modulus 'η'
The ratio of the shearing stress applied to the body to the shearing strain produced is called the rigidity modulus and denoted by the letter 'η'.
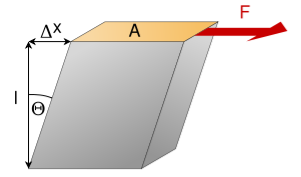
Figure 5
If T is the tangential force/unit area and if θ is the angle of shear measured in radian,
Then rigidity modulus η =  =
=  =
= 
The unit for rigidity modulus is newton metre-2 radian-1 with symbol N m-2 rad-1. The other unit which is widely used for rigidity modulus is Pascal radian-1 with symbol Pa rad-1.
Consider a cylindrical rod of length l radius r and coefficient of rigidity η. Its upper end is fixed and a couple is applied in a plane perpendicular to its length at lower end as shown in figure.
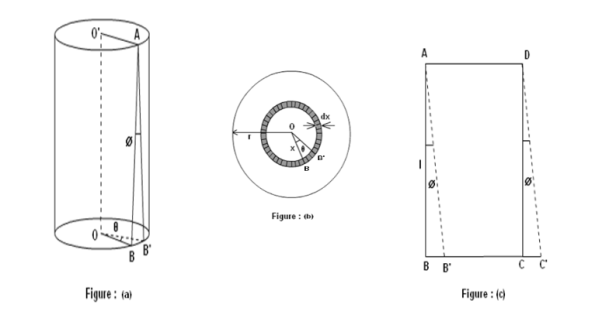
Figure 6
Consider a cylinder is consisting a large number of co-axial hollow cylinders. Now, consider a one hollow cylinder of radius x and radial thickness dx as shown in fig.(b). Let θ is the twisting angle. The displacement is greatest at the rim and decreases as the center is approached where it becomes zero.
As shown in fig.(a), Let AB be the line parallel to the axis OO’ before twist produced and on twisted B shifts to B’, then line AB become AB’. Before twisting if hollow cylinder cut along AB and flatted out, it will form the rectangular ABCD as shown in fig.(c). But if it will be cut after twisting it takes the shape of a parallelogram AB’C’D.
The angle of shear ∠BAB’ = ɸ
From fig.(c) BB’= Lɸ
From fig.(b) BB’= xθ
So Lɸ= xθ
And ɸ = 
The modules of rigidity is
η =  =
= 
F = η ɸ = η 
The surface area of this hollow cylinder = 2πxdx

Figure 7
∴ Total shearing force on this area = η  2πxdx
2πxdx
=  x2dx
x2dx
The moment of this force=  x2dx. X
= x3dx
x3dx
Now, integrating between the limits x = 0 and x = r, We have, total twisting couple on the cylinder
=
= 
= [
[ ]
]
∴ Total twisting couple
=
Then, the twisting couple per unit twist (θ= 1) is
C = 
This twisting couple per unit twist is also called the torsional rigidity of the cylinder or wire.
A heavy cylindrical rod or disc, suspended from the end of a fine wire, whose upper end is fixed is called torsional pendulum.

Figure 8
The rod or disc is turned, the wire will twist and when released, it executes torsional vibrations about the axis. Let θ be the twisting angle. Then the restoring couple set up in it is.
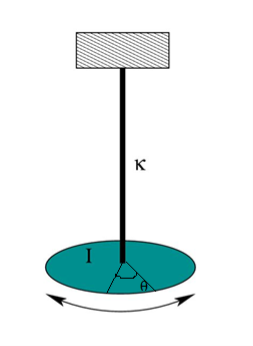
Figure 9: Torsional Pendulum
When the disc is rotated in a horizontal plane so as to twist the wire, the various elements of the wire undergo shearing strains and the restoring couple produces the oscillations. If the angle of twist at the lower end of the wire is θ, then the restoring couple is Cθ, where, C - torsional rigidity.
This couple acting on the disc produces in it an angular displacement, therefore from the law of conservation of energy, the energy of the system is conserved:
Total energy of the Torsional pendulum = Potential Energy + Kinetic Energy -- (1)
Then the restoring couple through an angle θ

= dθ
dθ
Potential Energy (PE) = Cθ2 /2 ---------------- (2)
The kinetic energy of the disc (KE) = ½ I ω2 ------------------ (3)
Then total energy (TE) = Cθ2 /2 + ½Iω2 = Constant ------------ (4)
Differentiating equation (4) with respect to time
Cθ +Iω
+Iω = 0
= 0
Since the angular velocity ω =  and an angular acceleration
  =
= 
We can write
Cθ +I
+I
 = 0
= 0
 (Cθ +I
  ) = 0
) = 0
Where  ≠ 0
≠ 0
Cθ +I  = 0
= 0
 = -
= - θ ------------ (5)
Angular acceleration = - θ ------------ (6)
( -) Negative sign indicates angular acceleration in opposite direction.
Torsional oscillation belongs to simple harmonic motion, Hence the period of oscillation
T = 2π 
T = 2π 
T = 2π  ------------ (7)
C - twisting couple
Twisting couple
C = ------------ (8)
Substituting the equation (8) in equation (7)
T = 2π 
T = 2π  ------------ (9)
Squaring the equation (9) on both sides
T2 = 4π2
η = 
A beam clamped horizontally at one end and loaded with a weight at the free end is called a cantilever.
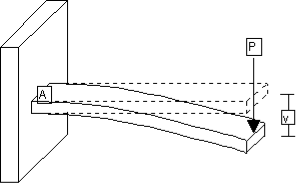
Figure 10
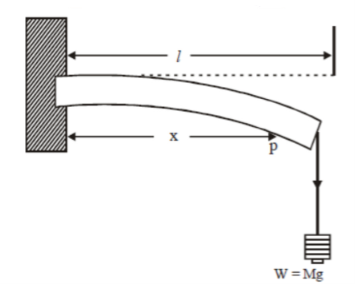
Figure 11
Consider a section at P at a distance x from the fixed end. Neglecting the weight of the part between P and the free end, the moment of the external couple =
Mg(l - x)
The bending moment of the section at P = , where R is the radius of curvature of the neutral axis at P.
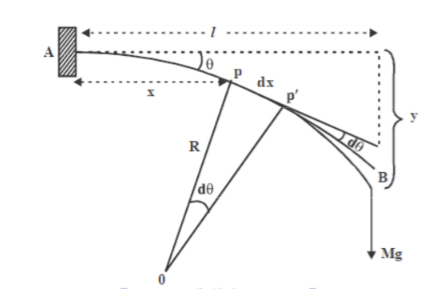
Figure 12: Depression at the free end of cantilever
At equilibrium, Mg(l - x) = 
R =  ------------ (1)
From this expression we find that as x increases, R also increases, the maximum and minimum values being at the free and fixed ends respectively.
Since the radius of curvature of the neutral axis (R) varies from point to point of the cantilever (x), the bending is said to be non-uniform.
Let P’ be another point on the bent cantilever at a small distance dx from P. Since P and P’ are very near we can assume that the radius of curvature R is practically the same and O is its centre of curvature. Let the angle between the tangents at P and P’ be dθ.
Then angle POP’ = dθ
Dx = Rdθ
R =  ------------ (2)
Substituting the equation (2) in (1)
dθ =  dx ------------ (3)
If θ is the angle between the tangents at A and B, we have
θ = 
θ =  -
- 
θ =  -
- 
θ =  -
- 
θ =  ------------ (4)
Deflection of cantilever
If dy is the depression of B due to the curvature at PP’
Dy = (l-x) dθ
dθ = (l-x) / dy ------------ (5)
Substituting the equ.(5) in (3)
Dy =  dx
dx
The depression y is given by
y = 
y =

y =

y =
 ]
]
y =
Case i
For rectangular cross section If b is the breadth and d is the thickness of the beam then Ig becomes
Ig =
Substituting the value of Ig in the above (cantilever) equation
The depression produced at free end for a rectangular cross section
y =
y =
Case ii
For circular cross section If r is the radius of the circular cross section, then Ig =
Substituting the value of Ig in the above (cantilever) equation
Depression produced
y =
y =
In this experiment we try to measure the Elasticity modulus of scales made of different materials with the cantilever beam arrangement .If we consider the beam in the position given in the figure below.
 Figure:13
We define coordinate z along the length of the beam, coordinate y vertically from the center line of the beam and coordinate x width wise across the beam so as to complete a right handed system. Beam deflections (in the y direction) are denoted using the variable ν which in general will be a function of z, i.e. ν =ν(z). The bending moment Mx(z) is positive if the upper fibres of the beam are in compression and the bottom fibres are in tension. For a symmetric cross section beam made of a linear elastic material, whose displacements and slopes under load are small relative to its unreformed configuration, the relationship between the displacement and bending moment is

Where EI designates the bending moment of the beam; E is the modulus of elasticity and I is the second area moment of the cross section (L4) about the x-axis. For a rectangular cross section I=bh3/12. We can get the relation after some manipulation as

From which if z  L we get, for

In this, I vary the mass suspended m and get the Elasticity modulus of various materials. We can also vary the length of beam and get the behaviour. Then we can try to gauge how good our approximation ofs the formula works with a change in the point of suspension of the weights.
In general, a girder bridge is very likely the most commonly built and utilized bridge in the world. Its basic design, in the most simplified form, can be compared to a log ranging from one side to the other across a river or creek A girder supported at its two ends on the opposite walls of a room, bends under its own weight and, or under the load placed above it. The middle portion gets depressed.
The depression (y) at the mid-point of a rectangular beam is proportional to
y =
For the depression y to be small for a given load w,
The length of the girder l should be small and
Its breadth b, depth d and Young’s modulus for its material Y must be large.
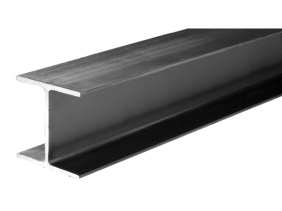
Figure 14
Due to depression, the upper parts of the beam above neutral surface contract, while those below the neutral surface extended. Hence the stresses have a maximum value at the top and bottom and progressively decrease to zero as we approach the neutral surface from either face.
Therefore, the upper and lower surfaces of the beam must be stronger than the intervening part. That is why the two surfaces of a girder or iron rails are made much broader than the rest of it, thus giving its cross section the shape of the letter I. Hence the girders with I shape are called I-Shape Girders. In this manner, material will be saved, without appreciably impairing its strength. Since the stress experienced at the middle portions of the girders is maximum, removal of the material does not reduce the strength of the girders.
I beams have very high moment of inertia for the same volume of the given material. So they have high stability in case of bending moments. The two horizontal parts (called flanges) of the I beam can bear high bending and shearing stress.
That means they do not get twisted and tilted easily. That is why they are used in girders, and as rails on the railway tracks.
A rolled steel girder is a girder that has been fabricated by rolling a blank cylinder of steel through a series of dies to create the desired shape. These create standardized I-beam and wide flange beam shapes up to 100 feet in length.
Advantages of I-shaped girders
- Economy of material without loss of efficiency.
- Self-loading is minimized.
- Strength of the girders does not fall.
Applications of I shape girders
1. They are used in the construction of bridges over the rivers or roads.
2. They are very much useful in the production of iron rails which are used in railway tracks.
3. They are used in the construction of iron beams to support the bridges for the heavy vehicles.
4. They are used as supporting beams for ceiling in the construction of buildings
Let F be the viscous force acting between two layers of a liquid separated by a distance dx. Let dv be the difference in velocity between the two layers. Let A be the area of the layers. The velocity gradient dv/dx acts perpendicular to direction of flow of the liquid.
The viscous force F is found to be directly proportional to
F is proportional to the area of the layers 'A’ and
F is proportional to the velocity gradient dv/dx
F α 
F = η 
If A = 1and dv/dx =1, then F = η
Where η is constant, called Coefficient of viscosity of the liquid
Coefficient of viscosity of a liquid is defined as the viscous force acting between two layers of a liquid having unit area of layers and unit velocity gradient normal to the direction of flow of the liquid.
SI unit of η: Nsm-2
Dimensional formula of η = ML-1T-1
Effect of Temperature on Viscosity
Viscosity varies with temperature. Honey and syrups can be made to flow more readily when heated. In general, the viscosity of a simple liquid decreases with increasing temperature.
As temperature increases, the average speed of the molecules in a liquid increases and the amount of time they spend in contact with their nearest neighbours decreases. Thus, as temperature increases, the average intermolecular forces decrease. The actual manner in which the two quantities vary is nonlinear and changes abruptly when the liquid changes phase.
The viscosity of gases increases as temperature increases and is approximately proportional to the square root of temperature. This is due to the increase in the frequency of intermolecular collisions at higher temperatures.
Effect of Pressure on Viscosity
Viscosity is normally independent of pressure, but liquids under extreme pressure often experience an increase in viscosity. Since liquids are normally incompressible an increase in pressure doesn't really bring the molecules significantly closer together.
Simple models of molecular interactions won't work to explain this behaviour. The liquid phase is probably the least well understood of all the phases of matter.
FORMS OF VISCOSITY
Newton's law of viscosity, given above, is a constitutive equation (like Hooke's law, Fick's law, Ohm's law). It is not a fundamental law of nature but an approximation that holds in some materials and fails in others. Non-Newtonian fluids exhibit a more complicated relationship between shear stress and velocity gradient than simple linearity. Thus there exist a number of forms of viscosity Newtonian: fluids, such as water and most gases which have a constant viscosity.
- Shear thickening: viscosity increases with the rate of shear.
- Shear thinning: viscosity decreases with the rate of shear. Shear thinning liquids are very commonly, but misleadingly, described as thixotropic
- .Thixotropic: materials which become less viscous over time when shaken, agitated, or otherwise stressed.
- Rheopectic: materials which become more viscous over time when shaken, agitated, or otherwise stressed.
- A Bingham plastic is a material that behaves as a solid at low stresses but flows as a viscous fluid at high stresses
- A magnetorheological fluid is a type of "smart fluid" which, when subjected to a magnetic field, greatly increases its apparent viscosity, to the point of becoming a viscoelastic solid
VISCOSITY COEFFICIENTS
Viscosity coefficients can be defined in two ways:
•Dynamic viscosity, also absolute viscosity, the more usual one (typical units Pa·s, Poise, P);
•Kinematic viscosity is the dynamic viscosity divided by the density (typical units m2/s, Stokes, St).
Viscosity is a tensorial quantity that can be decomposed in different ways into two independent components. The most usual decomposition yields the following viscosity coefficients:
•Shear viscosity, the most important one, often referred to as simply viscosity, describing the reaction to applied shear stress; simply put, it is the ratio between the pressure exerted on the surface of a fluid, in the lateral or horizontal direction, to the change in velocity of the fluid as you move down in the fluid (this is what is referred to as a velocity gradient).
•Volume viscosity (also called bulk viscosity or second viscosity) becomes important only for such effects where fluid compressibility is essential. Examples would include shock waves and sound propagation. It appears in the Stokes' law (sound attenuation) that describes propagation of sound in Newtonian liquid. Alternatively,
•Extensional viscosity, a linear combination of shear and bulk viscosity, describes the reaction to elongation, widely used for characterizing polymers. For example, at room temperature, water has a dynamic shear viscosity of about 1.0 × 10⁻³ Pa·s and motor oil of about 250 × 10−3 Pa·s.
COMPARISON OF VISCOSITIES
Gases
Viscosity in gases arises principally from the molecular diffusion that transports momentum between layers of flow. The kinetic theory of gases allows accurate prediction of the behaviour of gaseous viscosity. Within the regime where the theory is applicable:
•Viscosity is independent of pressure and
•Viscosity increases as temperature increases.
To understand why the viscosity is independent of pressure, consider two adjacent boundary layers (A and B) moving with respect to each other. The internal friction (the viscosity) of the gas is determined by the probability a particle of layer A enters layer B with a corresponding transfer of momentum. Maxwell's calculations showed him that the viscosity coefficient is proportional to both the density, the mean free path and the mean velocity of the atoms. On the other hand, the mean free path is inversely proportional to the density. So an increase of pressure doesn't result in any change of the viscosity.
Liquids
In liquids, the additional forces between molecules become important. This leads to an additional contribution to the shear stress though the exact mechanics of this are still controversial. Thus, in liquids:
•Viscosity is independent of pressure (except at very high pressure);and
• Viscosity tends to fall as temperature increases (for example, water viscosity goes from 1.79 cP to 0.28 cP in the temperature range from 0 °C to 100 °C); see temperature dependence of liquid viscosity for more details. The dynamic viscosities of liquids are typically several orders of magnitude higher than dynamic viscosities of gases.
Solids
On the basis that all solids such as granite flow to a small extent in response to small shear stress, some researchers have contended that substances known as amorphous solids, such as glass and many polymers, maybe considered to have viscosity. This has led some to the view that solids are simply "liquids" with a very high viscosity, typically greater than 1012 Pa·s. This position is often adopted by supporters of the widely held misconception that glass flow can be observed in old buildings. This distortion is the result of the undeveloped glassmaking process of earlier eras, and not due to the viscosity of glass.
However, others argue that solids are, in general, elastic for small stresses while fluids are not. Even if solids flow at higher stresses, they are characterized by their low-stress behaviour. This distinction is muddled if measurements are continued over long time periods, such as the Pitch drop experiment. Viscosity may be an appropriate characteristic for solids in a plastic regime. The situation becomes somewhat confused as the term viscosity is sometimes used for solid materials, for example Maxwell materials, to describe the relationship between stress and the rate of change of strain, rather than rate of shear. These distinctions may be largely resolved by considering the constitutive equations of the material in question, which take into account both its viscous and elastic behaviours.
Materials for which both their viscosity and their elasticity are important in a particular range of deformation and deformation rate are called viscoelastic. In geology, earth materials that exhibit viscous deformation at least three times greater than their elastic deformation are sometimes called rheids
Viscosities of selected materials (note the different unit prefixes) | ||||||
Simple liquids | T (°C) | η (mPa s) |
| Gases | T (°C) | η (μPa s) |
Alcohol, ethyl (grain) | 20 | 1.1 |
| Air | 15 | 17.9 |
Alcohol, isopropyl | 20 | 2.4 |
| Hydrogen | 0 | 8.42 |
Alcohol, methyl (wood) | 20 | 0.59 |
| Helium (gas) | 0 | 18.6 |
Blood | 37 | 3–4 |
| Nitrogen | 0 | 16.7 |
Ethylene glycol | 25 | 16.1 |
| Oxygen | 0 | 18.1 |
Ethylene glycol | 100 | 1.98 |
| Complex materials | T (°C) | η (Pa s) |
Freon 11 (propellant) | −25 | 0.74 |
| Caulk | 20 | 1000 |
Freon 11 (propellant) | 0 | 0.54 |
| Glass | 20 | 1018–1021 |
Freon 11 (propellant) | +25 | 0.42 |
| Glass, strain pt. | 504 | 1015.2 |
Freon 12 (refrigerant) | -15 | ? |
| Glass, annealing pt. | 546 | 1012.5 |
Freon 12 (refrigerant) | 0 | ? |
| Glass, softening pt. | 724 | 106.6 |
Freon 12 (refrigerant) | +15 | 0.20 |
| Glass, working pt. |
| 103 |
Glycerin | 20 | 1420 |
| Glass, melting pt. |
| 101 |
Glycerin | 40 | 280 |
| Honey | 20 | 10 |
Helium (liquid) | 4 K | 0.00333 |
| Ketchup | 20 | 50 |
Mercury | 15 | 1.55 |
| Lard | 20 | 1000 |
Milk | 25 | 3 |
| Molasses | 20 | 5 |
Oil, vegetable, canola | 25 | 57 |
| Mustard | 25 | 70 |
Oil, vegetable, canola | 40 | 33 |
| Peanut butter | 20 | 150–250 |
Oil, vegetable, corn | 20 | 65 |
| Sour cream | 25 | 100 |
Oil, vegetable, corn | 40 | 31 |
| Syrup, chocolate | 20 | 10–25 |
Oil, vegetable, olive | 20 | 84 |
| Syrup, corn | 25 | 2–3 |
Oil, vegetable, olive | 40 | ? |
| Syrup, maple | 20 | 2–3 |
Oil, vegetable, soybean | 20 | 69 |
| Tar | 20 | 30,000 |
Oil, vegetable, soybean | 40 | 26 |
| Vegetable shortening | 20 | 1200 |
Oil, machine, light | 20 | 102 |
|
|
|
|
Oil, machine, heavy | 20 | 233 |
|
|
|
|
Oil, motor, SAE 20 | 20 | 125 |
|
|
|
|
Oil, motor, SAE 30 | 20 | 200 |
|
|
|
|
Oil, motor, SAE 40 | 20 | 319 |
|
|
|
|
Propylene glycol | 25 | 40.4 |
|
|
|
|
Propylene glycol | 100 | 2.75 |
|
|
|
|
Water | 0 | 1.79 |
|
|
|
|
Water | 20 | 1.00 |
|
|
|
|
Water | 40 | 0.65 |
|
|
|
|
Water | 100 | 0.28 |
|
|
|
|