UNIT 8
Annotations, layering & other functions
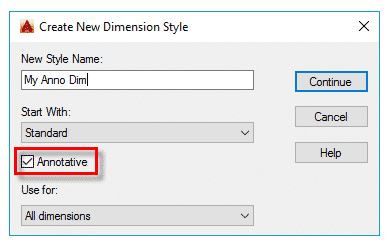
To make annotative dimension style type DIMSTYLE on the command line and press enter. A new dimension style manager window will pop up, click on the new button on right side of this window. Now give your dimension style a name, I am naming it as “My Anno Dim” and check the annotative radio button then click on continue.
New dimension style window will pop up with multiple tabs, select text tab and change the size of text to 1/8” or whatever paper height of text you want to keep in all scales. Similarly, change arrow size from symbols and arrow tab to 1/8”.
If you already have a dimension style for your drawing and you want to make that style annotative then select your dimension style from dimension style manager then go to fit tab and check the annotative radio button from the scale for dimension features panel.
Click on OK to close new dimension style manager and then click on close from dimension style manager window too.
Now our drawing is prepared with a new annotative dimension. Make My Anno Dim dimension style current by selecting it from dimension style drop down and add dimensions to the drawing in model space using current annotative dimension style.
Layer control
If you haven’t tried the AutoCAD ribbon yet, I highly recommend it – Give it a whirl. One of the few problems I have with the Ribbon UI is that you need to switch to the ‘Home’ tab every time you want to change Layer.
Use the Edit Length command to change the length of linear or curved entities and the included angle of Arcs. You can lengthen or shorten Lines, open Poly Lines, Arcs, elliptical Arcs, and open Splines.
Unlike the Extend and Trim commands, Edit Length works without a boundary edge. It extends or trims an entity to a specific value or a ratio of its original size. You can also use dynamic dragging to change the length of entities. The command changes the length of an entity in its existing direction and at the end point closest to the selection point.
To change the length of an entity:
- Click Modify > Change Length (or type Edit Length).
- In the graphics area, select an entity or specify an option:
Dynamic: Lets you specify an entity, drag it to its new length, and click to fix the length.
Increment: Extends or reduces the endpoint of an entity by the distance you specify using the keyboard or by clicking two points. Specify a positive delta to increase or a negative delta to decrease the length. Specify the Angle option to increase or decrease the included angle.
Percent: Lengthens or reduces by a defined ratio of the original size. For an Arc, the percentage is based on its circumference. 200% doubles the length of the Line or Arc; 50% reduces it by half.
Total: Changes the total length of a Line or Arc to the specified dimension. The current length of the specified entity displays in parentheses. Specify the Angle option to increase or decrease the included angle.
- Change the length of more entities or press Enter.
Access
- Command: Edit Length
- Menu: Modify > Change Length
Plot to PDF:
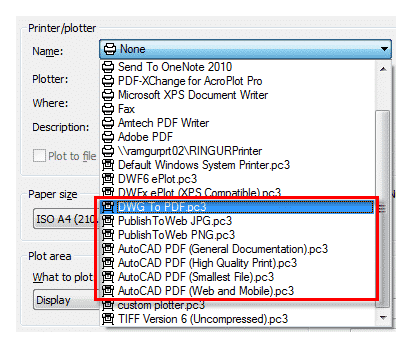
To plot a drawing to PDF press CTRL+P on keyboard or type PLOT on the command line and press enter, this will open plot window in AutoCAD. Select DWG to PDF.pc3 plotter from the list of plotters.
PDF Export:
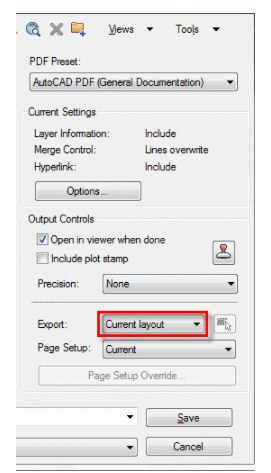
Type EPDF on the command line and press enter to start the export PDF command. Select the preset from PDF Preset drop-down menu. You can customize this preset using options button of Current settings panel as shown in the image below.
The PDF settings can be changed as per your requirement using Options button, I have discussed the PDF options settings in next section of the article.
PDF Options:
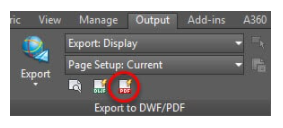
The 2016 version of AutoCAD saw some major enhancements in the PDF feature. This included additional PDF plotters with various quality preset and an option to control properties of PDF. You can customize all of these PDF related settings from Export to DWF/PDF panel of Output window as shown in the image below.
Publish to PDF:
One of the advantages of the Publish option is the ability to plot multi-sheet PDF files. To use this option type PUBLISH on the command line and press enter. From Publish to drop-down menu of Publish window select PDF as format and click on Publish Options button as shown in the image below.

From PDF Publish options window select the Multi-sheet file radio button and adjust settings if you want, click on ok and select Publish. Specify the location where you want to save the PDF file and click on Select button to get the final output.
Let us suppose that a transparent plane has been set up between an object and the station point of an observer's eye. The intersection of this plane with the rays formed by lines of sight from the eye to all points of the object would give a picture that is practically the same as the image formed in the eye of the observer. This is perspective projection.
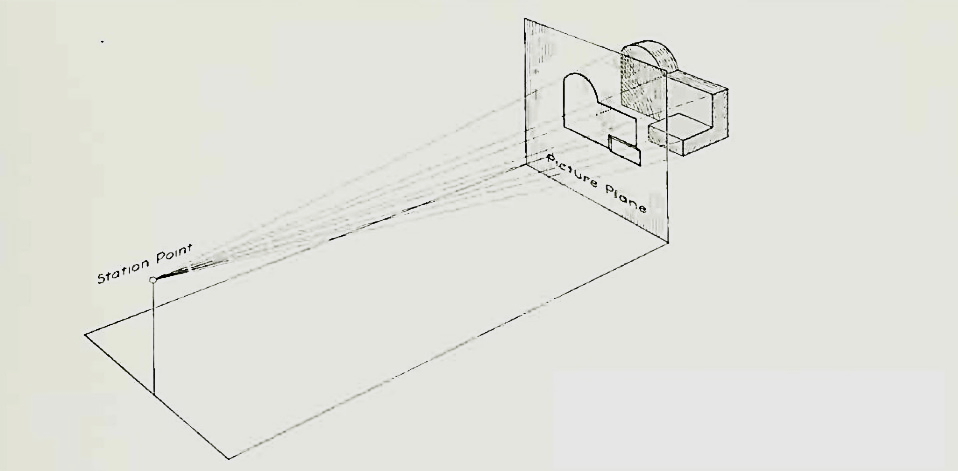
Figure 1 Perspective projection. The rays of the projection converge at the station point from which the object is observed.
If the observer would then walk backward from the station point until he reached a theoretically infinite distance, the rays formed by lines of sight from his eye to the object would grow longer and finally become infinite in length, parallel to each other, and perpendicular to the picture plane. The image so formed on the picture plane is what is known as "orthographic projection." See Fig.
2.
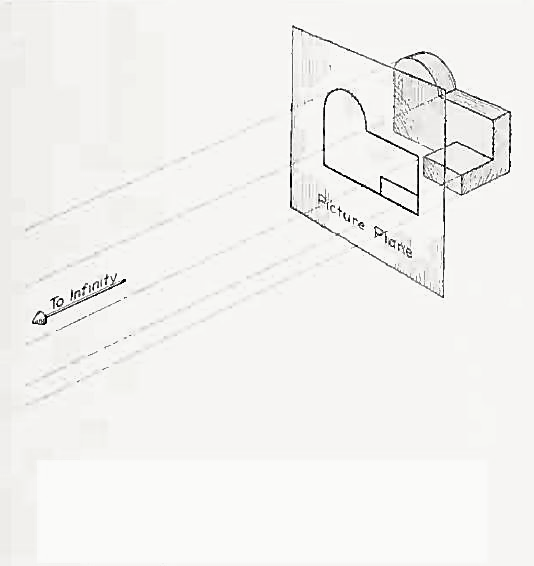
Orthographic projection.
Basically, orthographic projections could be defined as any single projection made by dropping perpendiculars to a plane. However, it has been accepted through long usage to mean the combination of two or more such views, hence the following definition has been put forward: Orthographic projection is the method of representing the exact shape of an object by dropping perpendiculars from two or more sides of the object to planes, generally at right angles to each other; collectively, the views on these planes describe the object completely. (The term "orthogonal" is sometimes used for this system of drawing.)
Orthographic views:
The rays from the picture plane to infinity may be discarded and the picture, or "view," thought of as being found by extending perpendiculars to the plane from all points of the object, This picture, or projection on a frontal plane, shows the shape of the object when viewed from the front, but it does not tell the shape or distance from front to rear. Accordingly, more than one projection are required to describe the object.
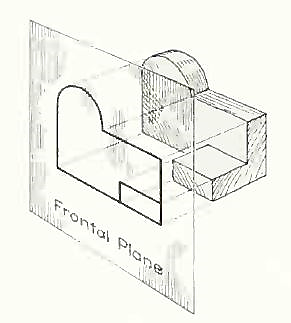
The frontal plane of projection. This produces the front view of the object.
In addition to the frontal plane, imagine another transparent plane placed horizontally above the object The projection on this plane, found by extending perpendiculars to it from the object, will give the appearance of the object as if viewed from directly above and will show the distance from front to rear.
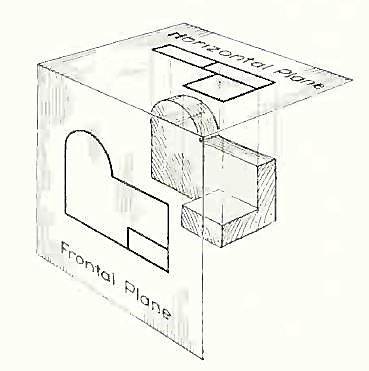
The frontal and horizontal planes of projections. Projection on the horizontal plane produces the top view of the object.
If this horizontal plane is now rotated into coincidence with the frontal plane, the two views of the object will be in the same plane, as if on a sheet of paper.
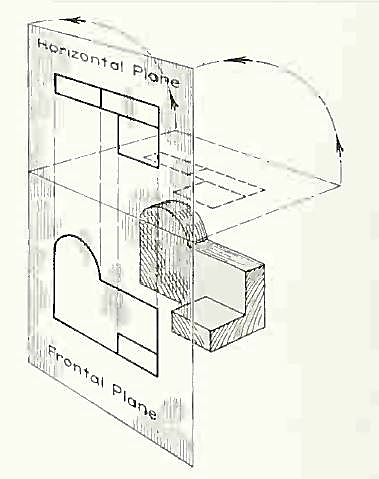
The horizontal plane rotated into the same plane as the frontal plane.
Now imagine a third plane, perpendicular to the first two. This plane is called a "profile plane," and a third view can be projected on it. This view shows the shape of the object when viewed from the side and the distance from bottom to top and front to rear.
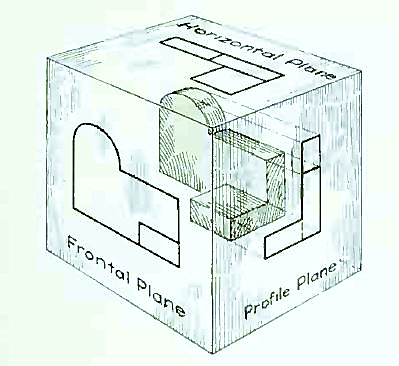
The three planes of projection: frontal, horizontal and profile. Each is perpendicular to other two.
The horizontal and profile planes are shown rotated into the same plane as the frontal plane (again thought of as the plane of the drawing paper). Thus, related in the same plane, they give correctly the three-dimensional shape of the object.
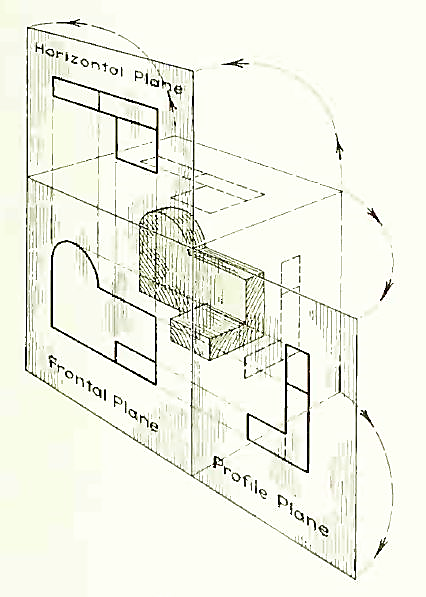
The horizontal and profile planes rotated into the same plane as the frontal plane. This makes it possible to draw three views of the object.
In orthographic projection the picture planes are called "planes of projection"; and the perpendiculars, "projecting lines" or "projectors."
A solid has three dimensions, the length, breadth and thickness or height. A solid may be represented by orthographic views, the number of which depends on the type of solid and its orientation with respect to the planes of projection. Solids are classified into two major groups.
(i) Polyhedron, and
(ii) Solids of revolution
Polyhedron
A polyhedron is defined as a solid bounded by plane surfaces called faces.
They are:
(i) Regular polyhedron
(ii) Prisms and
(iii) Pyramids.
Regular Polyhedron
A polyhedron is said to be regular if its surfaces are regular polygons. The following are some of regular polyhedrons.
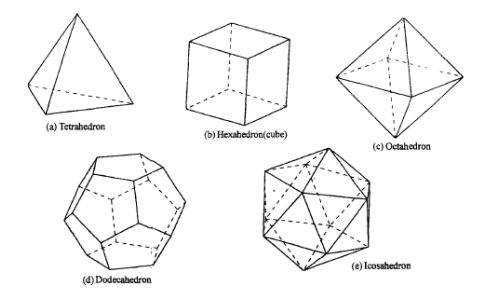
(a) Tetrahedron: It consists of four equal faces, each one being a equilateral triangle.
(b) Hexahedron (cube): It consists of six equal faces, each a square.
(c) Octahedron: It has eight equal faces, each an equilateral triangle.
(d) Dodecahedron: It has twelve regular and equal pentagonal faces.
(e) Icosahedron: It has twenty equal, equilateral triangular faces.
Prisms
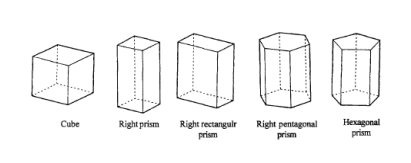
A prism is a polyhedron having two equal ends called the bases parallel to each other. The two bases are joined by faces, which are rectangular in shape. The imaginary line passing through the centers of the bases is called the axis of the prism. A prism is named after the shape of its base. For example, a prism with square base is called a square prism; the one with a pentagonal base is called a pentagonal prism, and so on.
Pyramids
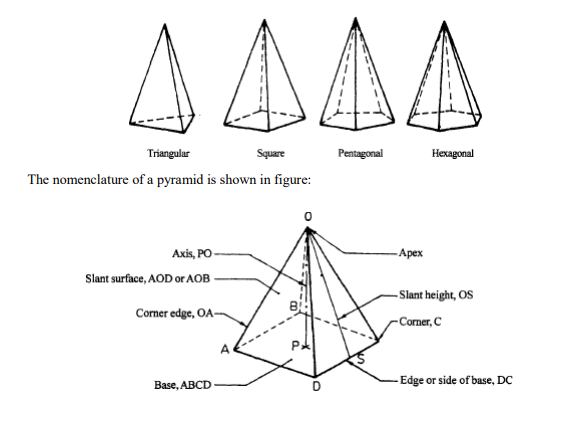
A pyramid is a polyhedron having one base, with a number of isosceles triangular faces, meeting at a point called the apex. The imaginary line passing through the centre of the base and the apex is called the axis of the pyramid. The pyramid is named after the shape of the base. Thus, a square pyramid has a square base and pentagonal pyramid has pentagonal base and so on.
Drawing annotation
Annotation objects include dimensions, notes, and other types of explanatory symbols or objects commonly used to add information to your drawing.
Annotation objects provide information about a feature, such as the length of a wall, the diameter of a fastener, or a detail callout. Typically, annotation objects are scaled differently than the views of the drawing, and depend on the scale of how they should appear when plotted.
You can control the method that an annotation object is scaled by defining the object either as non-annotative or annotative.
Non-annotative objects, require a fixed size or scale that is calculated based on the scale used to plot the drawing.
Annotative objects automatically adjust to display uniformly at the same size or scale regardless of the scale of the view.
Computer-aided design (CAD) software modeling of parts and assemblies
Computer-aided design (CAD) services assist in the computerized design, three-dimensional (3D) modeling, and printing and drafting of engineering components and assemblies. Computer-aided (CAD) services include specialized programs that help operators draw schematics for printed circuit boards (PCB), electronic or mechanical components, and systems for computer aided manufacturing (CAM). Some companies specialize in analog design or backplane design. Others specialize in 3D modeling.
Computer-aided design services or CAD services are particularly useful in computer-aided manufacturing (CAM) applications. A computer aided manufacturing (CAM) system integrates computer-aided design drawings and schematics with the motion control component of an automated manufacturing machine. Computer-aided manufacturing software is used to sequence processes on a variety of machines, milling and turning equipment, integrated circuit design systems, and other mechanical engineering applications.
Wireframe Modeling
• Developed in 1960s and referred as “a stick figure” or “an edge
Representation”
• The word “wireframe” is related to the fact that one may imagine a wire that is bent to follow the object edges to generate a model.
• Model consists entirely of points, lines, arcs and circles, conics, and curves.
• In 3D wireframe model, an object is not recorded as a solid.
Instead the vertices that define the boundary of the object, or the intersections of the edges of the object boundary are recorded as a collection of points and their connectivity
Editing 2D views
When you need to edit 3D model graphics in a 2D view, double-click the view. You can also use the Draw in View command on the shortcut menu.
If the 2D view graphics were created from the 2D Model sheet as a block, or dragged onto the sheet as a file, then you can use the Open command on the shortcut menu to open the graphics for editing. Or you can use the Unblock command to drop the block to its base elements for individual manipulation.
If you created the 2D view associatively, you can edit the driving dimensions to modify the graphics. When you close the 2D view, the driven dimensions you placed on the sheet will update.
Planar projection theory
Planar projections are the subset of 3D graphical projections constructed by linearly mapping points in three-dimensional space to points on a two-dimensional projection plane. The projected point on the plane is chosen such that it is collinear with the corresponding three-dimensional point and the centre of projection. The lines connecting these points are commonly referred to as projectors.
The centre of projection can be thought of as the location of the observer while the plane of projection is the surface on which the two dimensional projected image of the scene is recorded or from which it is viewed (e.g., photographic negative, photographic print, computer monitor). When the centre of projection is at a finite distance from the projection plane, a perspective projection is obtained. When the centre of projection is at infinity, all the projectors are parallel, and the corresponding subset of planar projections are referred to as parallel projections.
Dimensioning guidelines, tolerancing techniques
Geometric Dimensioning and Tolerancing (GD&T) is a system for defining and communicating engineering tolerances. It uses a symbolic language on engineering drawings and computer-generated three-dimensional solid models that explicitly describe nominal geometry and its allowable variation. It tells the manufacturing staff and machines what degree of accuracy and precision is needed on each controlled feature of the part. GD&T is used to define the nominal (theoretically perfect) geometry of parts and assemblies, to define the allowable variation in form and possible size of individual features, and to define the allowable variation between features.
Dimensioning specifications define the nominal, as-modeled or as-intended geometry. One example is a basic dimension.
Tolerancing specifications define the allowable variation for the form and possibly the size of individual features, and the allowable variation in orientation and location between features. Two examples are linear dimensions and feature control frames using a datum reference (both shown above).