UNIT 2
Sample survey
Population
A well-organized procedure of gathering, recording and analyzing information regarding the members of the population is called a census. Under method census each and every unit of the universe is included in the collection of data. Huge amount of finance, time and labour are required for gathering information. This method is useful to find out the ratio of male to female, the ratio of literate to illiterate people, the ratio of people living in urban areas to the people in rural areas.
Merits
- It helps government with future plans
- It gives complete information about population
- It gives more reliable and accurate information
- It covers wide range of the study
Demerits
- It is time consuming and expensive
- Sometimes we many loose information while investing all individual
- It need a number of manpower
Sampling units
A sampling unit can refer to any single person, animal, plant, product or ‘thing’ being researched. Sampling units are taken from an entire population, such as a country, customer database or region, and put into a smaller group to form a research sample. This group of units is then used to research, analyse and draw conclusions on.
Example - conducting research using a sample of university students, a single university student would be a sampling unit.
Sampling variances
The variance is mathematically defined as the average of the squared differences from the mean. In order to understand what you are calculating with the variance, break it down into steps:
Step 1: Calculate the mean (the average weight).
Step 2: Subtract the mean and square the result.
Step 3: Work out the average of those differences.
Sample survey
The sample is a small segment considered for study which represents the standard of entire population. The selection of sample should give justifiable conclusion about the whole population. When the population size is very large and it is difficult to consider all members then sampling method is used. Under this method selection of appropriate representative sample is utmost important. On the basis of data collected from sample, conclusion is drawn for the whole population.
Types of sampling method
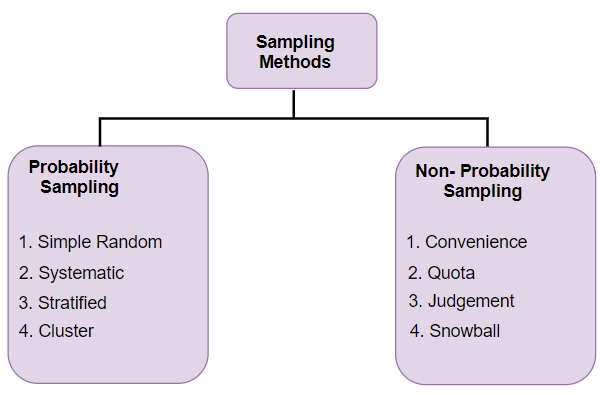
- Probability sampling
- It is also called as random sampling
- Random sampling is one of the simplest sampling technique in which each sample have an equal chance of being chosen from the population
- It is an unbiased representation of the population
Types of random sampling
- Simple random sampling – It is one of the basic and easiest form of random sampling. Simple random sampling assures that every member have an equal chance of being included in the sample.
2. Stratified random sampling – It is also known as proportional random sampling. In this sampling technique, the populations are split into different groups. The overall sample selected randomly from different groups. This techniques guarantee that each group will be represented in sample.
3. Systematic random sampling – systematic random sampling refers to selecting sample on a system of interval in a numbered population.
4. Cluster random sampling – under cluster sampling, the researcher divide the population into separate groups known as cluster. Here each cluster represents the population as a whole. The researcher randomly selects the cluster for his analysis.
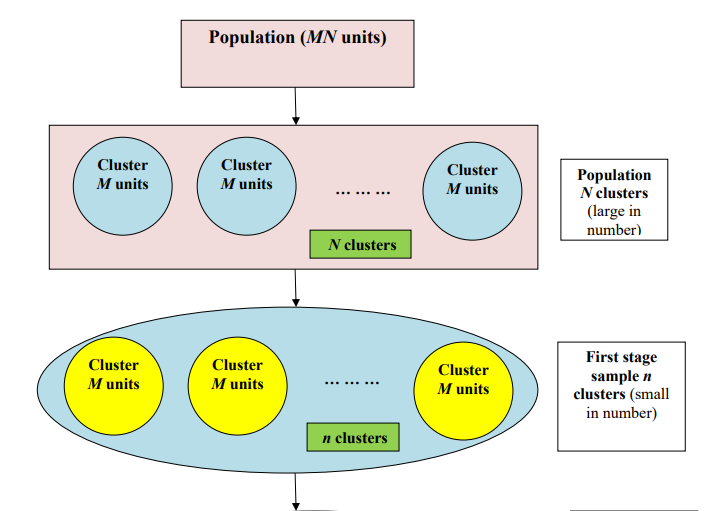
Two sampling stage - In cluster sampling, all the elements in the selected clusters are surveyed. Moreover, the efficiency in cluster sampling depends on the size of the cluster. As the size increases, the efficiency decreases. It suggests that higher precision can be attained by distributing a given number of elements over a large number of clusters and then by taking a small number of clusters and enumerating all elements within them. This is achieved in sub sampling.
In sub sampling
- Divide the population into clusters.
- Select a sample of clusters [first stage}
- From each of the selected cluster, select a sample of the specified number of elements [second stage]
- A pictorial scheme of two stage sampling scheme is as follows:

b. Non random sampling –
- It is also called as non probability sampling
- Non random sampling is one of the sampling technique in which each sample does not have an equal chance of being chosen from the population
- It is an biased representation of the population
Types of non random sampling
- Convenience sampling – under this technique, the samples are selected because they are easily accessible to the researcher. This technique is easiest, cheapest and less time consuming
2. Consecutive sampling – It is similar like convenience sampling. Under this technique all subjects that are available as a part of sample are included which result a better presentation of the entire population
3. Quota sampling – Under quota sampling, the samples are selected on the same proportions of individuals as the entire population depending on characteristics, traits as the basis of quota.
4. Judgmental sampling - Judgmental sampling is more commonly known as purposive sampling. The researcher keeps a specific purpose in mind and selects the subject for sampling process. The researcher believes that some subjects are fit for the research compared to other individuals.
Advantages of Purposive Sampling (Judgment Sampling)
- Purposive sampling is one of the most cost-effective and time-effective sampling methods available
- If there are only limited number of primary data sources who can contribute to the study purposive sampling may be the only appropriate method available
Disadvantages of Purposive Sampling (Judgment Sampling)
- Vulnerability to errors in judgment by researcher
- Low level of reliability and high levels of bias.
- Inability to generalize research findings
5. Snowball sampling – this technique is used when the population size is small. Under snowball sampling, the researcher ask initial subject to identify another potential subject who meets the criteria of research. Thus, this technique hardly represents the population.
Key takeaways – sample survey can be probability sampling and non probability sampling
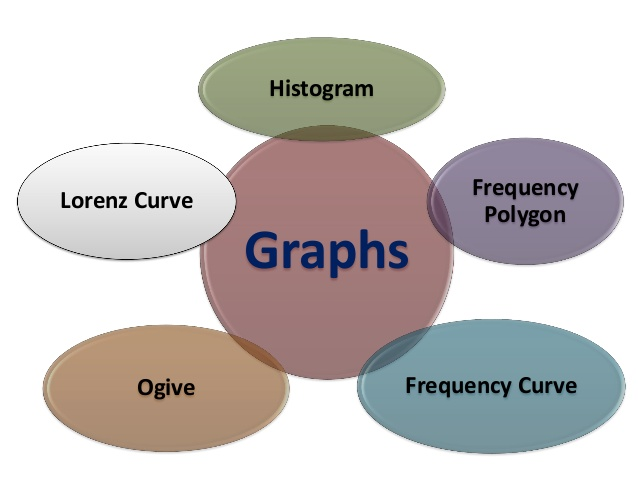
A graph is a visual form of presentation of statistical data. A graph is more attractive than a table of figure. It helps the common man to understand more efficiently and effectively. It facilitates comparisons between two or more phenomena very easily.
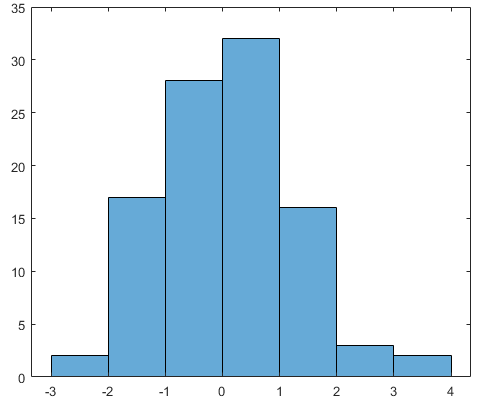
Histogram – histogram is a bar graph representing the frequency of occurrence by classes of data. In histogram data are plotted as a series of rectangle. ‘X axis’ consist of class intervals and ‘Y axis’ shows the frequencies. It is also called stair case or block diagram. Histogram is not suitable for open ended classes.
Bar chart – bar diagram is also called as Bar Graph is used to display the category of data and it compares the data using solid bars to represent the quantities.
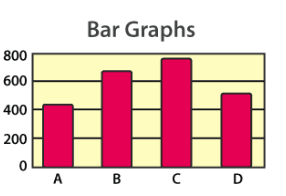
Pie chart – pie chart divides the numerical proportion into slices. Pie diagram is based on a circle where the frequencies of the variables are expressed in degree. It is widely used in the business world and the mass media.
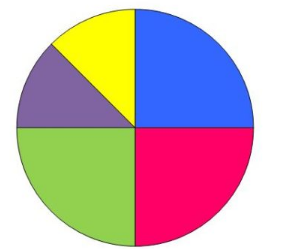
Frequency polygon –a frequency polygon is a graph where midpoints of each interval are joined by using lines. The heights of the points represent the frequencies. It is usually done by creating a histogram or by calculating the midpoints of each interval from the frequency distribution table.
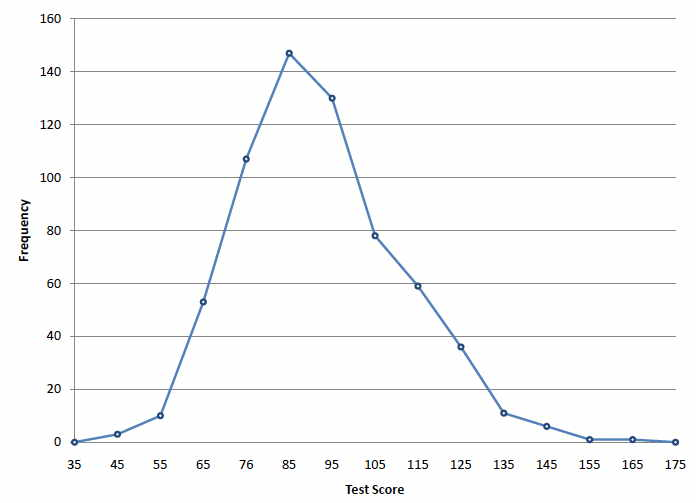
Frequency curve – a frequency curve is a smooth curve obtained by joining the midpoints of all rectangles forming histogram. It is drawn by using free hand. The curve should begin and end at the base line.
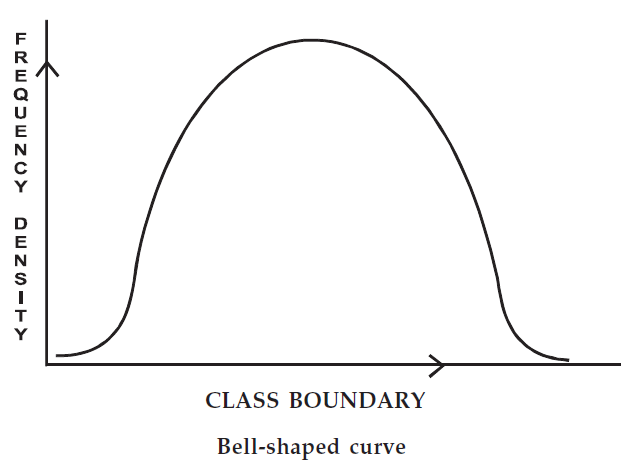
Ogive – An ogive graph shows cumulative frequency in statistics. It estimates the number of observations less than a given value or more than a given value. Cumulative frequency is obtained by adding to the given value
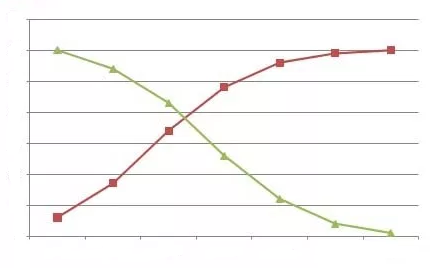
Less than ogive method - The frequencies of all preceding classes are added to the frequency of a class.
More than ogive class - The frequencies of the succeeding classes are added to the frequency of a class
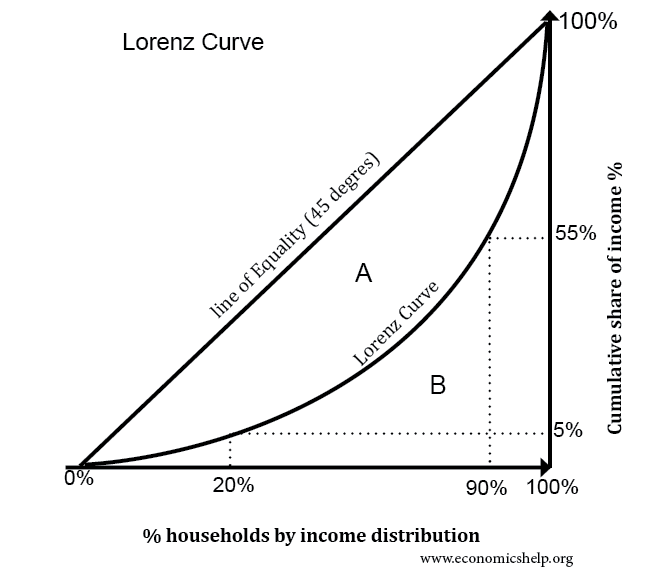
Lorenz curve – It is the graphical representation of income and wealth. It was developed by Max O. Lorenz in 1905. The Lorenz curve shows how wealth, revenue, land, etc are not equally distributed among the people.
Key takeaways - A graph is a visual form of presentation of statistical data. Graph can be histogram, olives, frequency curve
Sources
I.B. N. Gupta : Business Math & Statistics
II. S. P. Singh : Statistics
III. Mukund Lal : Statistics
IV. K. N. Nayar : Statistics
V. C. B. Gupta : Statistics
VI. Shukla & Sahay : Statistical Analysis
VII. C. D. Gupta : Statistical Analysis
VIII. D. N. Elhana : Statistical Analysis