UNIT 5
Isometric Projection
Isometric projection is a type of pictorial projection in which the three dimensions of a solid are not only shown in one view, but their actual sizes can be measured directly from it.
If a cube is placed on one of its corners on the ground with a solid diagonal perpendicular to the V.P., the front view is the isometric projection of the cube. The step-by-step construction is shown in fig. 1.
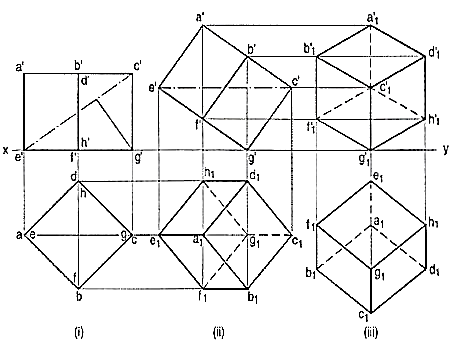
Figure 1
To draw the projections of a cube of 25 mm long edges resting on the ground on one of its corners with a solid diagonal perpendicular to the V.P., assume the cube to be resting on one of its faces on the ground with a solid diagonal parallel to the V.P.
(i) Draw a square abed in the top view with its sides inclined at 45° to xy. The line ac representing the solid diagonals AG and CE is parallel to xy. Project the front view.
(ii) Tilt the front view about the corner g' so that the line e' c' becomes parallel to xy. Project the second top view. The solid diagonal CE is now parallel to both the H.P. And the V.P.
(iii) Reproduce the second top view so that the top view of the solid diagonal, viz. e1 c1 is perpendicular to xy. Project the required front view.
Fig. 2 shows the front view of the cube in the above position, with the corners named in capital letters. Its careful study will show that
(a) All the faces of the cube are equally inclined to the V.P. And hence, they are seen as similar and equal rhombuses instead of squares.
(b) The three lines CB, CD and CG meeting at C and representing the three edges of the solid right-angle are also equally inclined to the V.P. And are therefore, equally foreshortened. They make equal angles of 120° with each other. The line CG being vertical, the other two lines CB and CD make 30° angle each, with the horizontal.
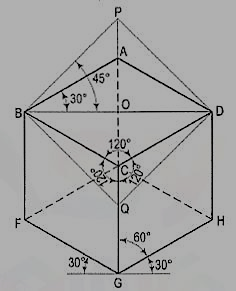
Figure 2
(c) All the other lines representing the edges of the cube are parallel to one or the other of the above three lines and are also equally foreshortened.
(d) The diagonal BO of the top face is parallel to the V.P. And hence, retains its true length.
This chapter deals with various topics of isometric projection as shown below:
1. Isometric axes, lines and planes
2. Isometric scale
3. Isometric drawing or isometric view
4. Isometric graph.
Isometric axes, lines and planes:
The three lines CB, CD and CG meeting at the point C and making 120° angles with each other are termed isometric axes. The lines parallel to these axes are called isometric lines. The planes representing the faces of the cube as well as other planes parallel to these planes are called isometric planes.
As all the edges of the cube are equally foreshortened, the square faces are rhombuses. The rhombus ABCD (fig. 2) shows the isometric projection of the top square face of the cube in which BO is the true length of the diagonal.
Construct a square BQDP around BO as a diagonal. Then BP shows the true length of BA.
In triangle ABO, 
In triangle PBO, 

The ratio,  .
.
Thus, the isometric projection is reduced in the ratio  , i.e. the isometric lengths are 0.815 of the true lengths.
Therefore, while drawing an isometric projection, it is necessary to convert true lengths into isometric lengths for measuring and marking the sizes. This is conveniently done by constructing and making use of an isometric scale as shown below.
a) Draw a horizontal line BO of any length (fig. 3). At the end B, draw lines BA and BP, such that L OBA = 30° and L OBP = 45°. Mark divisions of true length on the line BP and from each division-point, draw verticals to BO meeting BA at respective points. The divisions thus obtained on BA give lengths on isometric scale.
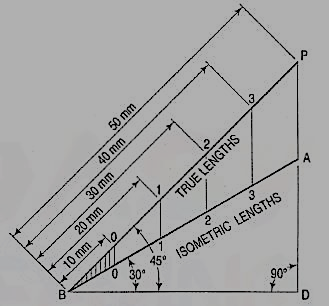
Figure 3
(b) The same scale may also be drawn with divisions of natural scale on a horizontal line AB (fig. 4). At the ends A and B, draw lines AC and BC making 15° and 45° angles with AB respectively, and intersecting each other at C.
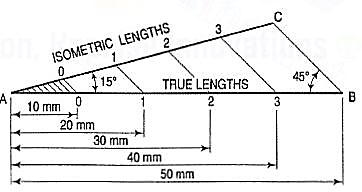
Figure 4
From division-points of true lengths on AB, draw lines parallel to BC and meeting AC at respective points. The divisions along AC give lengths to isometric scale.
The lines BO and AC (fig. 2) represent equal diagonals of a square face of the cube, but are not equally shortened in isometric projection. BO retains its true length, while AC is considerably shortened. Thus, it is seen that lines which are not parallel to the isometric axes are not reduced according to any fixed ratio. Such lines are called non-isometric lines. The measurements should, therefore, be made on isometric axes and isometric lines only. The non-isometric lines are drawn by locating positions of their ends on isometric planes and then joining them.
If the foreshortening of the isometric lines in an isometric projection is disregarded and instead, the true lengths are marked, the view obtained [fig. 5(iii)] will be exactly of the same shape but larger in proportion (about 22.5%) than that obtained using the isometric scale [fig. 5(ii)]. Due to the ease in construction and the advantage of measuring the dimensions directly from the drawing, it has become a general practice to use the true scale instead of the isometric scale.
To avoid confusion, the view drawn with the true scale is called isometric drawing or isometric view, while that drawn with the use of isometric scale is called isometric projection.
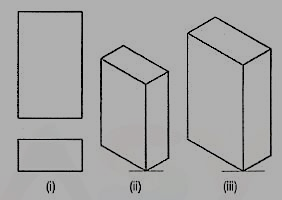
Figure 5
Referring again to fig. 2, the axes BC and CD represent the sides of a right angle in horizontal position. Each of them together with the vertical axis CG, represents the right angle in vertical position. Hence, in isometric view of any rectangular solid resting on a face on the ground, each horizontal face will have its sides parallel to the two sloping axes; each vertical face will have its vertical sides parallel to the vertical axis and the other sides parallel to one of the sloping axes.
In other words, the vertical edges are shown by vertical lines, while the horizontal edges are represented by lines, making 30° angles with the horizontal. These lines are very conveniently drawn with the T-square and a 30°-60° set-square or drafter.
Isometric Graph:
An isometric graph as shown in fig. 6 facilitates the drawing of isometric view of an object. Students are advised to make practice for drawing of isometric view using such graphs.
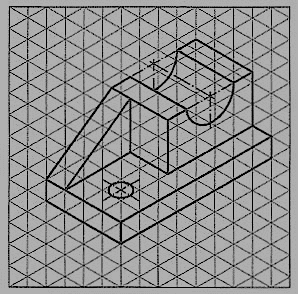
Problem:
1. The front view of a square is given in fig. 7 (i). Draw its isometric view.
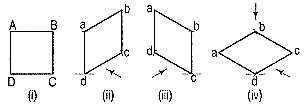
Figure 7
As the top view is a square, the surface of the square is horizontal. In isometric view, all the sides will be drawn inclined at 30° to the horizontal.
(i) From any point d [fig. 7(iv)], draw two lines da and dc inclined at 30° to the horizontal and making 120° angle between themselves.
(ii) Complete the rhombus abed which is the required isometric view.
2. Fig. 8 (i) shows the front view of a circle whose surface is parallel to the V.P. Draw the isometric view of the circle.
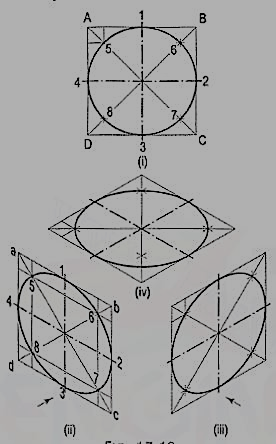
Figure 8
I. Method of points:
(i) Enclose the circle in a square, touching it in points 1, 2, 3 and 4. Draw the diagonals of the square cutting the circle in points 5, 6, 7 and 8.
(ii) Draw the isometric view of the square [fig. 8 (ii) and [fig. 8 (iii)] and on it mark the mid-points 1, 2, 3 and 4 of its sides. Obtain points 5, 6, 7 and 8 on the diagonals.
If the view given in fig. 8 (i) is the top view of a circle whose surface is horizontal, its isometric view will be as shown in fig. 8 (iv).
As the isometric views have been drawn with the true scale, the major axis of the ellipse is longer than the diameter of the circle.
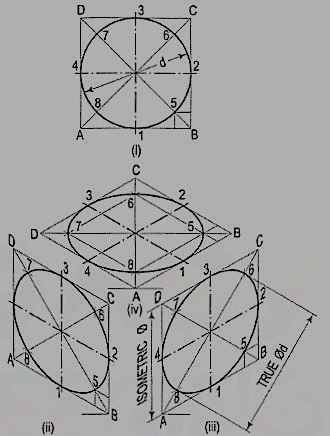
Figure 9
Fig. 9 (ii), fig. 9 (iii) and fig. 9 (iv) show the isometric projection of the circle drawn with isometric scale. Note that when the length of the side of the rhombus is equal to the isometric diameter of the circle, the length of the major axis of the ellipse is equal to the true diameter of the circle.
II. Four-center method:
Draw the isometric view of the square [fig. 10 (i)]. Draw perpendicular bisectors of the sides of the rhombus, intersecting each other on the longer diagonal at points p and q, and which meet at the 120°-angles b and d.
Or, draw lines joining the 120°-angles b and d with the mid-points of the opposite sides and intersecting each other on the longer diagonal at points p and q. Two of these lines will be drawn horizontal, while the other two will make 60°-angles with the horizontal. With centres b and d, draw arcs 3-4 and 1-2 respectively. With centres p and q, draw arcs 1-4 and 2-3 respectively and complete the required ellipse. Fig. 10 (ii) shows the ellipse obtained in the rhombus drawn in the direction of the other sloping axis. Fig. 10 (iii) shows the isometric view of the circle when its surface is horizontal.
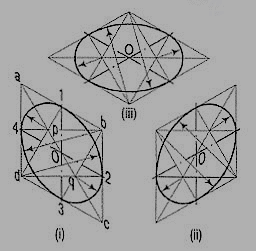
Figure 10
The ellipse obtained by the four-centre method is not a true ellipse and differs considerably in size and shape from the ellipse plotted through points. But owing to the ease in construction and to avoid the labour of drawing freehand neat curves, this method is generally employed.
Problem:
1. Fig. 11 (i) shows the front view of a semi-circle whose surface is para1lel to the V.P. Draw its isometric view.
(i) Enclose the semi-circle in a rectangle. Draw the isometric view of the rectangle [fig. 11 (ii) and [fig. 11 (iii)].
(ii) Using the four-centre method, draw the half-ellipse in it which is the required view. The centre for the longer arc may be obtained as shown or by completing the rhombus.
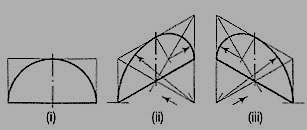
Figure 11
If the view given in fig. 11 (i) is the top view of a horizontal semi-circle, its isometric view would be drawn as shown in fig. 12 (i) and fig. 12 (ii).
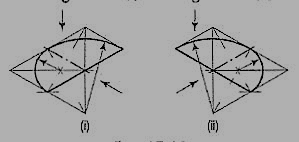
Figure 12
2. Fig. 13 (i) shows the front view of a plane parallel to the V.P. Draw its isometric view.
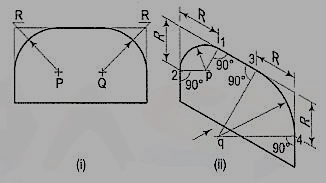
Figure 13
(i) The upper two corners of the plane are rounded with quarter circles. Enclose the plane in a rectangle.
(ii) Draw the isometric view of the rectangle. From the upper two corners of the parallelogram, mark points on the sides at a distance equal to R, the radius of the arcs. At these points erect perpendiculars to the respective sides to intersect each other at points p and q. With p and q as centres, and radii p1 and q3, draw the arcs and complete the required view.
When an object contains inclined edges which in the isometric view would be shown by non-isometric lines, the view may be drawn by using any one of the following methods:
(i) box method or
(ii) co-ordinate or offset method.
(i) Box method: This method is used when the non-isometric lines or their ends lie in isometric planes. The object is assumed to be enclosed in a rectangular box. Initially, the box is drawn in isometric. The ends of the lines for the inclined edges are then located by measuring on or from the outlines of the box.
Problem:
1. Three views of a block are given in fig. 16 (i). Draw its isometric view.
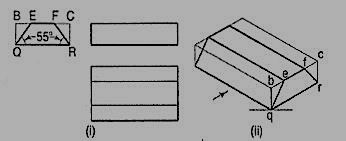
Figure 16
(i) Enclose the block in a rectangular box.
(ii) Draw the isometric view of the box [fig. 16 (ii)].
(iii) Mark points e and f on the line be such that be = BE and fc = FC.
(iv) Complete the required view as shown.
2. Draw the isometric view of the frustum of the hexagonal pyramid shown in fig. 17 (i).
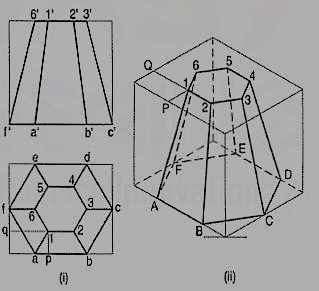
Figure 17
(i) Enclose the front view and the top view in rectangles.
(ii) Draw the isometric view of the rectangular box [fig. 17 (ii)]. Locate the six points of the base of the frustum on the sides of the bottom of the box. The upper six points on the top surface of the box are located by drawing isometric lines, e.g. P1 and Q1 intersecting at a point 1.
(iii) Join the corners and complete the isometric view as shown.
2. Co- ordinate or Offset method:
This method is adopted for objects in which neither non-isometric lines nor their ends lie in isometric planes.
Perpendiculars are dropped from each end of the edge to a horizontal or a vertical reference plane. The points at which the perpendiculars meet the plane, are located by drawing co-ordinates or offsets to the edges of the plane.
Problem:
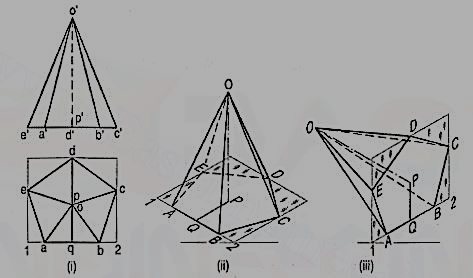
1. Draw the isometric view of the pentagonal pyramid, the projections of which are given in fig. 18 (i).
(i) Enclose the base (in the top view) in an oblong.
(ii) Draw an offset oq (i.e. pq) on the line ab.
(iii) Draw the isometric view of the oblong and locate the corners of the base in it [fig. 18 (ii)].
(iv) Mark a point Q on the line AB such that AQ = aq. From Q, draw a line QP equal to qo and parallel to 2C. At P, draw a vertical OP equal to o'p'.
(v) Join O with the corners of the base, thus completing the isometric view of the pyramid.
Fig. 18(iii) shows the isometric view of the same pyramid with its axis in horizontal position.
The orthographic view of a sphere seen from any direction is a circle of diameter equal to the diameter of the sphere. Hence, the isometric projection of a sphere is also a circle of the same diameter as explained below.
The front view and the top view of a sphere resting on the ground are shown in fig. 25 (i). C is its centre, D is the diameter and P is the point of its contact with the ground.
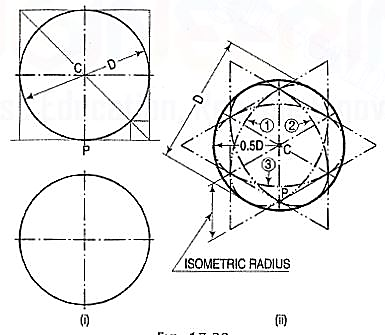
Figure 25
Assume a vertical section through the centre of the sphere. Its shape will be a circle of diameter D. The isometric projection of this circle is shown in fig. 25 (ii) by ellipses 1 and 2, drawn in two different vertical positions around the same centre C. The length of the major axis in each case is equal to D. The distance of the point P from the centre C is equal to the isometric radius of the sphere.
Again, assume a horizontal section through the centre of the sphere. The isometric projection of this circle is shown by the ellipse 3, drawn in a horizontal position around the same centre C. In this case also, the distance of the outermost points on the ellipse from the centre C is equal to O.5D.
Thus, in an isometric projection, the distances of all the points on the surface of a sphere from its centre, are equal to the radius of the sphere.
Hence, the isometric projection of a sphere is a circle whose diameter is equal to the true diameter of the sphere.
Also, the distance of the centre of the sphere from its point of contact with the ground is equal to the isometric radius of the sphere, viz. CP.
It is, therefore, of the utmost importance to note that, isometric scale must invariably be used, while drawing isometric projections of solids in conjunction with spheres or having spherical parts.
Problem:
Draw the isometric projection of a sphere resting centrally on the top of a square prism, the front view of which is shown in fig. 26 (i).
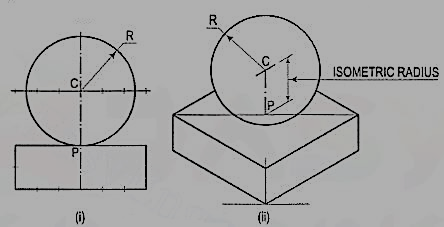
Figure 26
(i) Draw the isometric projection (using isometric scale) of the square prism and locate the centre P of its top surface [fig. 26 (ii)].
(ii) Draw a vertical at P and mark a point C on it, such that PC = the isometric radius of the sphere.
(iii) With C as centre and radius equal to the radius of the sphere, draw a circle which will be the isometric projection of the sphere.
Problems:
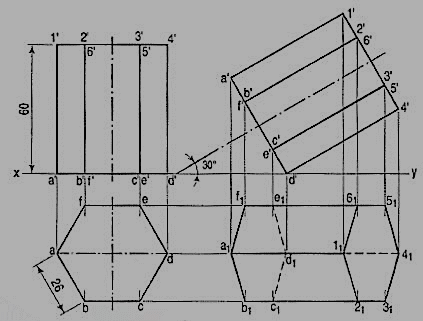
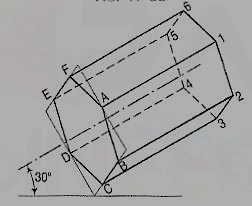
1. A hexagonal prism having the side of base 26 mm and the height of 60 mm is resting on one of the comer of the base and its axis is inclined to 30° to the H.P. Draw its projections and prepare the isometric view of the prism in the above stated condition.
(i) Draw the projections of the prism as shown in figure 27.
(ii) Construct the isometric view as shown in fig. 28.
2. The orthographic projections of the object is shown in fig. 29. Draw the isometric view of the object.
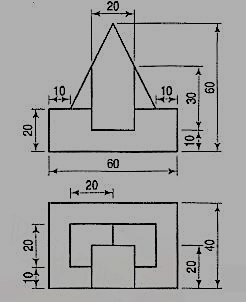
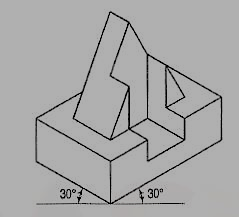
Orthographic reading is the ability to visualize the shape of an object from its drawing in orthographic views. Every engineer or technician connected with the work of construction should possess this ability. Without it, it would be difficult for him to execute, independently, any work according to a given drawing.
An engineering drawing is not read aloud. It is read mentally. The whole drawing cannot be read or interpreted at a glance. It should be read systematically and patiently. The easiest way to learn reading such a drawing is to learn how to prepare one.
However, it is not impossible to know how to read it without learning how to draw. In either case, a sound knowledge of the principles of orthographic projection is quite essential for reading the drawing without hesitation.
In orthographic projection, any one view shows only two dimensions of a three-dimensioned object. Hence, it is impossible to visualize the shape of the object from a single view. The second view shows the third dimension. Thus, at least two views are necessary to determine its shape. Sometimes, a third view is also necessary to completely visualize an object.
Reading of Orthographic views (Blue Print reading)
Every object may be imagined as consisting of many components having forms of simple solids such as prisms, cylinders, cones, etc. with some additions or subtractions or both. The additions may be in the form of projections, while the subtractions may be in the form of holes, grooves, cavities, etc. It is not possible to determine from only one view whether there is an addition or subtraction. The other view or views must be referred to.
For example, in fig. 1 (i), the meaning of lines AB and CD can be determined only after referring to the other view. They might represent a projection as shown in fig. 1 (ii) and (iii) or a cavity as shown in figs. 1 (iv) and (v) or a cavity made by projections as shown in fig. 1 (vi).
Note that one front-view represents six different types of objects whose top-view are different as shown in fig. 1.
Similarly, the two circles in fig. 2., (i) may either represent additions [fig. 2(ii) and (iii)] or holes [fig. 2(iv) and (v)] or both [fig. 2(vi) and (vii)]. Thus, every point and every line in an orthographic view has a meaning. A point may represent a corner or an edge. A line may represent an edge or a surface. The meaning of each point or line should be interpreted by systematically referring and forth from one view to the other. Simultaneously, the shape of the object should be visualized.


Figure 1 Figure 2
Missing lines and missing views:
Most of the students in Engineering Drawing course find it difficult to visualize an object from two orthographic views. To overcome this difficulty, assume the object as basic geometrical solids such as prisms, cylinders, pyramids, cones and so on. It is impossible to determine whether the shape is addition or subtraction by observing only one view. Therefore, each orthographic view of an object must be referred systematically back and forth. Sound knowledge of projections of points, lines, planes and solids is required in solving the problems of missing lines or missing views. In orthographic views, if a line or lines are not drawn in order to test the understanding of students, such lines are known as missing lines. Similarly, if amongst the three views, only two views are given then third view will be known as missing view.
Following procedure can be adopted in order to identify missing lines or missing views.
(i) From the given orthographic views, try to visualize an object and prepare a pictorial view.
(ii) From pictorial view, prepare orthographic views and compare with given views. Read carefully each line in each view and find out corresponding projection from another view. Following conclusion from the projections of lines and planes will be useful for identification of lines and planes in the given views.
(a) When a line is perpendicular to a plane, its projection on that plane is point, while its projection on the other plane is a line equal to its true length.
(b) When a line is inclined to both the planes (H.P. And V.P.), its projections are shorter than the true length in both the plane and inclinations to xy line are greater than true inclinations.
(c) When a line is parallel to a plane, its projection on that plane will show its true length and true inclination with the other plane.
(d) When a plane is perpendicular to a reference (principal planes H.P. And V.P.) plane, its projection on that plane is a straight line.
(e) When a plane is parallel to a reference plane, its projection on that plane shows its true shape and size.
(f) When a plane is perpendicular to one of the reference plane and inclined to the other, its inclination is shown by the angle which its projection on the plane to which it is perpendicular, makes with xy line. Its projection on the plane to which it is inclined, is smaller than the plane itself.
(iii) Remember that each line in one view, represents a plane in another view depending upon the position of the plane with reference to the plane of projection. When a line is observed in any two views, it will be plane in third view.
Problem:
1.In fig. 3(i) two views are given. Draw its missing view and show missing lines.
Ans: See fig. 3 (ii)
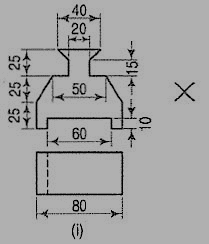

Figure 3(i & ii)
2. In fig. 4(i) two views are given. Draw its pictorial view and missing view.
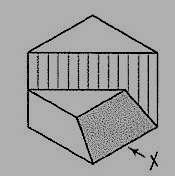
Figure 4(i)
Ans.: Fig. 4(ii)
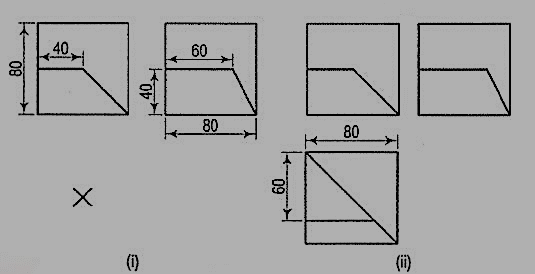
Figure 4(ii)
3. In fig. 5 two views are given. Draw its missing view and show missing lines along with its pictorial view.
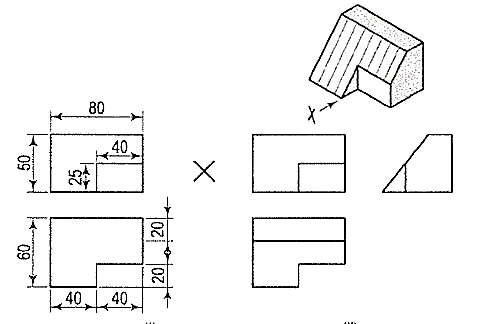
Figure 5
Identification of planes:
1. Two views (front view and top view) are given in fig. 6 (i). Draw third view (side view) and identify each plane.
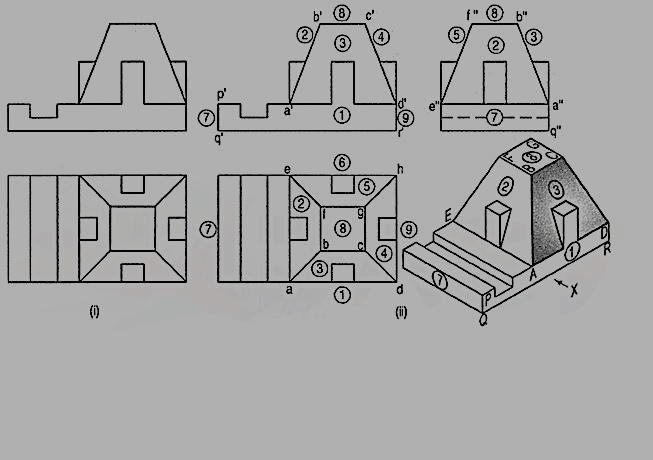
Figure 6
2. Two views of a casting are shown in fig. 7. Using both first angle projection method and third angle projection method, draw the given views and add following views
(i) the side view looking from the right and
(ii) a sectional side section A-A.
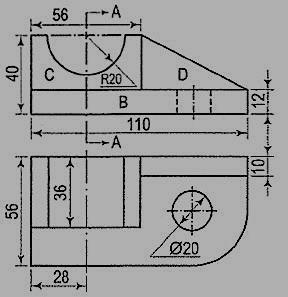
Figure 7(i)
Step 1: The shape of the casting may be visualized by imagining it to be broken up in three components B, C and D.
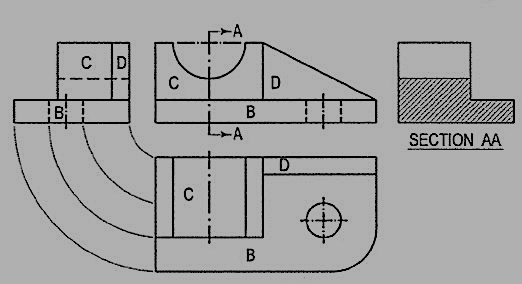
Figure 7(ii)
Step 2: After referring to both the views, it can be visualized that the part B is in the form of a rectangular block with one corner rounded, and having a circular hole.
The component C has a semi-circular cavity at its top, while the part D is a wedge-shaped piece of uniform thickness. The side view of each part may be imagined separately and then projected from the two views as shown in fig. 7(ii).
Step 3: The sectional side view is obtained by imagining the block to be cut in two parts through the line A-A. The portion that is cut is shown in section by means of section lines. Note that the curved surface of the cavity behind the cutting-plane line is also shown as a rectangle in the sectional view. Dashed lines for hidden features may not be shown in the sectional view.
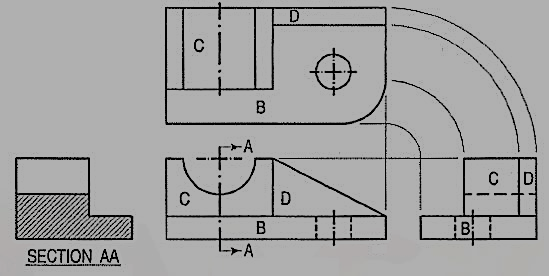
Figure 7(iii)
Fig. 7(iii) shows the four views of the casting drawn according to the third- angle projection method. There is no change in shape or size of the views. Only their positions are changed.
3. Two views of shaft support are given in fig. 8. Draw, scale full size,
(i) Sectional front view on A-A
(ii) Sectional top view on B-B
(iii) Side view from the left.
The object is composed of two cylinders and two ribs. Follow step 1, step 2 and step 3 of above problem.
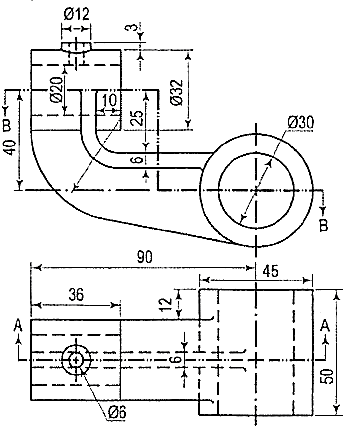
Figure 8(i)
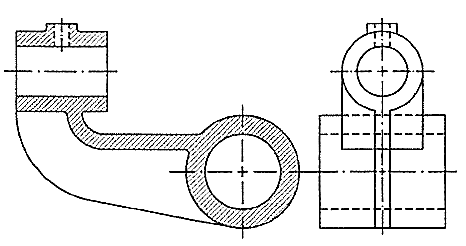
Figure 8(ii) Sectional front view- sectional top view
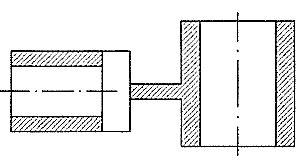
Figure 8(iii) Side view from the left
Conversion of pictorial views into Orthographic views
Conversion of a pictorial view into orthographic views requires sound knowledge of the principles of pictorial projection and some imagination. A pictorial view may have been drawn according to the principles of isometric or oblique projection. In either case, it shows the object as it appears to the eye from one direction only. It does not show the real shapes of its surfaces or the contour. Hidden parts and constructional details are also not clearly shown. All these must be imagined.
For converting a pictorial view of an object into orthographic views, the direction from which the object is to be viewed for its front view is generally indicated by means of an arrow. When this is not done, the arrow may be assumed to be parallel to a sloping axis. Other views are obtained by looking in directions parallel to each of the other two axes and placed in correct relationship with the front view.
When looking at the object in the direction of any one of the three axes, only two of the three overall dimensions (viz. Length, height and depth or thickness) will be visible. Dimensions which are parallel to the direction of vision will not be seen. Lines which are parallel to the direction of vision will be points, while surfaces which are parallel to it will be lines.
While studying a pictorial view, it should be remembered that, unless otherwise specified:
(i) A hidden part of a symmetrical object should be assumed to be like the corresponding visible part.
(ii) All holes, grooves etc. should be assumed to be drilled or cut right through.
(iii) Suitable radii should be assumed for small curves of fillets etc. An object in its pictorial view may sometimes be shown with a portion cut and removed, to clarify some internal constructional details. While preparing its orthographic views, such object should be assumed to be whole, and the views should then be drawn as required.
Orthographic projection
(i) It is comparatively easy to prepare a drawing from an actual object. The object is carefully examined and then placed in a suitable position for the front view. The front view of the object is selected in such a way that the maximum details of the object are visible so that the minimum dotted lines are required.
(ii) All the necessary views are then sketched freehand in a sketch book or on a pad.
(iii) Measurements of all its details and overall sizes are taken and inserted in the views, along with important notes and instructions.
(iv) Finally, a scale-drawing is prepared from these sketches.
A pictorial view of a rectangular plate is given in fig. 9(i). Its front view when seen in the direction of the arrow X, side view from the left, i.e. in the direction of the arrow Y and the top view in the direction of arrow Z, are shown in fig. 9(ii).
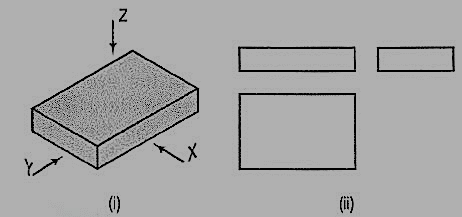
Figure 9
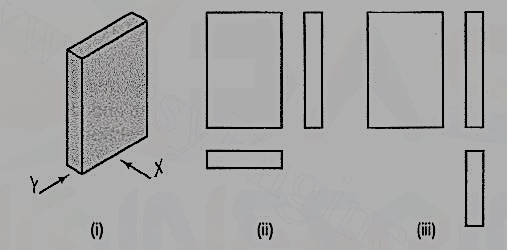
Figure 10
The same plate is shown in fig. 10 (i) with its longer edges vertical. Its front view looking in the direction of the arrow X, side view from the left and the top view are shown in fig. 10 (ii). These three views are similar in shape and size to the views shown in fig. 9 (ii). Only their positions and conditions have changed. Even when the front view is drawn looking in the direction of the arrow Y [fig. 10 (iii)], the three views remain similar in shape and size.
The same plate is shown cut in various shapes in fig. 11. The front view and the side view in each case will be the same as in fig. 9 (ii). The changed shapes will be seen in the top view of each plate. If these plates are kept in the position shown in fig. 10 (i), the front view in each case (looking in direction of the arrow X) will show a different shape, while the side view and the top view will be rectangles.
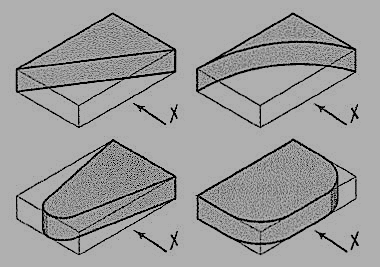
Figure 11
A plate cut in three different ways is shown in fig. 12. The front view in each case is the same, viz. a rectangle with a vertical line ab for the edge AB. The side view from the right in each case will be a rectangle with a vertical line cd for the edge CD. The top view in each case shows the shape of the cut.
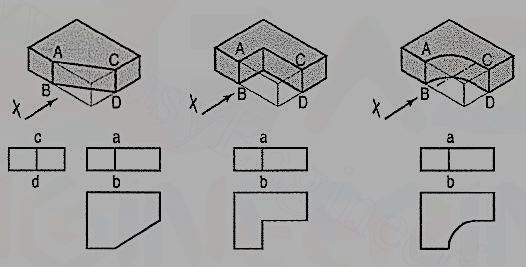
Figure 12
In the front view of the plate having different shapes of grooves (fig. 13), two vertical lines are drawn for the edges of rectangular as well as semi-circular grooves.
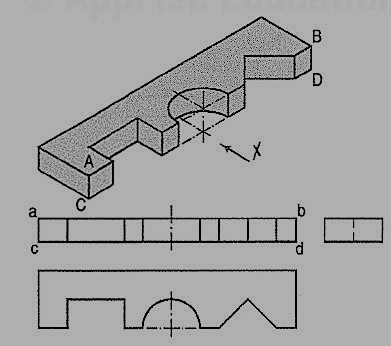
Figure 13
In case of the triangular groove, three vertical lines are required. Although edges AB and CD are cut, they are continuous lines ab and ed. In the top view, shapes of the grooves are seen. The grooves are not visible in the side view and hence, they are shown by a hidden line.
Two plates having grooves in upper and lower surfaces are shown in fig. 14. The shapes of the grooves are seen in the front views. In top views, two lines for the edges of rectangular as well as semi-circular grooves are drawn. For the triangular grooves, three lines are required. The tapered groove in the bottom surface is assumed to be cut throughout the width of the plate. It is not visible from above and hence; its four edges are shown by four hidden lines in the top view. In their side views, each groove should be shown by a horizontal hidden line. Therefore, the side view in this case is not necessary.
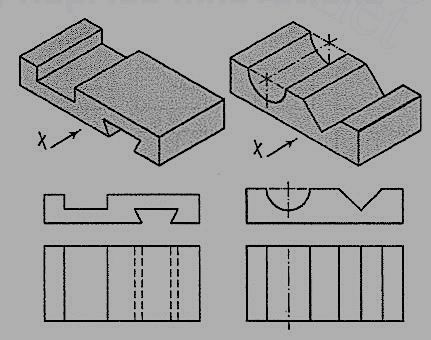
Figure 14
A plate having holes of different shapes is shown in fig. 15. These shapes are seen in the top view. Holes are assumed to be cut or drilled right through. They are shown by hidden lines in the front and the side views. Here also the right-side view is not necessary.
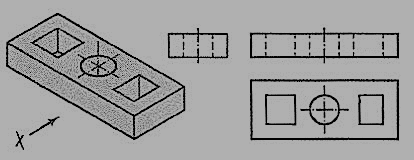
Figure 15
The semi-circular groove in the block shown in fig. 16 does not extend up to the opposite surface. Therefore, although the edge AB is broken, ab is a continuous line in the front view. The groove is shown by hidden lines in the side view. In the top view it is drawn as a rectangle.
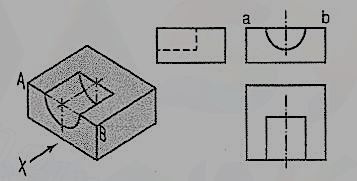
Figure 16
Fig. 17 shows a block in the shape of steps, along with its three views. In fig. 18, its face ABCD is inclined. Hence, in the top view, two lines ab and cd are drawn for that face.
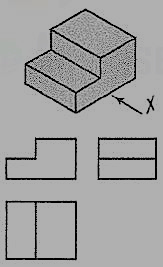
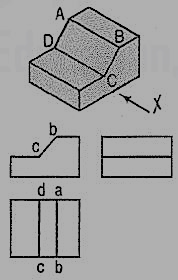
Figure 17 Figure 18
The front and back faces of the upper step are shown inclined in fig. 19. Their inclinations are shown in the side view. In the front view, the line pq for the edge PQ is drawn. In the top view, lines ef and gh for edges ff and CH are shown.
In fig. 20, all the four side-faces of the upper step are inclined. Their inclinations are seen in the front view and in the side view. In the top view, two rectangles are seen for the upper step. Lines (for the four sloping edges) joining the corners of the rectangles should also be shown.
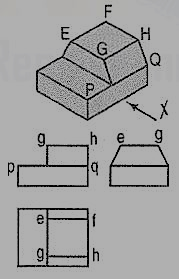
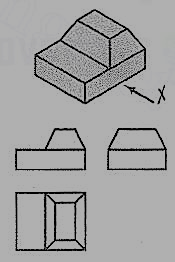
Figure 19 Figure 20
A casting having a hollow cylinder supported by a vertical rib is shown in fig. 21. The width of the rib is equal to the diameter of the cylinder. Hence, in the front view, vertical lines for the rib are tangential to the circle for the cylinder.
In the side view, the line showing the thickness of the rib vanishes just at the centre line. The rib is not visible when seen from top. Hence, it is shown by a hidden line in the top view. Note that the third view (top view) is a 'necessary' view to show the shape of rectangular slot.
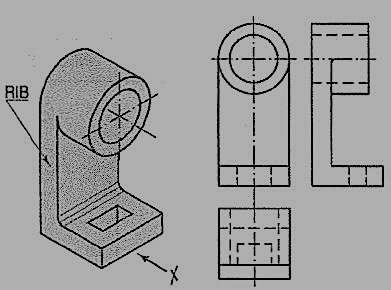
Figure 21
In the bearing block shown in fig. 22, the line for the rib is inclined and tangent to the semi-circle in the front view. Vanishing points for the lines for the rib in the side view and the top view are obtained by projecting the tangent-point from the front view.
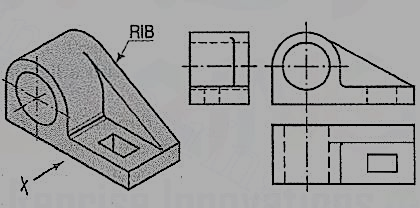
Figure 22
From the above discussion, the following important points are to be noted:
(i) An object can be observed from six sides such as
(a) front side
(b) back side
(c) left-hand side
(d) right-hand side
(e) top side and
(f) bottom side.
It is not necessary to draw all the possible six views to describe completely the shape of the object. In practice, only those views which are necessary to describe the shape of the object should be drawn.
The view should be selected in such a way that minimum dotted lines are necessary to show internal details. The object which has both the right-hand side and left-hand side symmetrical shape requires only two views.
One of the views must be such that it completely describes the shape of the object. Refer fig. 20-12.
(ii) Three views are necessary for the object which is not symmetrical. Refer fig. 18 and fig. 20.
(iii) The view should not be drawn out of place. That is the side view and top view are not aligned with the front view. This should be avoided.
(iv) Dotted lines must be drawn correctly as shown in table 1. Incorrect points are indicated by circle.
Table 1

(v) (a) When a visible line coincides with either a dotted line or a centre line, the visible line is shown and a centre line is extended beyond the outlines of the view.
(b) When a section-plane line coincides with a centre line, the centre line is shown and the section-plane line is drawn outside the out-lines of the object at the ends of centre line by thick dashes.
(c) When a dotted line coincides with the centre line, the dotted line should be shown.
Procedure for preparing a scale drawing:
A scale-drawing must always be prepared from freehand sketches initially prepared from a pictorial view or a real object. In the initial stages of a drawing, always use a soft pencil viz. HB, and work with a light hand, so that lines are thin, faint and easy to erase, if necessary.
1. Determine overall dimensions of the required views. Select a suitable scale so that the views are conveniently accommodated in the drawing sheet.
2. Draw rectangles for the views, keeping sufficient space between them and from the borders of the sheet.
3. Draw centre lines in all the views. When a cylindrical part or a hole is a rectangle, draw only one centre line for its axis. When it is a circle, draw two centre lines intersecting each other at right angles at its centre.
4. Draw details simultaneously in all the views in the following order:
(i) Circles and arcs of circles.
(ii) Straight lines for the general shape of the subject.
(iii) Straight lines, small curves etc. for minor details.
5. After the views have been completed in all the details, erase all unnecessary lines completely. Make the outlines so faint that only their impressions exist.
6. Fair the views with 2H or 3H pencil, making the outlines uniform and intensely black (but not too thick). For doing this, adopt the same working order as stated in step 4 above.
7. Dimension the views completely. Keep all centre lines.
8. Draw section lines in the view or views which are shown in section.
9. Fill up the title block and furnish all other necessary.
10. Check the drawing carefully and see that it is complete in all respects.
Illustrative problems:
Problem:
1. A pictorial view of bearing block is shown in fig. 23(i). Draw the front view, left-hand side view and top view according to the First-Angle projection method.
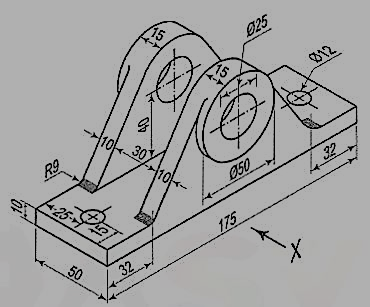
Figure 23
The procedure of preparing the orthographic views is illustrated in the following steps:
Step 1:
(i) Take a half imperial size drawing paper of 560 mm x 380 mm.
(ii) Draw the border lines taking A = 30 mm and B = 10 mm as shown in fig. 24.
Now clear space in the drawing paper is 520 mm x 360 mm.
(iii) The scale of drawing is decided from the size of object and number of views required to draw. Let L, W and H be the length, width and height of the object. The spacing between two views can be calculated as under:
Views | Horizontal distances | Vertical distances |
(a) For four views (front view, top view and two side views): |  |  |
(b) For three views (front view, top view and side view): |  |  |
If these distances E and F are less than 20 mm, adopt the suitable standard scale. In the above illustrated problem E and F are 95 mm and 75 mm respectively. Select suitable scale approximately and draw required blocks depending upon the number of views (three in this problem).
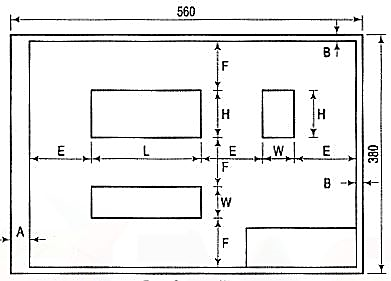
Figure 24
Step 2 (fig. 25):
(i) Mark centres for circles.
(ii) Draw centre lines passing through these centres and extend in other views also.
Step 3:
(i) Draw circle of required diameter in the front view as well as in the top view.
(ii) Draw the other lines in the front view and project them in the side view as well as in the top view.
(iii) Erase construction lines. Refer fig. 26.
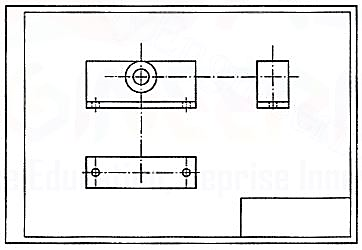
Figure 25
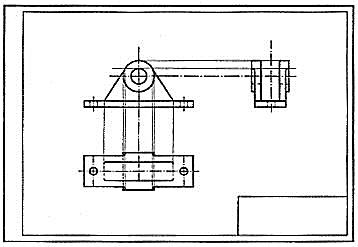
Figure 26
Step 4 (fig. 27):
(i) Clean the drawing paper. Fair first circles. Complete the views by fairing various lines. The lines should be clean, dense and uniform.
(ii) Draw extension lines.
(iii) Draw dimension lines. Insert dimensions. Observe that the height of numerals should not be more than 3 mm. It should be written freehand. Aligned method of writing dimensions is recommended. Follow IS:11669 (1986) for dimensioning.
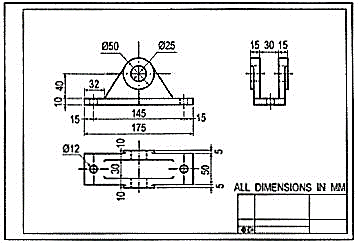
Figure 27
(iv) Complete title block by specifying unit of dimensions, symbol for method of projection and scale adopted.
(v) Fair boundary lines by 2H pencil.
2. Draw front view and a side view of the wedge-shaped piece shown in fig. 28.

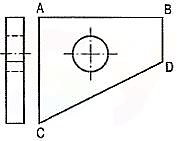
Figure 28 Figure 29 Side and front view
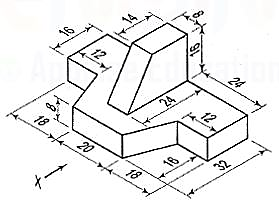
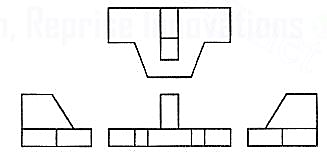
3. Draw the following views of the block shown pictorially in fig. 30. Use third-angle projection method. (i) Front view. (ii) Top view. (iii) Both side views.
Introduction
Manufacturing of a product is the main activity in engineering profession. The design of a product may start with trial designs in the form of sketches on paper. As the design improves and undergoes changes, the final form of design must be the scaled manufacturing drawings with finer details included. These drawings are two-dimensional representations of three dimensional objects designed.
During the process of design, the designer may have to carry out a large amount of computations so that an optimum design is obtained. A computer with good graphic capabilities helps the designer to,
(i) realize his ideas.
(ii) carry out complex computations.
(iii) present the results of computations in a useful form for decision making and possible improvement.
(iv) present the improved model for evaluation. Interactive Computer Graphics (ICG) is the tool of the designer.
Computer aided drafting
A part to be manufactured is defined first in terms of its geometry which also includes dimensions, tolerances, surface finish, and in some cases the type of fit between two mating parts. The two-dimensional representation of a part, called an engineering drawing or a blueprint, shows three orthogonal views of the part. Sometimes, when three views are not enough to define the part, additional sectional views, auxiliary views may have to be added for conveying the right information.
Any design is finally represented in the form of orthographic views and auxiliary views so that production can be carried out. Hence, the computer aided drafting is an important tool for Computer Aided Design. The Computer Aided Drafting (CAD) system is the computerization of technical, production, electronics and architectural drawings.
CAD is the product of computer era. Its development originated from early computer graphics systems. CAD can find its roots to the development of Interactive Computer Graphics (ICG). A system called Sketchpad was developed at Massachusetts Institute of Technology, U.S.A., in 1963 by Ivan Sutherland.
In the beginning, CAD systems were no more than graphics editors with some built-in design symbols. The geometry available to the user was limited to lines, circular arcs, and a combination of the two. The development of free-form curves and surfaces such as Coon's patch, Ferguson's patch, Bezier's curve, and 8-splines enabled a CAD system to be used for more sophisticated work. A 30 CAD system allows a user to do very sophisticated design and analysis work.
Computer aided drawing and drafting system uses the computer to assist in generation of blueprint data. CAD systems are essential in design and many computers based systems are commercially available. 20 drawing systems correspond directly to traditional engineering drawings, and they are developed to substitute manual drafting.
The advantages offered by computerized drafting systems can be summarized as:
(a) It increases the accuracy and productivity of designer.
(b) It allows design alterations to be made easily.
(c) It offers better drawing visualization through colours.
(d) It improves the quality of drawings produced.
(e) Drawings are easier to store and retrieve.
(f) Storage space required is less.
(g) Transfer of drawings is faster and cheaper.
(h) It permits the use of library of standard symbols for more productive CAD work.
Although the capital investment required in setting up a computer aided drafting system is high, the greater capabilities offered by computers and software are making the systems more affordable.
Computer (fig.1):
A computer system consists of
(a) Central Processing Unit (CPU), also known as processor
(b) Main memory
(c) Input devices
(d) Output devices
(e) Secondary storage devices.
The CPU controls and supervises the entire computer system. The actual arithmetic and logical operations are performed by CPU with the help of main memory. The main memory stores program instructions and processing data. Secondary storage devices provide slow but high capacity memory for storing program and large amount of data that is not currently being processed. Typical secondary storage devices are hard disk, floppy diskettes, magnetic tape, C.D. (compact disk), D.V.D., pen drive, etc.
During operation, data flows between the CPU, the main memory, and the various input/output devices. Moreover, the control information flows between these units to tell what to do with the data. Control information is used to manage the overall operation of the system.
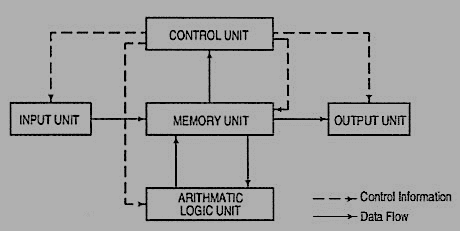
Figure 1Organisation of a computer
It must be remembered that the main memory is directly connected to the CPU. The main memory stores the program instructions and all the data being used for processing until the data are released as output under the instructions from the CPU. A control unit inside the CPU directs and coordinates all the operations of the system that are called for by the program. It involves control of the input and output devices, the storage and retrieval of information from memory, and the transfer of data between memory and ALU.
A CAD system consists of Hardware and Software. The system usually has the following major hardware elements:
Processor (CPU)
Every CAD system must have a CPU to process and store a very large amount of graphics data. The speed and processing power of a computer is mainly decided by the CPU speed and the amount of main memory (RAM) installed.
Display
The most common type of display device for CAD systems is a Cathode Ray Tube (CRT). The display device must be capable of displaying both graphical and alphanumeric data. Although the display looks like television monitors, they have special electronics for creating graphics images on the screen from computer processed data as per the instructions. But, they lack the television program receiving capability. Since both graphics and text are to be displayed simultaneously on the screen, the graphics monitor is usually divided into graphics area and a small text display area (see fig. 2).
The capabilities of display devices are evaluated in terms of resolution, colours and picture refresh rate. Picture refresh rate is important to get a steady and flicker free display. For a general-purpose graphics system, a display with 1024 (horizontal) by 768 (vertical) pixel resolution, 0.28 mm dot pitch and 256 shades of colours is the desirable configuration. The small dot pitch gives a high resolution and therefore good quality picture.
Input Devices
(1) [fig. 2(i)]: This is the most common input device. It is preferred for entering commands, text or value such as coordinates of a point or radius of a circle. The 101-key keyboards have special function keys to support special graphic functions. Whenever a key is pressed, the key character is identified by the computer and a character is displayed on the screen. If function keys are pressed or a combination of keys is pressed, the software takes the appropriate action.
(2) Mouse [fig. 2(iii)]: The mouse is a pointing device which is moved across a flat surface (usually on a mouse pad) by hand to indicate X-Y movement. The rotation of rubber ball underneath the device is translated and the corresponding cursor movement on the screen provides a visual feedback. The mouse is used as a pointing and pick-up device.
Either two-button or three-button mice are available in the market. The mouse has become very popular with microcomputers in recent years, and it is an indispensable pointing device. It is inexpensive, small, and convenient to use. However, fine and very precise sketching is very difficult to obtain with the mouse.
(3) Tablet or Digitizer [fig. 2 (ii)]: This is also a very common and popular input device for CAD. It has a flat surface on which a stylus is placed and moved. The movement of stylus on the surface in terms of X and Y coordinates of surface is detected by sensors embedded in the tablet. The stylus incorporates many buttons for input. The parameters of a digitizer are resolution, accuracy and repeatability.
The digitizers are available in very large sizes to be used with full size engineering drawings. They have a very high resolution. The resolution is measured in terms of lines per inch (LPI). Digitizers with 2000 LPI resolution are commercially available.
The most common method of using digitizer is for tracing a drawing or a portion of the drawing. The drawing to be copied is placed on the digitizer and the stylus is used to trace the portions required. Thus, old drawings, maps, etc., can be entered into a CAD system.
Graphic output devices:
A hard copy i.e. copy on paper of what is displayed on a graphics terminal can be obtained by a variety of graphics printers and plotters. The computer graphic output device may be thought of as paper and a pen or a pencil.
(1) Dot Matrix Printers (DMP) and laser Printers: Dot Matrix Printer is the most commonly used printer for text printing. The characters are formed by printing dots in a specific manner. The dot matrix printer [fig. 2(vi)] can also be used for printing of drawings, but the quality of output is poor.
(2) Pen Plotters [fig. 2(v)]: Pen plotters are the simplest output devices for CAD. A pen plotter consists of a device to hold the paper. Usually two orthogonal motorized carriages hold a pen and move it under computer control. There are three inputs to the pen plotter: (i) an X coordinate, (ii) a Y coordinate and (iii) a pen variable. The pen variable can specify the pen colour by pen number, the pen to be up (non-drawing position) or down (in contact with paper in drawing position).
The two varieties of plotters are flat-bed and drum plotters. The flat-bed plotter is limited by the paper size it can handle. The drum plotter utilizes a continuous roll of paper which rolls over the top of the drum. The capacity and capabilities of a plotter are evaluated by the size of paper it can handle, resolution, speed of plotting, number of pens it can handle, etc.
(3) Ink-Jet printers/plotters: These are dot matrix printers. The drawing which is made up of lines, arcs, characters and symbols is converted into dot form. Then the rows of dots are printed across the width of the paper by impelling a tiny jet of ink on the surface of paper. The jets are switched on and off at high frequency to create multicolor plots.
Typically, the resolution is 600 to 900 dots per inch, and each dot is arranged to overlap the adjacent ones. This provides a high-quality photo-realistic picture. These plotters are quiet during operation. These plotters are used for colour plots of drawings, shaded images, contour plots and artistic work.
(4) laser printers: A laser printer rapidly produces high quality text and graphics on plain paper. The fastest colour laser printers can print over 100 pages per minute. It can write with much greater speed than an ink jet and can draw more precisely, without spilling any excess ink. The toner powder of laser printer is cheap and lasts a long time compared to expensive ink cartridges.
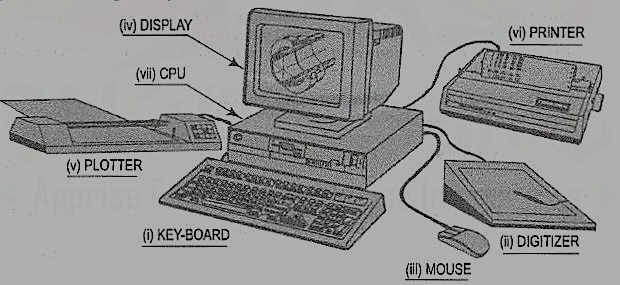
Figure 2 CAD system hardware
CAD software
The CAD system creates an environment to prepare drawings interactively. Most CAD systems available commercially are menu driven. Commands can either be typed directly with the help of a keyboard or can be picked-up from the screen menu or from toolbar with the help of a mouse or can be selected from the digitizer menu. Some screen menus offer pull-down menus (also referred to as pop-up menus) and dialogue boxes.
For example, a variety of hatching patterns are displayed on the screen for better visualization and selection if a hatching command is chosen. The appropriate hatching pattern can be selected with the help of input device. The effect of every command immediately displayed on the screen so that selection and corrections can be done interactively and immediately.
The major functions to be performed by a computer aided drafting system are:
(a) Basic set-up of a drawing
(b) Drawing the objects
(c) Changing the object properties
(d) Translating the objects
(e) Scaling the objects
(f) Clipping the objects to fit the image to the screen
(g) Creating symbol libraries for frequently used objects
(h) Text insertion
(i) Dimensioning
(j) Creates various layers (Transparent sheets)
(k) Allows zoom-in and zoom-out of any components drawing
(I) Creates different numbers of print/plot layouts.
AutoCad
AutoCAD (a product and registered trademark of Autodesk Inc., USA) is a low cost yet very effective computer aided design and drafting software. AutoCAD is accepted as the industry standard and it is preferred by a large community of CAD users in the world. Although AutoCAD is available for a variety of computer systems, majority of AutoCAD implementations are available on IBM or compatible personal computers with various operating systems. AutoCAD comes with a very large number of user-selectable options to support a great variety of commercially available display devices, digitizers, mouse, printers and plotters. AutoCAD supports 2D drafting and 3D modelling.
The basic drawing entities are lines, polylines [refer to art. 26-5-4 of any width, circles, arcs, ellipses and solids. There are many ways of defining a drawing entity, and the software always prompts the user for all options. Each drawing entity has an associated line-type, colour, layer [refer to art. 26-5-5(2)] and thickness. The thickness is a property associated with 3D entities.
Before any drawing is started, the AutoCAD environment must be prepared for proper units of measurement, line-type, drawing size, layer, etc. In AutoCAD the drawings are always prepared at full scale, and the drawing size can be changed at any instant of time by using LIMITS command.
Classic screen layout of AutoCad:
The default AutoCAD 2010 drawing screen can be divided into four areas such as drawing area, command area, menu bar area and tool bar area. The various component of Graphical User Interface (GUI) of AutoCAD 2010 is shown in fig. 26-3.
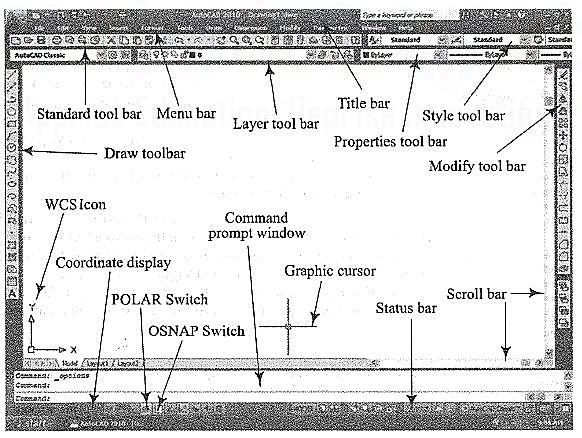
Figure 3 Classic AutoCad layout
Function Keys:
F1 Online Help
F2 Toggles between Drawing screen to text screen
F3 Toggles between OSNAP - On and Off
F4 Toggles between Tablet - On and Off
F5 Switches among lso planes Top, Right and Left
F6 Toggles between Coordinates - On and Off
F7 Toggles between Grid - On and Off
F8 Toggles between Ortho Mode - On and Off
F9 Toggles between Snap Mode - On and Off
F10 Toggles between Polar Tracking - On and Off
F11 Toggles between Objects Snap Tracking - On and Off
Drawing entities (Draw commands)

Figure 4
(1) Line: A line is specified by giving its two endpoints. The LINE command can be used to draw a single line or a series of lines with the end-point of one being the start point of the next. When a series of such lines is created, each line is treated as a separate entity. To create a closed polygon, the user has to type in C (close option) for the To point: prompt. This causes the last and the first points to be joined by a line and thus creating a closed boundary.
(2) Pline: Polylines are interesting drawing entities. Polylines can include both lines and arcs connected at end-points. Thus, a polyline is a single entity with multiple segments. The polylines can be straight or curved, can be wide (like a TRACE) or tapered. Fillets and chamfers can be added where needed on a polyline. Curve fitting and hatching can easily be performed on a polyline.
(3) Polygon (fig. 5): A polygon also a polyline with equal length of sides. The regular polygon can either be inscribed in a circle or circumscribed about the circle. The polygon may also be constructed by specifying the length of one side and the number of sides of polygon (called edges). In this method a polygon is constructed in anti-clockwise direction from the two-edge end-points that have been specified.
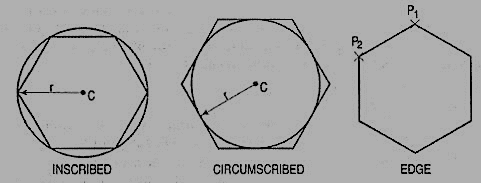
Figure 5 Polygon
(5) Arc (fig. 6): This command is used to draw an arc accurately. Usually there are three parameters required for drawing an arc.
Different ways of drawing circular arcs are:
(i) 3-point arc: The arc is drawn by specifying three points on the chord of arc. The first and third points define the start and end-points of an arc respectively.
(ii) Start, Center: This option needs start points and center point of an arc. The third parameter may either be an end-point, included angle, or length of chord.
(iii) Start, End: This option asks the user to enter the start and end-points of an arc. The arc is completed by either specifying radius or included angle or center point.
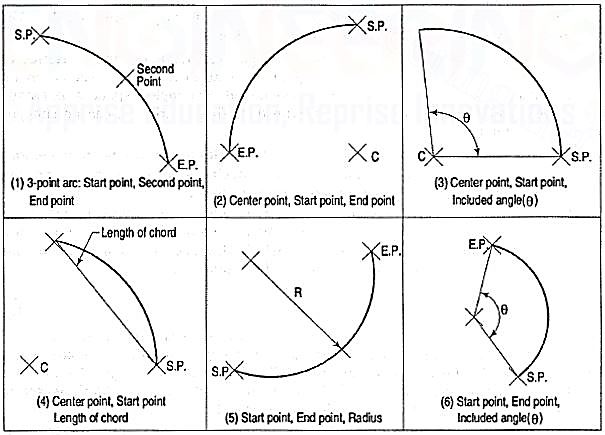
Figure 6 Arcs
Drafting Aids:
(1) limits: In AutoCAD, drawings are drawn in full scale therefore limits are needed to size up a drawing area. The limits are set by specifying X and Y co-ordinates of Lower Left Corner (L.L.C.) and Upper Right Corner (U.R.C.) of drawing area. By default, L.L.C. Is set to (0, 0) and U.R.C. Is set to (12, 9) for imperial file and (420, 210) for metric file.
Note: By changing limits, the drawing display area does not change. It is required to use all option of the zoom command to display the limits inside the drawing area.
(2) layer: A layer can be thought of as a transparent sheet on which drawings can be prepared. Drawings can be logically divided into different layers, and layers can be selectively displayed either individually or in any combination. Each layer is identified by a name. If the drawing becomes too dense or complicated, some layers can be turned off so that they do not interfere with the work. The drawing can be edited on any one layer at a time, called current layer. The colour, line type and line weight are the properties associated with a layer. This controls an entity's colour, line type and line weight drawn on that layer.
(3) Dimensioning: The manufacturing drawing must be dimensioned for size and tolerances so that the right information can be conveyed. The appearance and size of dimension arrows, size and style of dimension text with or without tolerances, and the layer on which dimensions are placed can be controlled by setting dimension variables.
(4) Object snap (fig.7): A very useful drawing aid, the OSNAP identifies the points on drawing entities that are visible on the screen. For example, the start point of an arc can be the endpoint of an existing line. This option allows the user to pick-up the points very accurately with respect to drawing displayed. Some of the OSNAP modes are:
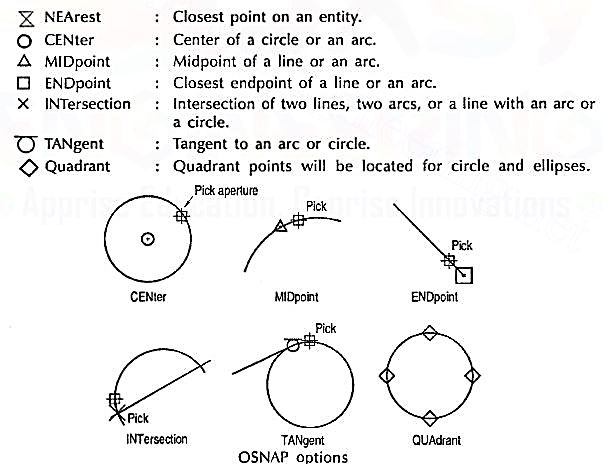
Figure 7
(5) Zoom: This is the most common method of magnifying a portion of current drawing on the screen. The portion of drawing to be zoomed is usually selected by a window. A window is identified by picking up the diagonal corners of a rectangle around the area of interest.
Editing of a drawing:

Figure 8
The fundamental commands to edit a drawing are:
(1) Move [fig. 9 (i)]: Moves selected objects to another location about a base point.
(2) Rotate [fig. 9 (ii)]: Rotates selected objects through a specified angle about a base point.
(3) Copy [fig. 9 (iii)]: Creates one or more copies of selected objects at another location. The function of COPY command is like the MOVE command except that it preserves a copy of the objects selected at the original location.
(4) Mirror [fig. 9 (iv)]: Creates a mirror image of the selected objects about a specified line.
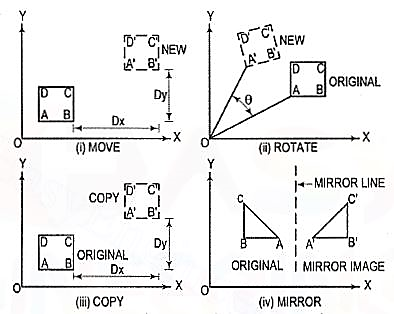
Figure 9
(5) Array: This command creates multiple copies of selected objects in rectangular or polar form. This is a form of COPY command.
(6) Erase: This command deletes the selected entities. A record of entities erased is always maintained. The most recent entity can be unerased by OOPS command.
(7) Oops: This command retrieves all objects erased by the last Erase and after executing Block or Wblock command.
(8) Break: This command erases a portion of line, arc, circle or a 20 polyline between two selected points.
(9) fillet (Refermodule26-5, 26-13): This command is used to create around corner between two lines. The lines are shortened or extended to fit a tangent arc of specified radius. FILLET works on any combination of two lines, arcs, circles, non-parallel lines, or a single polyline.
(10) Chamfer (Refer module 26-8): This command works on two lines or a single polyline to create a bevelled edge.
(11) Extend: This command extends the lines, polylines and arcs to a boundary edge which can be a line, polyline, arc or circle. A closed polygon cannot be extended. When you invoke this command, you will be prompted to select the boundary edges. These edges can be lines, polylines, circles, arcs, ellipse, rays, splines etc. After the boundary edges are selected, you must select each object to be extended. An object can be both a boundary edge and an object to be extended.
(12) Offset: This command creates a parallel single copy of line, arc, circle, rectangle, polygon, or 20 polylines at a given offset distance. Each offset creates a new entity with the same linetype, color and layer settings.
(13) Stretch: The STRETCH command can either lengthen entities or shorten them, and thus alter their shapes. The centre points of arcs or polyline arcs are adjusted accordingly.
(14) Trim: This command trims the objects that extend beyond a required point of intersection. When you invoke this command, you will be prompted to select the cutting edges. These edges can be lines, polylines, circles, arcs, ellipse, rays, splines, text, blocks or even viewports. After the cutting edges are selected, you must select each object to be trimmed. An object can be both a cutting edge and an object to be trimmed.
(15) Scale: The SCALE command allows to shrink or enlarge the already existing drawing objects about a base point by specifying a scale factor.
(16) Pedit: A polyline is a single entity which is made up of a continuous series of line and arc segments. The PEDIT command is exclusively used for editing of polyline properties. The selected line, arc and polyline can be added to an existing polyline by a JOIN option. A smooth curve passing through all vertices of a polyline can be created by using FIT option. Similarly, a spline can also be constructed by using SPLINE option.
(17) Explode: This command breaks a polyline into its individual segments. These segments can then individually be edited, and rejoined again to form an edited polyline.
The advanced features of AutoCAD are:
(1) Built-in programming language AutoLISP provides programming environment so that AutoCAD commands can be called along with programs written for computations. This is very useful for parametric design and drawing.
(2) Drawing Exchange Files (DXF) and script files can be used to interface AutoCAD with programs written in any other higher-level language such as C. DXF and IGES file formats allow the exchange of drawing files among various drafting software’s.
(3) AutoCAD provides techniques to define and extract attributes of entities. This feature is used in extracting information from a drawing for processing by other programs or to transfer it to a database.
Symbol library (Block, Wblock and Insert)
A complete drawing or a part of a drawing can be given a specific name and then stored as a block. A collection of such blocks form a library which is very useful for drawing purpose. The blocks, also referred to as symbols, can be scaled, rotated or mirrored if necessary and inserted into the drawing at the appropriate location e.g. Bolt heads to be used at different locations in a drawing. Many suppliers of CAD add-on products offer symbol libraries of standard mechanical components, electronic components, architectural symbols, piping symbols, etc. The block and wblock command groups many selected entities together and treats them as a single object i.e. single block. Block commands saves the group of selected entities with block name and is inserted in the file in which it is created, but wblock command saves the group of selected entities as a drawing file and can be inserted in any drawing file. The blocks and wblocks can be scaled, rotated, stretched or mirrored. The explode command separates the entities of block and wblock.
INSERT: INSERT command is used to insert blocks and wblocks in current drawing. Blocks will be inserted only in the drawing file in which they created and w blocks will be inserted in any drawing files.
- At the Command prompt, enter sketch.
- Press Enter again to accept the last saved type, increment, and tolerance values.
- Move cursor in the drawing area to begin sketching.
As you move the pointing device, freehand line segments of the specified length are drawn. During the command, freehand lines are displayed in a different color.
4. Click to suspend sketching.
You can click a new start point to resume drawing from the new cursor location.
5. Press Enter to complete the sketch.
An alternate method:
- At the Command prompt, enter sketch.
- Click and hold to begin sketching and move your cursor. Release to suspend sketching.
- Repeat the previous step as needed.
- Press Enter to complete the sketch.
References:
1. Engineering Drawing N.D. Bhatt / Charotar
2. Engineering Drawing / N. S. Parthasarathy and Vela Murali/ Oxford
3. Engineering Drawing / Basant Agrawal and McAgrawal/ McGraw Hill
4. Engineering Drawing/ M. B. Shah, B.C. Rane / Pearson.
5. Computer Aided Engineering Drawing – K Balaveera Reddy et al – CBS Publishers