Unit - 4
Stability Criterion Continued
The calculation of system parameters for higher order systems is difficult in time domain analysis. This can be overcome by frequency domain analysis. As the frequency response of a linear time invariant system is independent of amplitude and phase of the input test signal. The effect of noise and parameter variation in frequency domain can be easily computed.
In frequency response can be determine by calculating the phase and amplitude oof the given system transfer function. If a sinusoidal signal XG(j )sin
)sin t then its amplitude will be
C(t) = XG(j )sin
)sin t
t
= X|G(j )|
)| sin
sin t
t
Magnitude = |G(j )|
)|
Phase = 
In polar form = |G(j )|
)|
Resonant Peak (Mr): The maximum value of magnitude is known as Resonant peak. The relative stability of the system can be determined by Mr. The larger the value of Mr the undesirable is the transient response.
Resonant Frequency (Wr): The frequency at which magnitude has maximum value.
Bandwidth: The band of frequencies lying between -3db points.
Cut-off frequency –The frequency at which the magnitude is 3db below its zero frequency.
Cut-off Rate – It is the slope of the log magnitude curve near the cut off frequency.
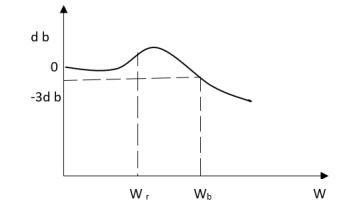
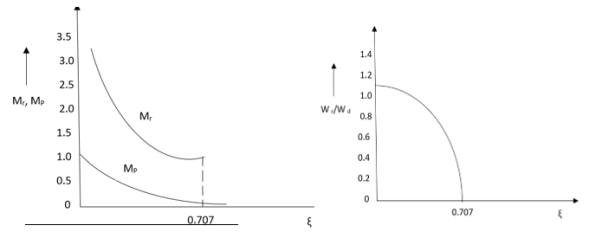
Fig 1 Frequency Domain Specification
It depicts the frequency response characteristics over the entire frequency range in a single plot. There is single graph to represent both phase and magnitude, unlike in Bode plot.
Polar plot is a plot which can be drawn between magnitude and phase. Here, the magnitudes are represented by normal values only.
The polar form of 

The Polar plot is a plot, which can be drawn between the magnitude and the phase angle of G(jω) H(jω) by varying ω from 0 to ∞.
Rules for Drawing Polar Plots
Follow these rules for plotting the polar plots.
- Substitute, s=jω in the open loop transfer function
- Write the expressions for magnitude and the phase of G(jω) H(jω)
- Find the starting magnitude and the phase of G(jω) H(jω) by substituting ω=0. So, the polar plot starts with this magnitude and the phase angle.
- Find the ending magnitude and the phase of G(jω) H(jω) by substituting ω=∞. So, the polar plot ends with this magnitude and the phase angle.
- Check whether the polar plot intersects the real axis, by making the imaginary term of G(jω) H(jω) equal to zero and find the value(s) of ω
- Check whether the polar plot intersects the imaginary axis, by making real term of G(jω) H(jω) equal to zero and find the value(s) of ω
- For drawing polar plot more clearly, find the magnitude and phase of G(jω) H(jω) by considering the other value(s) of ω.
Polar plot of some standard functions:
# TYPE ‘O’
Ex: 1T(S) = 1/S + 1
(1). For polar plot substitute S=jw.
TF = 1/1 + jw
(2). Magnitude M = 1 + 0j / 1 + jw = 1/√1 + w2
(3). Phase φ = tan-1(0)/ tan-1w = - tan-1w
W M φ
0 1 00
1 0.707 -450
∞ 0 -900
The plot is shown in fig. 2
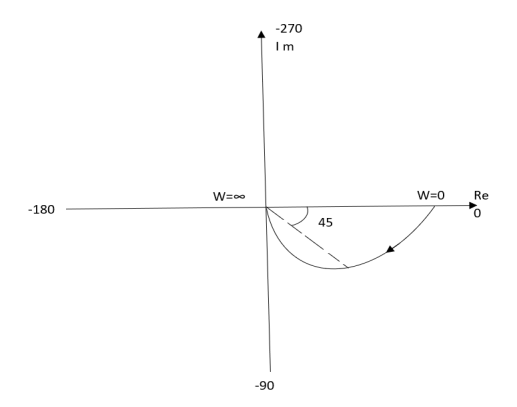
Fig 2(a) Polar Plot T(S) = 1/S + 1
Ex.2>. T(S) = 1/(S+1)(S+2)
(1). S = jw
TF = 1/(1+jw)(2+jw)
(2). M = 1/(1+jw)(2+jw) = 1/-w2 + 3jw + 2
M = 1/√1 + w2√4 + w2
(3). Φ = - tan-1 w - tan-1(w/2)
W M Φ
0 0.5 00
1 0.316 -71.560
2 0.158 -108.430
∞ 0 -1800
The plot is shown in fig 3
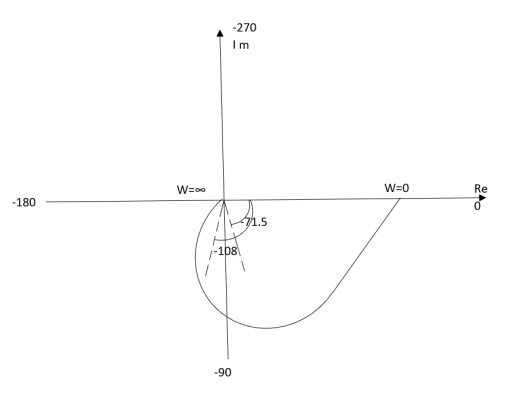
Fig 3. Polar Plot T(S) = 1/(S+1)(S+2)
Intersection of polar plot with imaginary axis will be when real part of Transfer function = 0
M = 1/(jw + 1)(jw + 2)
= 1/-w2 + j3w + 2
TYPE ‘1’
Ex.1 T(S) = 1/S
(1). S = jw
(2). M = 1/W
(3). Φ = -tan-1(W/O) = -900
W M φ
0 ∞ -900
1 1 -900
2 0.5 -900
∞ 0 -900
The plot is shown in fig. 4
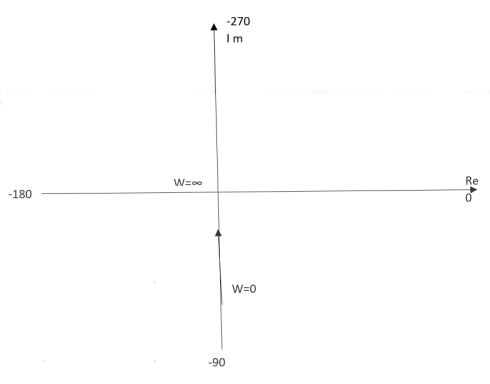
Fig 4 Polar Plot T(S) = 1/S
Ex.2 T(S) = 1/S2
(1). S = jw
(2). M = 1/w2
(3). Φ = -tan-1(W/O)-tan-1(W/O) = -1800
W M Φ
0 ∞ -1800
1 1 -1800
2 0.25 -1800
∞ 0 -1800
The plot is shown in fig. 5
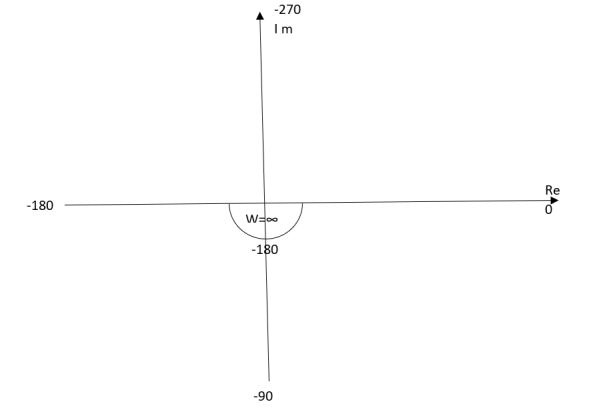
Fig 5 Polar Plot T(S) = 1/S2
Key takeaway
- For Polar Plot starting point depends upon type of system
- The terminating phase depends on order of the system.
TYPE 1 ORDER 2
Ex.1 T(S) = 1/S(S+1)
(1). M = 1/W√1+w2
(2). Φ = -900 - tan -1(W/T)
W M φ
0 ∞ -900
1 0.707 -1350
2 0.45 -153.40
∞ 0 -1800
The plot is shown in fig. 6
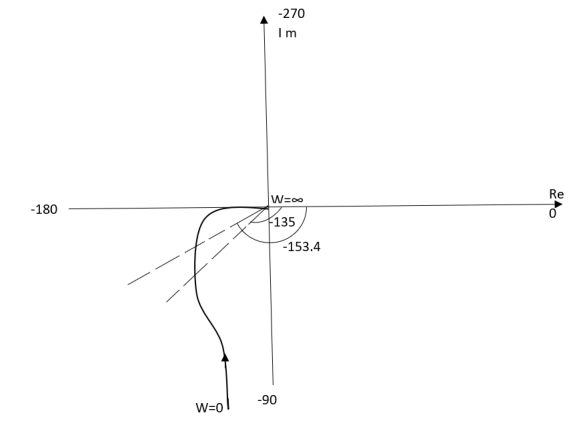
Fig 6. Polar Plot T(S) = 1/S(S+1)
Ex.2TYPE 2 ORDER 3
T(s) = 1/S2(S+1)
(1). M = 1/w2√1+jw
(2). Φ = -1800 – tan-1W/T
The plot is shown in fig. 7
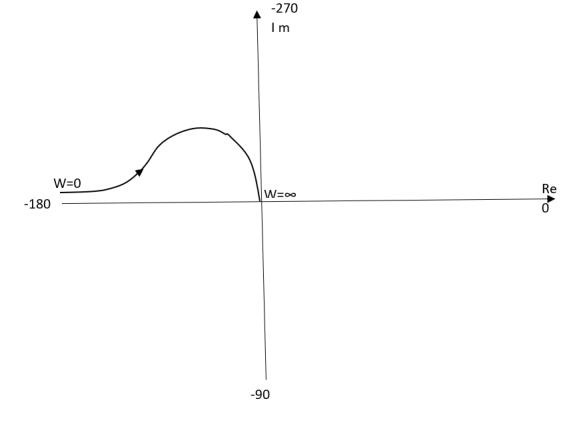
Fig 7. Polar Plot T(s) = 1/S2(S+1)
Stability criterion
We can check stability using polar plot in very simple manner. Imagine yourself walking on the polar plot, along the direction of the arrow i.e from 0 to ∞. The entire area to the right of you up to the real axis represented by an infinite radius is said to be enclosed by the polar plot.
The portion inside the shaded area is said to be enclosed by the polar plot. A system is stable if the (-1,0) point is not enclosed by the polar plot.
Polar plots are simple method to check the stability of the system. They are however not the preferred choice when the system has poles on the right half plane.
For finding stability we should have an accurate |G(jω)|= 1 and ∠G(jω) = −180 to obtain more accurate results for gain margin and phase margin
Nyquist plots are the continuation of polar plots for finding the stability of the closed loop control systems by varying ω from −∞ to ∞. That means, Nyquist plots are used to draw the complete frequency response of the open loop transfer function.
The Nyquist stability criterion works on the principle of argument. It states that if there are P poles and Z zeros are enclosed by the ‘s’ plane closed path, then the corresponding G(s)H(s) plane must encircle the origin P−Z times. So, we can write the number of encirclements N as,
N=P-Z
Nyquist Contour: is the contour in the s-plane that includes the entire right half plane. Now, let’s consider  and the contour in the s-plane is the Nyquist contour (i.e., the entire right half plane).
Applying the Cauchy’s Principle of Argument, we should have
The number of rotations about the origin of the mapping through 
N = The number of zeros of 1+ G(s) (H) in the right half plane, Z - The number of poles of 1+ G(s) (H) in the right half plane, P
Please note
The mapping through G(s) (H) is virtually the same as the one through 1+ G(s) (H)
except that the contour is shifted one unit to the left. Thus, we can count rotations
about -1 instead of rotations about the origin in the above statement.
The zeros of 1+ G(s) (H) = the closed-loop poles.
The poles of 1+ G(s) (H) = the open-loop poles or the poles of 1+ G(s) (H)
Therefore
The number of rotations about -1 of the mapping through 1+ G(s) (H),
N = The number of closed-loop poles in the right half plane, Z - The number of open-loop poles in the right half plane, P
The above relationship is called the Nyquist Criterion; and the mapping through G(S)H(S) is called the Nyquist Diagram of G(S)H(S)
For a system to be stable, Z must be zero.
Sketching the Nyquist Diagram
Suppose the open-loop transfer function 
Sketch its Nyquist diagram
| | GH | |  |
 | 1 | 0 |
 | o |  |
Cross re:   | See above | See above |
Cross re:   | See above | See above |
 | 0.707 | -45  |
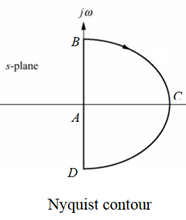
Sketching the Nyquist diagram includes two steps:
(1) Sketch the mapping of Point A to Point B, which is the same as the polar plot of frequency response for G(S)H(S).
Note that the semicircle with an infinite radius, i.e., B-C-D, is mapped to the origin if the order the denominator of G(S)H(S) is greater than the order the numerator of G(S)H(S).
(2) Sketch the mapping of Point A to Point D, which is the mirror image about the real axis of the mapping of Point A to Point B.
Examples
Nyquist Stability Criteria:
The Nyquist criteria is a semi graphical method that determines stability of CL system investigating the properties of the frequency domain plot (Polar plot), the Nyquist plot of the OLTF G(S) H(S) is represented as L(S)
L(S) = G(S)H(S)
Specially the Nyquist plot of L(S) is a plot drawn by substituting S=jw and varying the value of w as per in polar plot. In polar plot we take one sided frequency response ( 0 - ∞) in Nyquist plot we will vary the frequency in entire range possible from ( -∞ to 0 ) and (0 to ∞ )
Nyquist Criteria also gives:
(1). In addition to providing the absolute stability like other plots, the Nyquist criteria also gives information on the relative stability of a stable system and the degree of instability of an unstable system.
(2). It also gives indications on how the system stability can be improved.
(3). The Nyquist plot of G(S) H(S) is the polar plot of G(S) H(S) drawn with wider range of frequency ( -∞ to ∞ ) and along the Nyquist path.
(4). The Nyquist plot of G(S) H(S) gives information on frequency domain characteristics such as B.W, gain margin and phase margin.
Construction of Nyquist Plot
Encircled: A point or region in a complex function phase i.e. S-plane is said to be encircled by a closed path if it is found inside the path.
Assumption:

Fig 8. Encirclement
In this example point A is encircled by the closed path Y. Since, A is inside the closed path point B is not encircled by y. It is outside the path. Furthermore when the closed path Y, has a direction assign to it, encirclement, if made can be in the clockwise direction or in the anti-clockwise direction.
Point A is encircled by Y by anticlockwise direction. We can say that the region inside the path is encircled in the prescribed direction and the region outside the path is not encircled.
Enclosed:
A point or region is said to be enclosed by a closed path if it is encircled in the counter clockwise direction, or the point or region lies to the left of the path (always), when the path is traveling in the prescribed direction.
The concept of enclosure is particularly useful, if only a portion of a closed path is shown.
In this example the shaded region are

Fig 9. Enclosure
Considered to be enclosed by the closed path Y. In other words, point A is enclosed by Y in fig a. But is not enclosed by Y in fig b. And for point B it is viceversa.
No of encirclements and enclosure:
For A line is cut once
For B line is cut twice
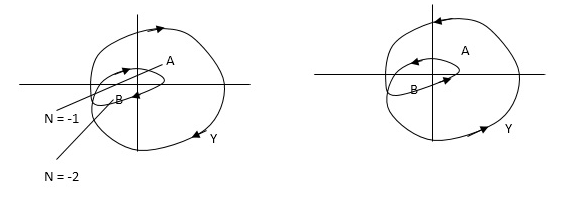
Fig 10. Encirclement and Enclosure with example
As it’s overlapping but 2 times in Same direction
When a point is encircled by a closed path Y, a no. N can be assigned to the no. Of times it is encircled. The magnitude of N can be determined by drawing an arrow around the closed path Y.
Taking an arbitrary point S, and moving around in clockwise direction and anti-clockwise direction respectively. We are getting a direction.
The path followed by S1 gives us the direction and this path which covers the total number of revolution travelled by this point S1 is N or the net angle is ‘ 2 π N ’.
For B = 2 = N for A = 1 = N
In this eg. Point A is encircled ones (or 2 π radians) by function Y and point B is encircled twice (or 4 π radians)all in clockwise direction.
In diagram b again A and B are encircled but in counter clockwise direction thus for this diagram A is enclosed one’s and B is enclosed twice.
By definition M is +ve for anticlockwise(direction) encirclement and –ve for clockwise encirclement.
OLTF G(S) = (S + Z1)(S + Z2)/(S + P1)(S + P2) H(S) = 1 - - (1)

Fig 11. Unity feedback control system
CLTF G(S)/1 + G(S)
CE = 1 + G(S)
= 1 + (S + Z1)(S + Z2)/(S + P1)(S + P2)
CE = (S + P1)(S + P2) + (S + Z1)(S + Z2)/ (S + P1)(S + P2) - - (2)
Key takeaway:
# OLTF poles is equal to CE poles.
CE = (S + Z’1)( S + Z’2)/( S + P1)( S + P2) - - (3)
CLTF = G(S) –(1) / 1 + G(S) –(3)
= (S + Z1)( S + Z2) / (S + Z’1)( S + Z’2) - - (4)
# Zeros of characteristic equation is poles of CLTF (3 and 4).
For the closed loop system to be stable zeros of CE(i.e. poles of CLTF) should not be located at right half of the S-plane.
Consider a contour, which covers the entire right half of S-plane.
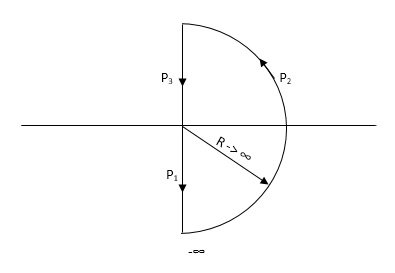
Fig 12. Contour For Right half of S-plane
P1 W(0 - ∞)
P2 RejR ∞
ϴ - π/2 to 0 to + π/2
P3 W(∞ to 0 )
If each and every point along the boundary of contour is mapped in q(S) where q(S) is 1+G(S)H(S)[CE]. The CE is drawn in S-domain. Now, as the CE : q(s) = 1 + G(S)H(S) contour is drawn into S-plane.
This q(S) contour may encircle the origin. Thus, the number of encirclement of q(S) contour with respect to origin is given by
N = Z – P
Where : Z1P zeros and poles of q(S)[CE]
N Total no of encirclement of origin
Z1P Zeros and poles of CE in the right half of S-plane
** for the CL system to be stable Z=0 always.
Important:
# Open loop System(stable): When OL system is stable P=0 i.e. no of poles on right half
N = Z – P
If P = 0
N = Z
- Now for CL system to be stable Z = 0
- N = 0
- i.e. q(s) contour should not encircle the origin.
# Open loop system(unstable): Let P = 1 i.e. one OL pole is located in right half of S-plane i.e. OLTF is unstable.
As N = Z – P
N = Z – 1
For CL system to be stable the only criteria is (Z=0) i.e.
N = -1
Which means q(S) contour should encircle the origin one’s in CW direction.
Key takeaway:
(1). When OL system is unstable then corresponding CL will be stable only when q(S) contour will encircle origin in CW direction.
(2). The no of encirclements should be equal to no of open loop poles located in right half of S-plane.
** the no of encirclements(N) can also be calculated by using G(S) contour (instead of q(S) contour) but the reference is -1+j0 instead of 0+j0 i.e. the no of encirclements should be considered w.r.t -1+j0 and not with the origin.
Explanation Mapping
q(S) = 1 + G(S)
G(S) is always given to us, so we can relate G(S) with q(S).
G(S) = q(S) – 1
But q(S) can be drawn by adding 1 real part to the q(S).
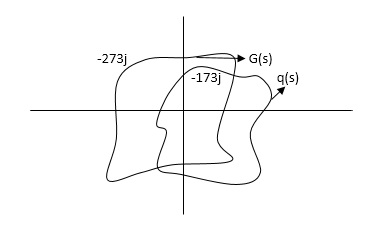
Fig 13. Mapping
G(S) given then q(S) shift to right side.
Q1. For the transfer function below plot the Nyquist plot and also comment on stability?
G(S) = 1/S+1
Sol: N = Z – P ( No pole of right half of S plane P = 0 )
P = 0, N = Z
NYQUIST PATH:
P1 = W – (0 to - ∞)
P2 = ϴ( - π/2 to 0 to π/2 )
P3 = W(+∞ to 0)
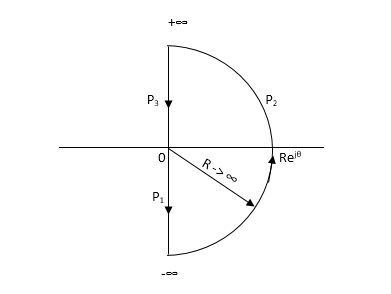
Fig 14. Nyquist path
Substituting S = jw
G(jw) = 1/jw + 1
M = 1/√1+W2
Φ = -tan-1(W/I)
For P1 :- W(0 to -∞)
W M φ
0 1 0
-1 1/√2 +450
-∞ 0 +900
Path P2:
W = Rejϴ R ∞ϴ -π/2 to 0 to π/2
G(jw) = 1/1+jw
= 1/1+j(Rejϴ) (neglecting 1 as R ∞)
M = 1/Rejϴ = 1/R e-jϴ
M = 0 e-jϴ = 0
Path P3:
W = -∞ to 0
M = 1/√1+W2, φ = -tan-1(W/I)
W M φ
∞ 0 -900
1 1/√2 -450
0 1 00
The Nyquist Plot is shown in fig 15
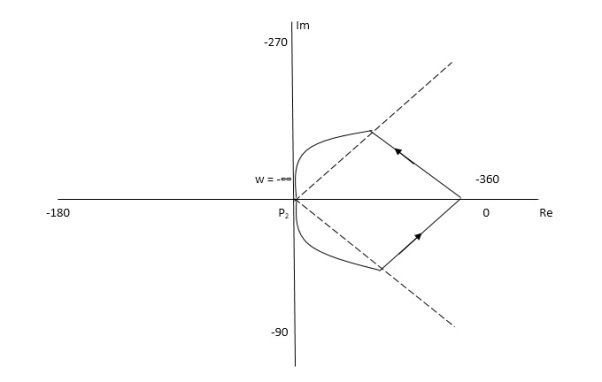
Fig 15. Nyquist Plot G(S) = 1/S+1
From plot we can see that -1 is not encircled so, N = 0
But N = Z, Z = 0
So, system is stable.
Q.2. For the transfer function below plot the Nyquist Plot and comment on stability G(S) = 1/(S + 4)(S + 5)
Soln: N = Z – P, P = 0, No pole on right half of S-plane
N = Z
NYQUIST PATH
P1 = W(0 to -∞)
P2 = ϴ(-π/2 to 0 to +π/2)
P3 = W(∞ to 0)
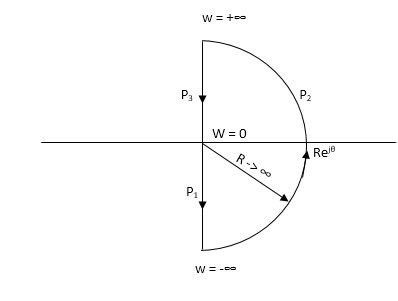
Fig 16. Nyquist Path
Path P1 W(0 to -∞)
M = 1/√42 + w2 √52 + w2
Φ = -tan-1(W/4) – tan-1(W/5)
W M Φ
0 1/20 00
-1 0.047 25.350
-∞ 0 +1800
Path P3 will be the mirror image across the real axis.
Path P2: ϴ(-π/2 to 0 to +π/2)
S = Rejϴ
G(S) = 1/(Rejϴ + 4)( Rejϴ + 5)
R∞
= 1/ R2e2jϴ = 0.e-j2ϴ = 0
The plot is shown in fig 17. From plot N=0, Z=0, system stable.
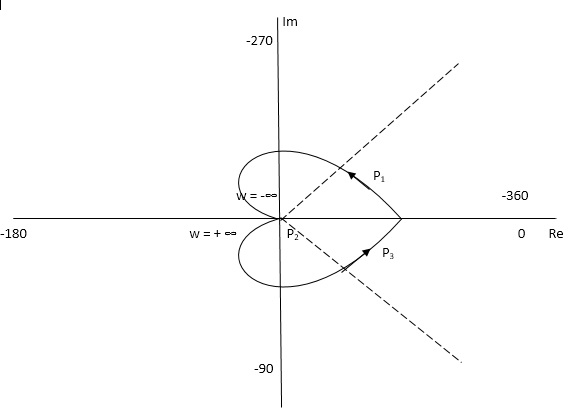
Fig 17. Nyquist Plot G(S) = 1/(S + 4)(S + 5)
Q.3. For the given transfer function, plot the Nyquist plot and comment on stability G(S) = k/S2(S + 10)?
Soln: As the poles exists at origin. So, first time we do not include poles in Nyquist plot. Then check the stability for second case we include the poles at origin in Nyquist path. Then again check the stability.
PART – 1: Not including poles at origin in the Nyquist Path.
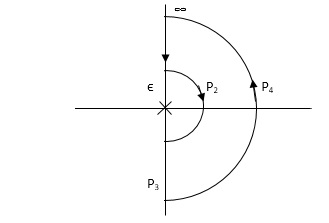
Fig 18. Nyquist Path
P1 W(∞ Ɛ) where Ɛ 0
P2 S = Ɛejϴ ϴ(+π/2 to 0 to -π/2)
P3 W = -Ɛ to -∞
P4 S = Rejϴ, R ∞, ϴ = -π/2 to 0 to +π/2
For P1
M = 1/w.w√102 + w2 = 1/w2√102 + w2
Φ = -1800 – tan-1(w/10)
W M Φ
∞ 0 -3 π/2
Ɛ ∞ -1800
Path P3 will be mirror image of P1 about Real axis.
G(Ɛ ejϴ) = 1/( Ɛ ejϴ)2(Ɛ ejϴ + 10)
Ɛ 0, ϴ = π/2 to 0 to -π/2
= 1/ Ɛ2 e2jϴ(Ɛ ejϴ + 10)
= ∞. e-j2ϴ [ -2ϴ = -π to 0 to +π ]
Path P2 will be formed by rotating through -π to 0 to +π
Path P4 S = Rejϴ R ∞ ϴ = -π/2 to 0 to +π/2
G(Rejϴ) = 1/ (Rejϴ)2(10 + Rejϴ)
= 0
N = Z – P
No poles on right half of S plane so, P = 0
N = Z – 0
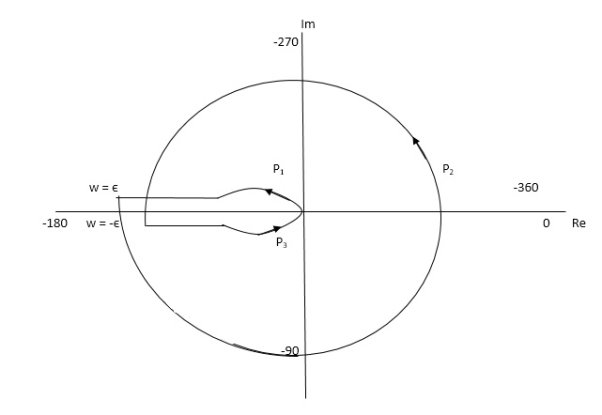
Fig 19. Nyquist Plot for G(S) = k/S2(S + 10)
But from plot shown in fig 19. It is clear that number of encirclements in Anticlockwise direction. So,
N = 2
N = Z – P
2 = Z – 0
Z = 2
Hence, system unstable.
PART 2 Including poles at origin in the Nyquist Path.
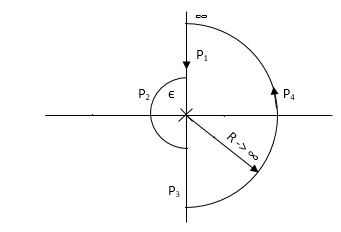
Fig 20 Nyquist Path
P1 W(∞ to Ɛ) Ɛ 0
P2 S = Ɛejϴ Ɛ 0 ϴ(+π/2 to +π to +3π/2)
P3 W(-Ɛ to -∞) Ɛ 0
P4 S = Rejϴ, R ∞, ϴ(3π/2 to 2π to +5π/2)
M = 1/W2√102 + W2 , φ = - π – tan-1(W/10)
P1 W(∞ to Ɛ)
W M φ
∞ 0 -3 π/2
Ɛ ∞ -1800
P3 (mirror image of P1)
P2 S = Ɛejϴ
G(Ɛejϴ) = 1/ Ɛ2e2jϴ(10 + Ɛejϴ)
Ɛ 0
G(Ɛejϴ) = 1/ Ɛ2e2jϴ(10)
= ∞. e-j2ϴϴ(π/2 to π to 3π/2)
-2ϴ = (-π to -2π to -3π)
P4 = 0
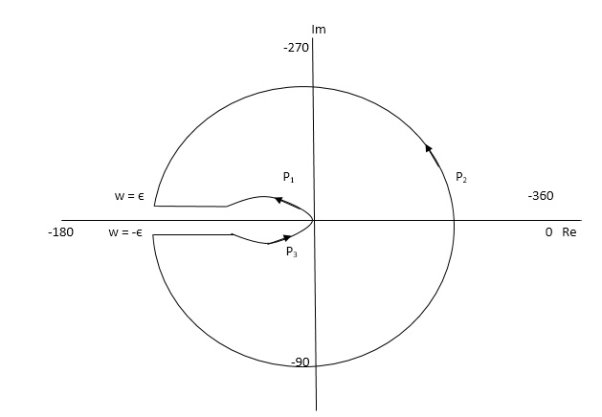
Fig 21 Nyquist Plot G(S) = k/S2(S + 10)
The plot is shown in fig 35. From the plot it is clear that there is no encirclement of -1 in Nyquist path. (N = 0). But the two poles at origin lies to the right half of S-plane in Nyquist path.(P = 2)[see path P2]
N = Z – P
0 = Z – 2
Z = 2
Hence, system is unstable.
Path P2 will be formed by rotating through -π to -2π to -3π
NOTE: The sign convention for angles is shown
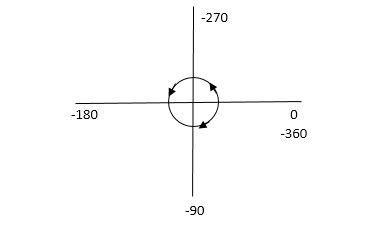
Fig 22 Sign for Angle Directions
Angles are considered –ve for anticlockwise directions and +ve for clockwise directions.
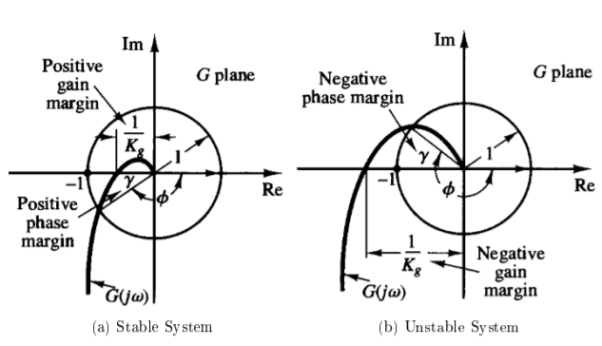
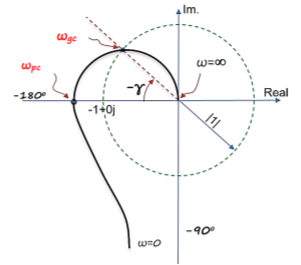
Gain margin (GM): The gain margin is the change in open-loop gain, expressed in decibels (dB), required at 180◦ of phase shift to make the closed-loop system unstable.
Phase margin (PM): The phase margin is the change in open-loop phase shift, required at unity gain to make the closed-loop system unstable.
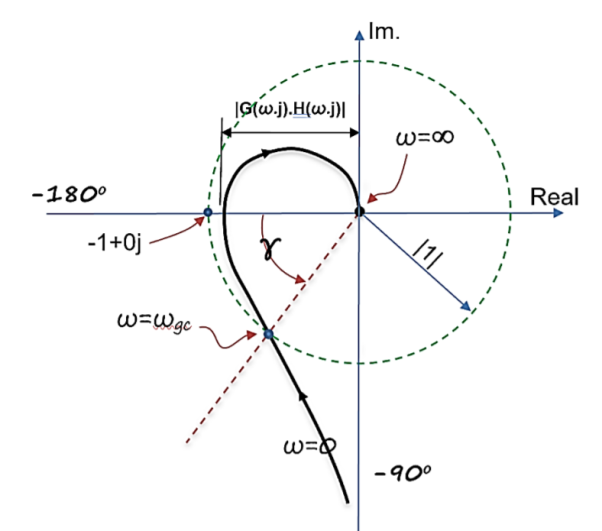
GM = 1/|G(jw)H(jw)| for w=wpc
=20log10(1/|G(jw)H(jw)|)
=-20 log10 (|G(jw)H(jw)|)
For PM refer figure
PM = 1800+ɸ
Gain crossover frequency (ωgc):
The frequency at which magnitude of G(wj)H(wj) is unity (i.e. |G(wj)H(wj)| =1) called gain frequency crossover.
ωpc > ωgc
GM & PM are stable (+ve) Stable system
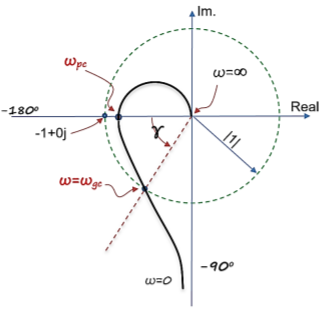
Phase crossover frequency (ωpc):
The frequency at which phase angle of G(wj)H(wj) is -180o
ωgc > ωpc GM & PM are stable (-ve) Unstable system.
The advantages of frequency response
- The absolute and relative stability of the closed loop system can be estimated from the knowledge of open loop frequency response.
- The practical testing of the system can be easier carried with available sinusoidal signal generators and precise measurement equipment.
- The transfer function of complicated functions can be determined experimentally by frequency response test.
- The design and parameter adjustment can be carried more easily.
- The corrective measure for noise disturbance and parameter variation can be easily carried.
- It can be extended to certain non-linear system.
The disadvantages of frequency response analysis are:
- Frequency response analysis is not recommended for the system with very large time constants.
- It is not useful for non-interruptible systems.
- It can generally be applied only to linear systems. When this approach is applied to a non-linear system, the result obtained is not exact.
- It is considered outdated when compared with the methods developed for digital computers and modelling.
References:
1. I. J. Nagrath and M. Gopal, “Control Systems Engineering”, New Age International, 2009.
2. K. Ogata, “Modern Control Engineering”, Prentice Hall, 1991
3. M. Gopal, “Control Systems: Principles and Design”, McGraw Hill Education, 1997.
4. B. C. Kuo, “Automatic Control System”, Prentice Hall, 1995.