Unit - 4
Digital modulation techniques
(i) Generation
To generate the BPSK signal, we build on the fact that the BPSK signal is a special case of DSB-SC modulation. Specifically, we use a product modulator consisting of two components.
(1) Non-return-to-zero level encoder, whereby the input binary data sequence is encoded in polar form with symbols 1 and 0 represented by the constant-amplitude.
(2) Product modulator, which multiplies the level encoded binary wave by the sinusoidal carrier of amplitude to produce the BPSK signal. The timing pulses used to generate the level encoded binary wave and the sinusoidal carrier wave are usually, but not necessarily, extracted from a common master clock.
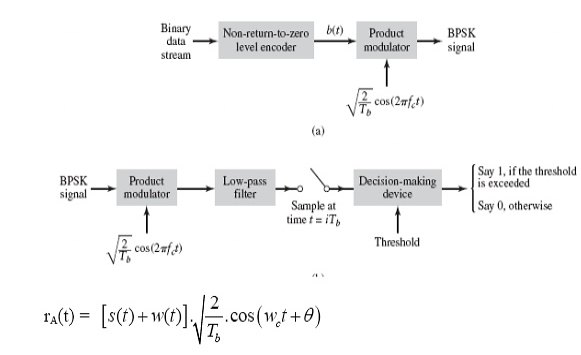
Fig: Generation of BPSK Signal
(ii) Detection
To detect the original binary sequence of 1s and 0s, the BPSK signal at the channel output is applied to a receiver that consists of four sections
(a)Product modulator, which is also supplied with a locally generated reference signal that is a replica of the carrier wave
(b)Low-pass filter, designed to remove the double-frequency components of the product modulator output (i.e., the components centered on) and pass the zero-frequency components.
(c)Sampler, which uniformly samples the output of the low-pass filter at where; the local clock governing the operation of the sampler is synchronized with the clock responsible for bit-timing in the transmitter.
(d)Decision-making device, which compares the sampled value of the low-pass filters output to an externally supplied threshold, every seconds. If the threshold is exceeded, the device decides in favour of symbol 1; otherwise, it decides in favour of symbol 0. Levels.
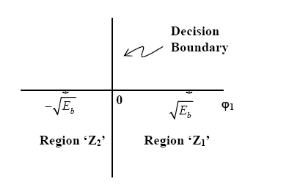
Fig: Decision-making device
The signal at (B) is


Fig: Decision-making device
Error Calculation for BPSK
In BPSK system the basic function is given by

The signals S1(t) and S2(t) are given by
 =
= for symbol 1
 =-
=- for symbol 0
The signal space representation is as shown in fig (N=1 & M=2)
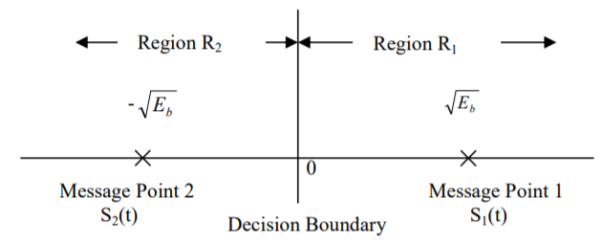
Fig. Signal Space Representation of BPSK
The observation vector x1 is related to the received signal x(t) by

If the observation element falls in the region R1, a decision will be made in favour of symbol ‘1’. If it falls in region R2 a decision will be made in favour of symbol ‘0’. The error is of two types
1) Pe (0/1) i.e., transmitted as ‘1’ but received as ‘0’ and
2) Pe (1/0) i.e., transmitted as ‘0’ but received as ‘1’. Error of 1st kind is given by
Therefore, the above equation becomes

Where =mean value = - for the transmission of symbol ‘0’
 for additive white Gaussiance noise.
Threshold value =0. [Indicates lower limit in integration]

Put 


The total probability of error Pe Pe (1/ 0) Pe (0) Pe (0 /1) Pe (1) assuming probability of 1’s and 0’s are equal.


 amplitude information
 phase information
 the carrier frequency
 the phase shift introduced by the channel
- In coherent communications,
 is known to receivers
 - In non-coherent communications,
 is unknown to receivers and assumed to be a random variable distributed uniformly over (-
- The phase shift is treated as a random variable distributed uniformly over
 , and no phase estimation is provided at the receiver.
 - We are now concerned with non-coherent communications
- The phase shift
 is the same during two consecutive signal transmission intervals
  and
and  .
. - The information phase sequence
 is still differentially encoded as before.
 - The transmitted signal
 in the interval
  is
is

 and
and  are independent. Both of them take values uniformly over

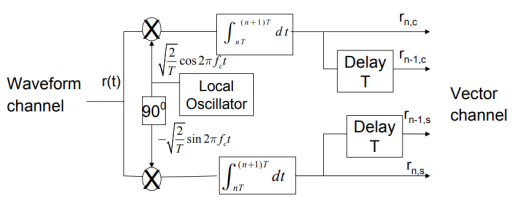
Fig: DPSK generation

Key Takeaways:
Here, the phase of the modulated signal is shifted relative to the previous signal element. No reference signal is considered here. The signal phase follows the high or low state of the previous element. This DPSK technique doesn’t need a reference oscillator.
(i) Generation
On-off level encoder:
Here, the output is of constant amplitude √Eb for input 1 and 0 for input 0.
Pair of oscillators:
Frequency f1 and f2 differ by integer multiple of 1/Tb. The lower oscillator has frequency f2 preceded by inverter. When in a signal interval, the input symbol is 1, the upper oscillator is switched on, and signal s1(t) is transmitted, while lower oscillator is switched off.
When input is 0, upper oscillator is off, lower oscillator is on and signal s2(t) is transmitted.
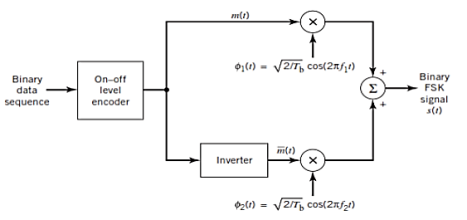
Fig: BFSK generation
(ii) Detection
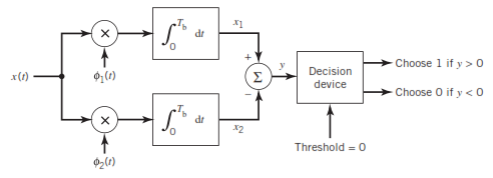
Fig: BFSK detection
It consists of two correlators with a common input, and reference signals Ø1(t), Ø2(t) are applied.
Then y = x1 – x2
The output y is compared with the threshold =0
If y>0 then output = 1 else 0.
But if y=0 then the receiver makes a random guess of 0 or 1.
Error Calculation
In binary FSK system the basic functions are given by


The transmitted signals S1(t) and S2(t) are given by
 for symbol 1
 for symbol 0
Therefore, Binary FSK system has 2-dimensional signal space with two messages S1(t) and S2(t), [N=2, m=2] they are represented as shown in figure
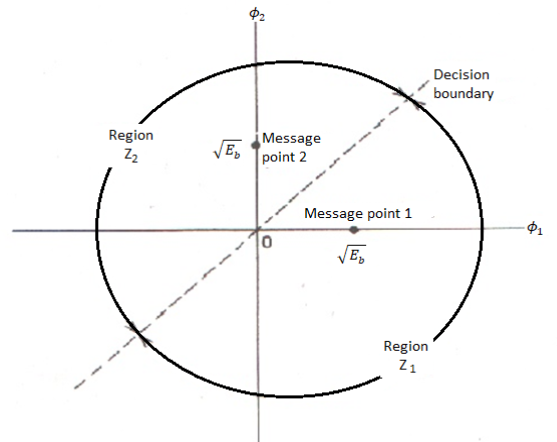
Fig. Signal Space diagram of Coherent binary FSK system.
The two message points are defined by the signal vector
 and
and 
The observation vector x1 and x2 (output of upper and lower correlator) are related to input signal x(t) as
 and
and 
Assuming zero mean additive white Gaussian noise with input PSD N0/2. With variance N0/2. The new observation vector ‘l’ is the difference of two random variables x1 & x2.
1 = x1 – x2
When symbol ‘1’ was transmitted x1 and x2 has mean value of 0 and √Eb respectively. Therefore, the conditional mean of random variable ‘l’ for symbol 1 was transmitted is

Similarly, for ‘0’ transmission

The total variance of random variable ‘l’ is given by
Var[l]= Var[x1] + Var[x2] No
The probability of error is given by


Similarly,

The total probability of error =

Assuming 1’s & 0’s with equal probabilities


Key Takeaways:
The FSK modulator block diagram comprises of two oscillators with a clock and the input binary sequence
The main methods of FSK detection are asynchronous detector and synchronous detector.
Minimum Shift Key Modulation is another type of digital modulation technique used to convert a digital signal into analog signals. It is also called Minimum-shift keying (MSK) or Advance Frequency Shift Keying because it is a type of continuous-phase frequency-shift keying.
Key features
- It is encoded with bits alternating between quadrature components, with the Q component delayed by half the symbol period.
- Minimum Shift Keying is the most effective digital modulation technique. It can be implemented for almost every stream of bits much easier than the Phase Shift Key, Frequency Shift Key and Amplitude Shift Key of digital modulation technique.
- The Minimum Shift Keying's concept is based on the positioning of bits such as even bits and odd bits for the given bitstream and the bit positioning frequency generating table.
- MSK is the most widely used digital modulation technology because of its ability and flexibility to handle "One (1)" and "Zero (0)" transition of binary bits.
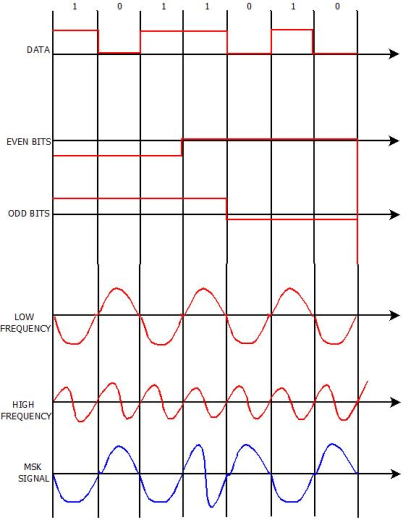
Fig.: MSK output
The word binary represents two bits. M represents a digit that corresponds to the number of conditions, levels, or combinations possible for a given number of binary variables.
This is the type of digital modulation technique used for data transmission in which instead of one bit, two or more bits are transmitted at a time. As a single signal is used for multiple bit transmission, the channel bandwidth is reduced.
M-ary Equation
If a digital signal is given under four conditions, such as voltage levels, frequencies, phases, and amplitude, then M = 4.
The number of bits necessary to produce a given number of conditions is expressed mathematically as
N=log2M
Where
N is the number of bits necessary
M is the number of conditions, levels, or combinations possible with N bits.
The above equation can be re-arranged as
2N=M
For example, with two bits, 22 = 4 conditions are possible.
M-ary PSK
This is called as M-ary Phase Shift Keying M−ary PSK
The phase of the carrier signal, takes on M different levels.
Representation of M-ary PSK
Si(t)=√2E/T cos(wot+ϕit) 0≤t≤T and i=1,2...M
ϕi(t)=2πiM where i=1,2,3......M
Some prominent features of M-ary PSK are −
- The envelope is constant with more phase possibilities.
- This method was used during the early days of space communication.
- Better performance than ASK and FSK.
- Minimal phase estimation error at the receiver.
- The bandwidth efficiency of M-ary PSK decreases and the power efficiency increases with the increase in M.
So far, we have discussed different modulation techniques. The output of all these techniques is a binary sequence, represented as 1s and 0s
Error Calculation
In M-ary PSK, M different phase shifts of the carrier are used to convey the information. The M = 2k signal waveforms, each representing k information bits, are represented as


The M-ary PSK signal

By choosing the same basis functions as for QPSK, it is possible to express all waveforms in the M-PSK signal set as vectors in the plane spanned by φ1 and φ2 as

Where


The signal vectors lie around a circle of radius √ Es The constellation for 8- PSK (M = 8) is shown in Figure
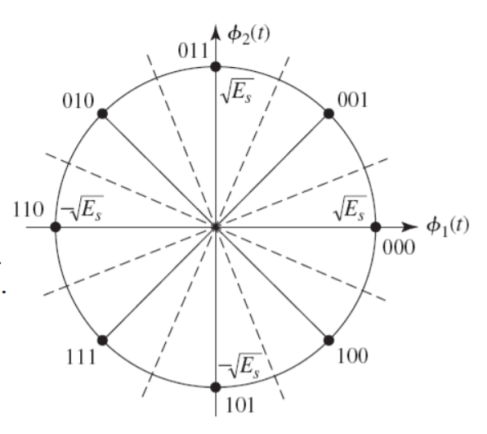
Fig. Signal space diagram for MSK system
The minimum distance between two adjacent signal points is

The nearest-neighbour estimate of Pe is


Key takeaway
The transmitted M number of signals are equal in energy and duration.
The signals are separated by 1/2Ts Hz making the signals orthogonal to each other.
Since M signals are orthogonal, there is no crowding in the signal space.
Modulation scheme | Distance | Bandwidth |
BPSK |  |  |
QPSK |  |  |
M-PSK |  |  |
16-QAM |  |  |
BFSK |  | (Orthogonal BFSK) |

N- number of bits per symbol


Solved Examples
Q1) Determine the baud and minimum bandwidth necessary to pass a 10-kbps binary signal using amplitude shift keying.
A1) For ASK, N = 1, and the baud and minimum bandwidth are determined from
B=fb/N
Where N is the number of bits encoded into each signaling element.
B = 10,000 / 1 = 10,000
Baud = 10, 000 /1 = 10,000
Q2) Determine (a) the peak frequency deviation, (b) minimum bandwidth, and (c) baud for a binary FSK signal with a mark frequency of 49 kHz, a space frequency of 51 kHz, and an input bit rate of 2 kbps.
A2)
a) Frequency deviation is ∆f = |fm – fs | / 2
Where ∆f = frequency deviation (hertz) |fm – fs | = absolute difference between the mark and space frequencies (hertz)
∆f = |149kHz - 51 kHz| / 2 =1 kHz
b. The minimum bandwidth is B = 2(∆f + fb)
Where B= minimum Nyquist bandwidth (hertz)
∆f= frequency deviation | (fm– fs) | (hertz)
Fb = input bit rate (bps)
B = 2(1000 + 2000) = 6 kHz c. For FSK, N = 1, and the baud is determined from Equation 2.11 as baud = 2000 / 1 = 2000
c. For FSK, N = 1, and the baud is determined from Equation 2.11 as baud = 2000 / 1 = 2000
Q3) For a BPSK modulator with a carrier frequency of 70 MHz and an input bit rate of 10 Mbps, determine the maximum and minimum upper and lower side frequencies, draw the output spectrum, determine the minimum Nyquist bandwidth, and calculate the baud.
A3) Substituting into Equation
BPSK output = [sin (2πfa t)] x [sin (2πfc t)]
Fa = fb / 2 = 5 MHz = [sin 2π(5MHz) t)] x [sin 2π(70MHz) t)] = 0.5cos [2π (70MHz – 5MHz) t] – 0.5cos [2π (70MHz + 5MHz) t]
Minimum lower side frequency (LSF): LSF=70MHz - 5MHz = 65MHz
Maximum upper side frequency (USF): USF = 70 MHz + 5 MHz = 75 MHz
Therefore, the output spectrum for the worst-case binary input conditions is as follows: The minimum Nyquist bandwidth (B) is
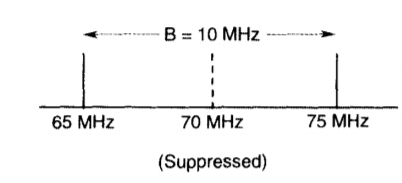
B = 75 MHz - 65 MHz = 10 MHz
And the baud = fb or 10 megabaud.
Consider next the M-ary version of FSK, for which the transmitted signals are defined by

Where i = 1, 2, , M, and the carrier frequency fc = nc/(2T) for some fixed integer nc. The transmitted symbols are of equal duration T and have equal energy E. Since the individual signal frequencies are separated by 1/(2T) Hz, the M-ary FSK signals constitute an orthogonal set; that is,

Hence, we may use the transmitted signals si (t) themselves, except for energy normalization, as a complete orthonormal set of basis functions, as shown by
 For
For  and
and 
Accordingly, the M-ary FSK is described by an M-dimensional signal-space diagram. For the coherent detection of M-ary FSK signals, the optimum receiver consists of a bank of M correlators or matched filters, with i (t) providing the basis functions. At the sampling times t = kT, the receiver makes decisions based on the largest matched filter output in accordance with the maximum likelihood decoding rule. An exact formula for the probability of symbol error is, however, difficult to derive for a coherent M-ary FSK system. Nevertheless, we may use the union bound to place an upper bound on the average probability of symbol error for M-ary FSK. Specifically, since the minimum distance dmin in M-ary FSK is √2E, we have

For fixed M, this bound becomes increasingly tight as the ratio EN0 is increased. Indeed, it becomes a good approximation to Pe for values of Pe 10–3.
Power Spectra of M-ary FSK Signals
The spectral analysis of M-ary FSK signals is much more complicated than that of M-ary PSK signals. A case of particular interest occurs when the frequencies assigned to the multilevel make the frequency spacing uniform and the frequency deviation h = 12. That is, the M signal frequencies are separated by 1/2T, where T is the symbol duration. For h = 12, the baseband power spectral density of M-ary FSK signals is plotted in Figure below for M = 2, 4, 8.
Bandwidth Efficiency of M-ary FSK Signals
When the orthogonal signals of an M-ary FSK signal are detected coherently, the adjacent signals need only be separated from each other by a frequency difference 12T so as to maintain orthogonality. Hence, we may define the channel bandwidth required to transmit M-ary FSK signals as
B=M/2T
For multilevels with frequency assignments that make the frequency spacing uniform and equal to 1/2T, the bandwidth B contains a large fraction of the signal power.
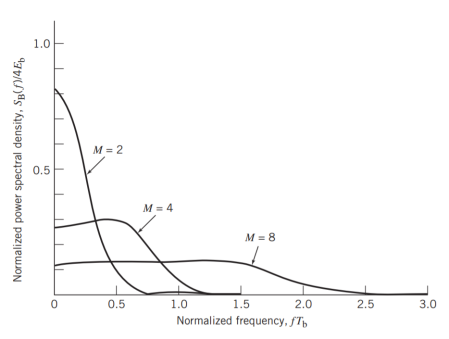
Fig: Power spectra of M-ary PSK signals for M = 2, 4, 8.[5]
Hence, using Rb=1/Tb, we may redefine the channel bandwidth B for M-ary FSK signals as

The bandwidth efficiency of M-ary signals is therefore

Key takeaway
When the orthogonal signals of an M-ary FSK signal are detected coherently, the adjacent signals need only be separated from each other by a frequency difference 12T so as to maintain orthogonality. Hence, we may define the channel bandwidth required to transmit M-ary FSK signals as
B=M/2T
(i) Generation
The QPSK Modulator uses a bit-splitter, two multipliers with local oscillator, a 2-bit serial to parallel converter, and a summer circuit.
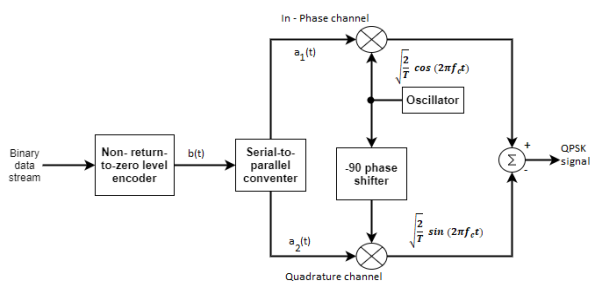
Fig: QPSK generation
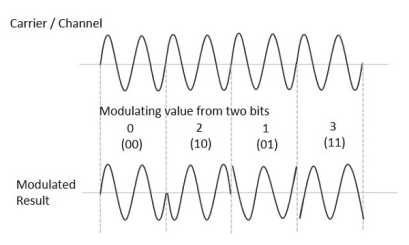
At the modulator’s input, the message signal’s even bits (i.e., 2nd bit, 4th bit, 6th bit, etc.) and odd bits (i.e., 1st bit, 3rd bit, 5th bit, etc.) are separated by the bits splitter and are multiplied with the same carrier to generate odd BPSK (called as PSKI) and even BPSK (called as PSKQ). The PSKQ signal is anyhow phase shifted by 90° before being modulated.
The QPSK waveform for two-bits input is as follows, which shows the modulated result for different instances of binary inputs.
(ii) Detection
The QPSK Demodulator uses two product demodulator circuits with local oscillator, two band pass filters, two integrator circuits, and a 2-bit parallel to serial converter.
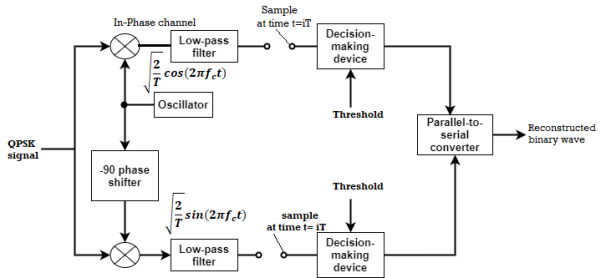
Fig: QPSK detectors
The two product detectors at the input of demodulator simultaneously demodulate the two BPSK signals. The pair of bits are recovered here from the original data. These signals after processing are passed to the parallel to serial converter.
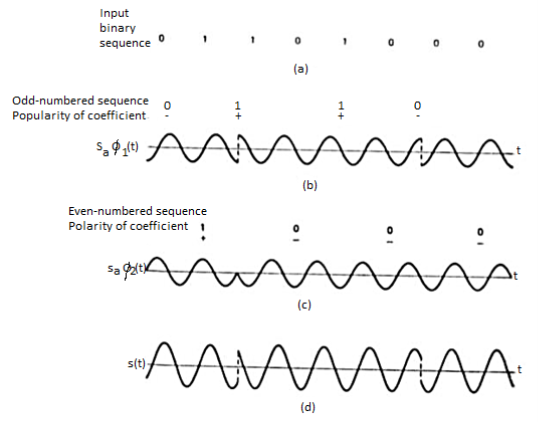
Fig: QPSK output
Error Calculation
In QPSK system the information carried by the transmitted signal is contained in the phase. The transmitted signals are given by


Where the carrier frequency fc=nc/7 for some fixed integer nc.
E = the transmitted signal energy per symbol.
T = Symbol duration.
The basic functions ɸ1(t) and ɸ2(t) are given by


There are four message points and the associated signal vectors are defined by
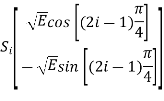
The table shows the elements of signal vectors, namely Si1 & Si2
Input dibit | Phase of QPSK signal (radians) | Coordinates of message points | Input dibit |
 |  | ||
10 |  |  |  |
00 |  |  |  |
01 |  |  | +  |
11 |  |  | +  |
Therefore, a QPSK signal is characterized by having a two-dimensional signal constellation (i.e., N=2) and four message points (i.e., M=4) as illustrated in figure.
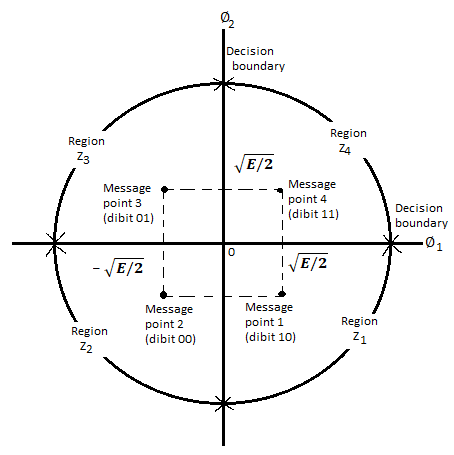
Fig. Signal-space diagram of coherent QPSK system
A QPSK system is in fact equivalent to two coherent binary PSK systems working in parallel and using carriers that are in-phase and quadrature. The in-phase channel output x1 and the Q-channel output x2 may be viewed as the individual outputs of the two coherent binary PSK systems. Thus, the two binary PSK systems may be characterized as follows
The signal energy per bit √E/2
The noise spectral density is No/2
The average probability of bit error in each channel of the coherent QPSK system is 


The bit errors in the I-channel and Q-channel of the QPSK system are statistically independent. The I-channel makes a decision on one of the two bits constituting a symbol (di bit) of the QPSK signal and the Q-channel takes care of the other bit. Therefore, the average probability of a direct decision resulting from the combined action of the two channels working together is pc= probability of correct reception p1= probability of error


The average probability of symbol error for coherent QPSK is given by

In the region where E/2No We may ignore the second term and so the approximate formula for the average probability of symbol error for coherent QPSK system is

Key takeaway
QPSK Modulator uses a bit-splitter, two multipliers with local oscillator, a 2-bit serial to parallel converter, and a summer circuit.
In the coherent detection of binary FSK signal, the phase information contained in the received signal is not fully exploited, other than to provide for synchronization of the receiver to the transmitter. We now show that by proper use of the continuous-phase property when performing detection, it is possible to improve the noise performance of the receiver significantly. Here again, this improvement is achieved at the expense of increased system complexity. Consider a continuous-phase frequency-shift keying (CPFSK) signal, which is defined for the signaling interval 0 t Tb as follows:

Where Eb is the transmitted signal energy per bit and Tb is the bit duration.
Another useful way of representing the CPFSK signal s(t) is to express it as a conventional angle-modulated signal:

Where (t) is the phase of s(t) at time t. When the phase (t) is a continuous function of time, we find that the modulated signal s(t) is itself also continuous at all times, including the inter-bit switching times. The phase (t) of a CPFSK signal increases or decreases linearly with time during each bit duration of Tb seconds, as shown by

Here the plus sign corresponds to sending symbol 1 and the minus sign corresponds to sending symbol 0; the dimensionless parameter h is to be defined. We deduce the following pair of relations:


Solving this pair of equations for fc and h, we get


Signal-Space Diagram of MSK
Using a well-known trigonometric identity of conventional angle modulated signal, we may expand the CPFSK signal s(t) in terms of its in-phase and quadrature components as

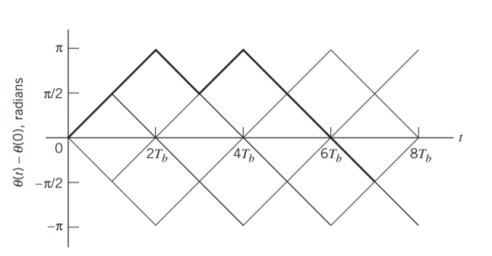
Fig: Boldfaced path represents the sequence 1101000.
Consider, first, the in-phase component √2Eb/Tbcos(t)

Where the plus sign corresponds to symbol 1 and the minus sign corresponds to symbol 0. A similar result holds for (t) in the interval –Tb t 0, except that the algebraic sign is not necessarily the same in both intervals. Since the phase (0) is 0 or depending on the past history of the modulation process, we find that in the interval –Tb t Tb, the polarity of cos(t) depends only on (0), regardless of the sequence of 1s and 0s transmitted before or after t = 0. Thus, for this time interval, the in-phase component consists of the half-cycle cosine pulse:


Where the plus sign corresponds to (0) = 0 and the minus sign corresponds to (0) = . In a similar way, we may show that, in the interval 0 t 2Tb, the quadrature component of s(t) consists of the half-cycle sine pulse:


Where the plus sign corresponds to (Tb) = 2 and the minus sign corresponds to (Tb)=–2. From the discussion just presented, we see that the in-phase and quadrature components of the MSK signal differ from each other in two important respects:
- They are in phase quadrature with respect to each other and
- The polarity of the in-phase component sI(t) depends on (0), whereas the polarity of the quadrature component sQ(t) depends on (Tb).
Moreover, since the phase states (0) and (Tb) can each assume only one of two possible values, any one of the following four possibilities can arise:
1. (0) = 0 and (Tb) = /2, which occur when sending symbol 1.
2. (0) = and (Tb) = /2, which occur when sending symbol 0.
3. (0) = and (Tb) = –/2 (or, equivalently, 3/2 modulo 2), which occur when sending symbol 1.
4. (0) = 0 and (Tb) = –/2, which occur when sending symbol 0.
This fourfold scenario, in turn, means that the MSK signal itself can assume one of four possible forms, depending on the values of the phase-state pair: (0) and (Tb).
Signal-Space Diagram
We see that there are two orthonormal basis functions 1(t) and 2(t) characterizing the generation of MSK; they are defined by the following pair of sinusoidally modulated quadrature carriers:


Where the coefficients s1 and s2 are related to the phase states (0) and (Tb), respectively. To evaluate s1, we integrate the product s(t)1(t) with respect to time t between the limits –Tb and Tb, obtaining


Similarly, to evaluate s2 we integrate the product s(t)2(t) with respect to time t between the limits 0 and 2Tb, obtaining

From above two equations we conclude that
1. Both integrals are evaluated for a time interval equal to twice the bit duration.
2. The lower and upper limits of the integral used to evaluate s1 are shifted by the bit duration Tb with respect to those used to evaluate s2.
3. The time interval 0 t Tb, for which the phase states (0) and (Tb) are defined, is common to both integrals.
It follows, therefore, that the signal constellation for an MSK signal is two-dimensional (i.e., N = 2), with four possible message points (i.e., M = 4), as illustrated in the signal space diagram of Figure below.
 and
and 
The possible values of (0) and (Tb), corresponding to these four message points, are also included in Figure below. The signal-space diagram of MSK is thus similar to that of QPSK in that both of them have four message points in a two-dimensional space. However, they differ in a subtle way that should be carefully noted:
- QPSK, moving from one message point to an adjacent one, is produced by sending a two-bit symbol (i.e., dibit).
- MSK, on the other hand, moving from one message point to an adjacent one, is produced by sending a binary symbol, 0 or 1. However, each symbol shows up in two opposite quadrants, depending on the value of the phase-pair: (0) and (Tb).
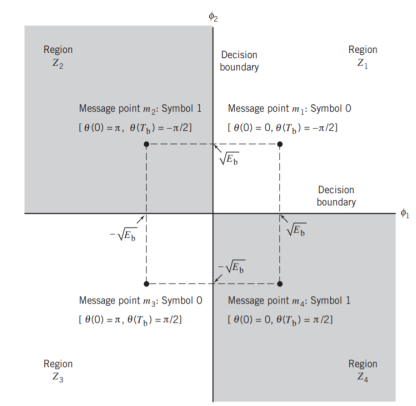
Fig: Signal-space diagram for MSK system
Generation and Coherent Detection of MSK Signals
With h = 1/2, we may use the block diagram of Figure(a) below to generate the MSK signal. The advantage of this method of generating MSK signals is that the signal coherence and deviation ratio are largely unaffected by variations in the input data rate. Two input sinusoidal waves, one of frequency fc = nc4Tb for some fixed integer nc and the other of frequency 14Tb, are first applied to a product modulator. This modulator produces two phase-coherent sinusoidal waves at frequencies f1 and f2, which are related to the carrier frequency fc and the bit rate 1/Tb in accordance with above equations for deviation ratio h = 12. These two sinusoidal waves are separated from each other by two narrowband filters, one centered at f1 and the other at f2. The resulting filter outputs are next linearly combined to produce the pair of quadrature carriers or orthonormal basis functions 1(t) and 2(t). Finally, 1(t) and 2(t) is multiplied with two binary waves a1(t) and a2(t), both of which have a bit rate equal to 1/(2Tb)
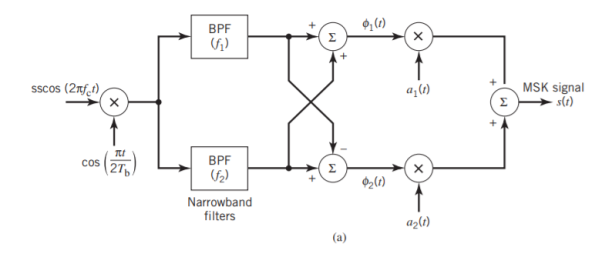
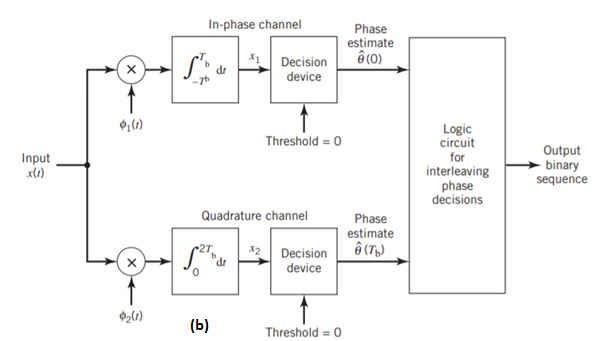
Fig: Block diagrams for (a) MSK transmitter and (b) coherent MSK receiver
Figure (b) above shows the block diagram of the coherent MSK receiver. The received signal x(t) is correlated with 1(t) and 2(t). In both cases, the integration interval is 2Tb seconds, and the integration in the quadrature channel is delayed by Tb seconds with respect to that in the in-phase channel. The resulting in-phase and quadrature channel correlator outputs, x1 and x2, are each compared with a threshold of zero
Error Probability of MSK
In the case of an AWGN channel, the received signal is given by
x(t) = s(t) + w(t)
Where s(t) is the transmitted MSK signal and w(t) is the sample function of a white Gaussian noise process of zero mean and power spectral density N0/2. To decide whether symbol 1 or symbol 0 was sent in the interval 0 t Tb, say, we have to establish a procedure for the use of x(t) to detect the phase states (0) and (Tb). For the optimum detection of (0), we project the received signal x(t) onto the reference signal over the interval –Tb t Tb, obtaining

w1 is the sample value of a Gaussian random variable of zero mean and variance N0/2. From the signal-space diagram, we see that if x1 > 0, the receiver chooses the estimate. On the other hand, if x1 0, it chooses the estimate. Similarly, for the optimum detection of (Tb), we project the received signal x(t) onto the second reference signal 2(t) over the interval 0 t 2Tb, obtaining

w2 is the sample value of another independent Gaussian random variable of zero mean and variance N02. Referring again to the signal space diagram, we see that if x2 0, the receiver chooses the estimate Tb = – 2. If, however, x2 0, the receiver chooses the estimate ˆ Tb = 2
It follows, therefore, that the BER for the coherent detection of MSK signals is given by

Key takeaway
- In M-ary PSK using coherent detection, increasing M improves the bandwidth efficiency, but the Eb/N0 required for the idealized condition of “error-free” transmission moves away from the Shannon limit as M is increased.
- In M-ary FSK, as the number of frequency-shift levels M is increased—which is equivalent to increased channel-bandwidth requirement—the operating point moves closer to the Shannon limit.
QAM (also known as QASK) is a combination of ASK and PSK. Here, both the amplitude and the phase are varied to transmit more bits per symbol.
The QAM modulator essentially follows the idea that can be seen from the basic QAM theory where there are two carrier signals with a phase shift of 90° between them. These are then amplitude modulated with the two data streams known as the I or In-phase and the Q or quadrature data streams. These are generated in the baseband processing area.
Basic QAM I-Q modulator circuit
The two resultant signals are summed and then processed as required in the RF signal chain, typically converting them in frequency to the required final frequency and amplifying them as required.
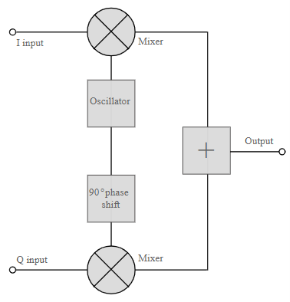
Fig: Basic QAM
It is worth noting that as the amplitude of the signal varies any RF amplifiers must be linear to preserve the integrity of the signal. Any non-linearities will alter the relative levels of the signals and alter the phase difference, thereby distorting he signal and introducing the possibility of data errors.
Basic QAM I-Q demodulator circuit
The basic modulator assumes that the two quadrature signals remain exactly in quadrature.
A further requirement is to derive a local oscillator signal for the demodulation that is exactly on the required frequency for the signal. Any frequency offset will be a change in the phase of the local oscillator signal with respect to the two double sideband suppressed carrier constituents of the overall signal.
Systems include circuitry for carrier recovery that often utilises a phase locked loop - some even have an inner and outer loop. Recovering the phase of the carrier is important otherwise the bit error rate for the data will be compromised.
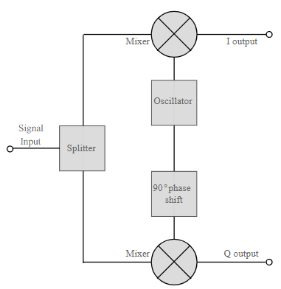
Fig: Basic QAM demodulator
The circuits shown above show the generic IQ QAM modulator and demodulator circuits that are used in a vast number of different areas. Not only are these circuits made from discrete components, but more commonly they are used within integrated circuits that are able to provide a large number of functions.
Error Probability
BER for QAM constellation
The SER for a rectangular M-QAM (16-QAM, 64-QAM, 256-QAM etc) with size L = M2 can be calculated by considering two M-PAM on in-phase and quadrature components. The error probability of QAM symbol is obtained by the error probability of each branch (M-PAM) and is given by

Signal Space Representation
For the case when M = 2k, k even, the resulting signal space diagram has a “square constellation.” In this case the QAM signal can be thought of as 2 PAM signals in quadrature. For M = 2k, k odd, the constellation takes on a “cross” form. For example, 16-QAM constellation is
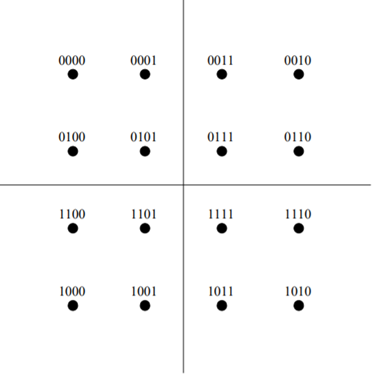
Fig:16-QAM constellation
Key takeaway
QAM (also known as QASK) is a combination of ASK and PSK. Here, both the amplitude and the phase are varied to transmit more bits per symbol.

Fig: General spread spectrum structure
- Spread spectrum is specially used for wireless communication signal spreading. Transmitted signals frequency varies deliberately.
- Frequency hopping and direct sequence are two popular spread spectrums.
- In frequency hopping, signals are broadcast over any random series of frequency while in direct sequence each bit is in order of multiple bit of transmitting signal it uses chipping code.
Spread spectrum signals are used for
- Combating or suppressing the detrimental effects of interference due to jamming (Intentional interference). It can be used in military applications also.
- Accommodating multiple users to transmit messages simultaneously over the same channel bandwidth. This type of digital communication in which each user (transmitter-receiver pair) has a distinct PN code for transmitting over a common channel bandwidth is called as Code Division Multiple Access (CDMA) or Spread Spectrum Multiple Access (SSMA). This technique is popularly used in digital cellular communications.
- Reducing the unintentional interference arising from other users of the channel.
- Suppressing self-interference due to multipath propagation.
- Hiding a signal by transmitting it at low power and, thus, making it difficult for an unintended listener to detect in the presence of background noise. It is also called a Low Probability of Intercept (LPI) signal.
- Achieving message privacy in the presence of other listeners.
- Obtaining accurate range (time delay) and range rate (velocity) measurements in radar and navigation.
Key takeaway
There are two spread-spectrum approaches called Transmitted Reference (TR) and Stored Reference (SR).
(i) In a TR system, the transmitter sends two versions of truly random spreading signal (wideband carrier) – one modulated by data and the other unmodulated. The receiver used the unmodulated carrier as the reference signal for despreading (correlating) the data modulated carrier.
(ii) (ii)In a SR system, the spreading code signal is independently generated at both the transmitter and the receiver. Since the same code must be generated independently at two locations, the code sequence must be deterministic, even though it should appear random to unauthorized listeners. Such random appearing deterministic signals are called pseudo noise (PN), or pseudorandom signals.
(iii) Modern spread spectrum systems use Stored Reference (SR) approach which uses a Pseudo noise (PN) or pseudorandom code signal.
In this signal results in wider bandwidth due to spreading of particular generated bandwidth.
In this signal is transmitted on larger bandwidth.
It is used to prevent interference and jammed.
It consists of two types of spread spectrum 1. Frequency hopped spread spectrum and direct sequence spread sequence.
FHSS
It is a technique of frequency hopping used to frequencies according to its usage by the user.
It is also called as frequency reuse.
To provide secure transmission the frequency of the data is hopped from one to another.
Dwell time is used which is time sent of each hop.
DHSS
It is a direct sequence spread spectrum.
In this each of the user multiplied by the user technique.
This secrete code is called as chopping code.
To retrieve the message user uses the same code.
Direct Sequence Spread Spectrum (DSSS) using BPSK modulation, so the first reversing switch introduces 180 degree phase reversals according to a pseudo-random code, while the second introduces the same reversals to reconstitute the original, narrow-band signal. The output is a “recompressed” narrow-band signal.
DSSS is a spread spectrum modulation technique used for digital signal transmission over airwaves. It was originally developed for military use, and employed difficult-to-detect wideband signals to resist jamming attempts.
It is also being developed for commercial purposes in local and wireless networks.
The stream of information in DSSS is divided into small pieces, each associated with a frequency channel across spectrums. Data signals at transmission points are combined with a higher data rate bit sequence, which divides data based on a spreading ratio. The chipping code in a DSSS is a redundant bit pattern associated with each bit transmitted.
This helps to increase the signal's resistance to interference. If any bits are damaged during transmission, the original data can be recovered due to the redundancy of transmission.
The entire process is performed by multiplying a radio frequency carrier and a pseudo-noise (PN) digital signal. The PN code is modulated onto an information signal using several modulation techniques such as quadrature phase-shift keying (QPSK), binary phase-shift keying (BPSK), etc. A doubly-balanced mixer then multiplies the PN modulated information signal and the RF carrier. Thus, the TF signal is replaced with a bandwidth signal that has a spectral equivalent of the noise signal. The demodulation process mixes or multiplies the PN modulated carrier wave with the incoming RF signal. The result produced is a signal with a maximum value when two signals are correlated. Such a signal is then sent to a BPSK demodulator. Although these signals appear to be noisy in the frequency domain, bandwidth provided by the PN code permits the signal power to drop below the noise threshold without any loss of information.
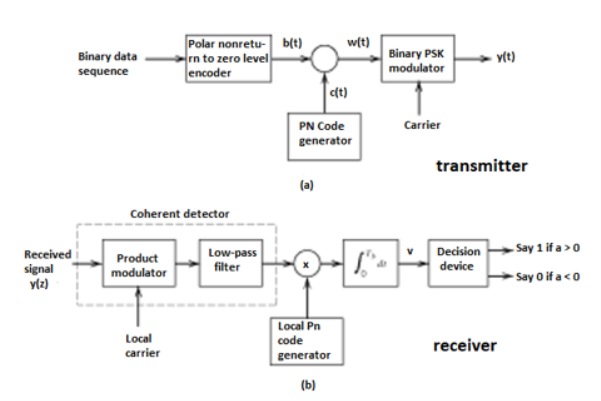
Fig (a) Transmitter (b) Receiver of DS-SS Technique
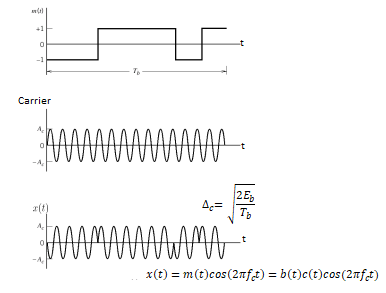
Fig. Wave forms for DSSS
Key takeaway
- In practice, the transmitter and receiver of Figures shown above are followed. In the transmitter spectrum spreading is performed prior to phase modulation. Also phase demodulation is done first and then despreading is done second, in the receiver.
- In the model of DS spread spectrum BPSK system used for analysis, the order of these two operations is interchanged. In the transmitter, BPSK is done first and spectrum spreading is done subsequently. Similarly, at the receiver also, spectrum de spreading is done first and then phase demodulation is done second.
- This is possible, because the spectrum spreading and BPSK are both linear operations.
This is frequency hopping technique, where the users are made to change the frequencies of usage, from one to another in a specified time interval, hence called as frequency hopping. For example, a frequency was allotted to sender 1 for a particular period of time. Now, after a while, sender 1 hops to the other frequency and sender 2 uses the first frequency, which was previously used by sender 1. This is called as frequency reuse.
The frequencies of the data are hopped from one to another in order to provide a secure transmission. The amount of time spent on each frequency hop is called as Dwell time.
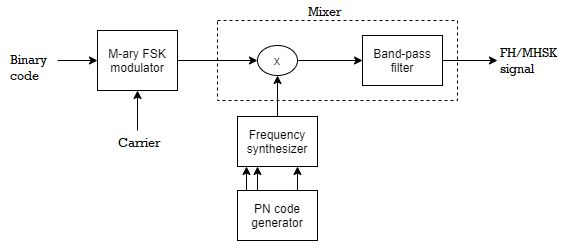
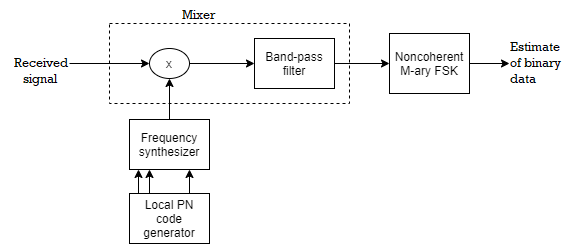
Fig. FHSS Transmitter and Receiver
Advantages of FH-SS system:
1. The processing gain PG is higher than that of DS-SS system
2. Synchronization is not greatly dependent on the distance.
3. The serial search system with FH-SS needs shorter time for acquisition.
Disadvantages of FH-SS system:
1. The bandwidth of FH-SS system is too large (in GHz).
2. Complex and expensive digital frequency synthesizers are required.
Applications of FHSS system:
1) CDMA systems based on FH spread spectrum signals are particularly attractive for mobile communication.
2) Wireless local area networks (WLAN) standard for Wi-Fi.
3) Wireless Personal area network (WPAN) standard for Bluetooth.
Comparison between FHSS and DSSS
FHSS | DSSS |
Multiple frequencies are used | Single frequency is used |
Hard to find the user’s frequency at any instant of time | User frequency, once allotted is always the same |
Frequency reuse is allowed | Frequency reuse is not allowed |
Sender need not wait | Sender has to wait if the spectrum is busy |
Power strength of the signal is high | Power strength of the signal is low |
Stronger and penetrates through the obstacles | It is weaker compared to FHSS |
It is never affected by interference | It can be affected by interference |
It is cheaper | It is expensive |
This is the commonly used technique | This technique is not frequently used |
The most important application of spread spectrum technique is the Digital cellular CDMA system. Here, we shall explain in detail about this CDMA digital cellular system based on Direct Sequence (DS) spread spectrum. This digital cellular communication system was proposed and developed by Qualcomm corporation. It has been standardized and designated as Interim Standard 95 (IS-95) by the Telecommunications Industry Association (TIA) for use in the 800 MHz and in the 1900 MHz frequency bands. The nominal bandwidth used for transmission from a base station to the mobile receivers (Forward link or channel) is 1.25 MHz. A separate channel, also with a bandwidth of 1.25 MHz is used for signal transmission from mobile receivers to a base station (reverse link or channel). The signals transmitted in both the forward and reverse links are DS Spread spectrum signals having a chip rate of 1.288 x 10⁶ chips per second (Mchips/s).
A) Forward link or channel
The signal transmission from a base station to the mobile receivers is referred as the Forward link or channel. The figure below shows the block diagram of IS-95 forward link.
Source coding
The speech (source) coder is a code-excited linear predictive (CELP) coder. It generates data at the variable rates of 9600, 4800, 2400 and 1200bits/s. The data rate is a function of the speech activity of the user, in frame intervals of 20ms.
Channel coding
The data from the speech coder is encoded by a rate 1/2, constraint length K = 9 convolutional code. For lower speech activity, the output symbols from the convolutional encoder are repeated. If the data rate is 4800 bits/s, then the output symbols are repeated twice, so as to maintain a constant bit rate of 9600 bits/s.
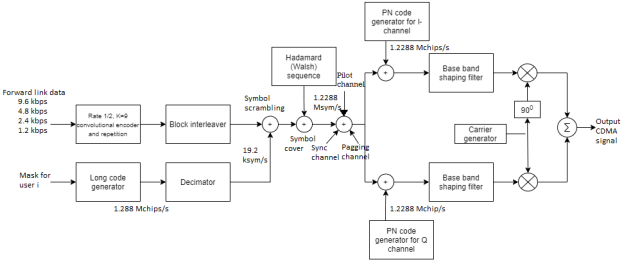
Fig. IS-95 Forward Link
Block interleaver:
The encoded bits for each frame are passed through a block interleaver. It is needed to overcome the effects of burst errors that may occur in transmission through the channel. The data bits at the output of the block interleaver occur at a rate of 19.2kbits/s.
Symbol scrambler
The data bits from the block interleaver are scrambled by multiplication with the output of a long code (period N=242 -1) generator. This generator is running at the chip rate of 1.288M chips/s, but the output is decimated by a factor of 64 to 19.2 kchips/s. The long code is used to uniquely identify a call of a mobile station on the forward and reverse links.
Hadamard Sequence
Each user of the channel is assigned a Hadamard (or Walsh) sequence of length 64. There are 64 orthogonal Hadamard sequences assigned to each base station. Thus, there are 64 channels available. One Hadamard sequence is used to transmit a pilot signal. The pilot signal is used for measuring the channel characteristics, including the signal strength and the carrier phase offset. Another Hadamard sequence is used for providing time synchronization. Another one sequence may be used for messaging (paging) service. Hence there are 61 channels left for allocation to different-users. The data sequence is now multiplied by the assigned Hadamard sequence of each user.
Modulator
The resulting binary sequence is now spread by multiplication with two PN sequences of length 215 and rate 1.2288 Mchips/s. This operation creates in-phase and quadrature signal components. Thus, the binary data signal is converted to a four-phase signal. Then, both I and Q signals are filtered by baseband spectral shaping filters. Different base stations are identified by different offsets of these PN sequences. The signals for all the 64 channels are transmitted synchronously. Finally, heterodyning of a carrier wave with BPSK modulation and QPSK spreading, is done. The summed output is the CDMA signal.
Mobile receiver
At the receiver, a RAKE demodulator is used to resolve the major multipath signal components. Then, they are phase-aligned and weighted according to their signal strength using the estimates of phase and signal strength derived from the pilot signal. These components are combined and passed to the Viterbi Soft decision decoder.
B) Reverse link or channel
The signal transmission from mobile transmitters to a base station is referred as the Reverse link or channel. The Figure below shows the block diagram of IS-95 reverse link.
Limitations
In the reverse link, the signals transmitted from various mobile transmitters to the base station are asynchronous. Hence, there is significantly more interference among users. Also, the mobile transmitters are usually battery operated and therefore, these transmissions are power limited. We have to design the reverse link in order to compensate for these two limitations.
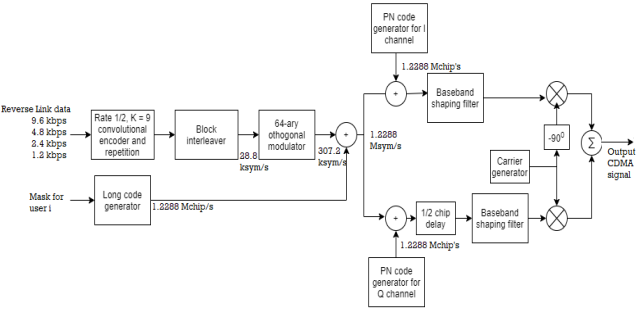
Fig. IS-95 Reverse link
Source coding
The reverse link data may also be at variable rates of 9600, 4800, 2400 and 1200 bits/s. The data rate is a function of the speech activity of the user, in frame intervals of 20ms.
Channel coding
The data from the speech coder is encoded by a rate 1/3, constraint length K=9 convolutional code. This coder has higher coding gain in a fading channel. This compensates for the above-mentioned limitations. For lower speech activity, the output bits form the convolutional encoder are repeated either two, or four, or eight times.
Block interleaver
The encoded bits for each frame are passed through a block interleaver. It is needed to overcome the effects of burst errors. For each 20ms frame, the 576 encoded bits are block-interleaved. However, the coded bit rate is 28.2 kbits/s.
Hadamard sequence
The data is modulated using an M=64 orthogonal signal set using Hadamard sequences of length 64. Thus, a 6-bit block of data is mapped into one of the 64 Hadamard sequences. The result is a bit (or chip) rate of 307.2 kbits/s at the output of the modulator.
Symbol scrambler
To reduce interference to other users, the time position of the transmitted code symbol repetitions is randomized. Hence, at the lower speech activity, consecutive bursts do not occur evenly spaced in time. The signal is also spread by the output of the long code generator running at a rate of 1.2288 Mchips/s. This is done for channelization (addressing), for privacy, scrambling, and spreading.
Modulator
The resulting 1.2288 Mchips/s binary sequence at the output of the multiplier is then further multiplied by two PN sequences of length N=215 with rate 1.2288 Mchips/s. This operation creates in phase and quadrature signals. Both the I and Q signals are filtered by baseband spectral shaping filters. The Q-channel signal is delayed in time by one half PN chip time relative to the I-channel signal prior to the base band filter. The signal at the output of the two baseband filters is an offset QPSK signal. Finally, the filtered signals are passed to quadrature mixers. The summed output is the CDMA signal.
Base station Receiver
The base station dedicates a separate channel in order to receive the transmissions of each active user in the cell. Although the chips are transmitted as an offset QPSK signal, the demodulator at the base station receiver employs noncoherent demodulation. A fast Hadamard transform is used to reduce the computational complexity in the demodulation process. The output of the demodulator is then fed to the Viterbi detector, whose output is used to synthesize the speech signal.
Key takeaway
Approach | SDMA | TDMA | FDMA | CDMA |
Idea | Segment space into cells/sectors | Segment sending time into disjoint time-slots, demand driven or fixed patters | Segment the frequency band into disjoint sub-bands | Spread the spectrum using orthogonal codes
|
Terminals | Only one terminal can be active in one cell/one sector | All terminals are active for short periods of time on the same frequency | Every terminal has its own frequency. Uninterrupted | All terminals can be active at the same place at the same moment uninterrupted. |
Signal separation | Cell structure, directed antennas | Synchronization in the time domain | Filtering in the frequency domain | Code plus special receivers |
Advantages | Very simple, increases capacity per km2 | Established, fully digital, flexible | Simple, established robust | Flexible, less frequency planning needed, soft handover |
Disadvantages | Inflexible, antennas typically fixed | Guard space needed (multipath propagation), synchronization difficult | Inflexible, frequencies are a scarce resource | Complex receivers, needs more complicated power control for senders |
Comment | Only in combination with TDMA, FDMA or CDMA useful | Standard in fixed networks, together with FDMA/SDMA used in many mobile networks | Typically combined with TDMA (frequency hopping patterns) and SDMA (frequency reuse) | Still faces some problems, higher complexity, lowered expectations: will be integrated with TDMA/FDMA |
Case Study
Decision-Directed Channel Estimation for Multi-User OFDM
In a multi-user OFDM scenario the signal received by each antenna is constituted by the superposition of the signal contributions associated with the different users or transmit antennas. Note that in terms of the multiple-input multiple-output (MIMO) structure of the channel the multi-user single transmit antenna scenario is equivalent, for example, to a single-user space-time coded (STC) scenario using multiple transmit antennas. For the latter a Least-Squares (LS) error channel estimator was proposed by Li et al, which aims at recovering the different transmit antennas’ channel transfer functions on the basis of the output signal of a specific reception antenna element and by also capitalising on the remodulated received symbols associated with the different users. The performance of this estimator was found to be limited in terms of the mean-square estimation error in scenarios, where the product of the number of transmit antennas and the number of CIR taps to be estimated per transmit antenna approaches the total number of subcarriers hosted by an OFDM symbol. As a design alternative, in a DDCE was proposed by Jeon et al. For a space-time coded OFDM scenario of two transmit antennas and two receive antennas.
Specifically, the channel transfer function1 associated with each transmit-receive antenna pair was estimated on the basis of the output signal of the specific receive antenna upon subtracting the interfering signal contributions associated with the remaining transmit antennas. These interference contributions were estimated by capitalising on the knowledge of the channel transfer functions of all interfering transmit antennas predicted during the (n − 1)-th OFDM symbol period for the n-th OFDM symbol, also invoking the corresponding remodulated symbols associated with the n-th OFDM symbol. To elaborate further, the difference between the subtraction-based channel transfer function estimator and the LS estimator proposed by Li et al. In is that in the former the channel transfer functions predicted during the previous, i.e., the (n − 1)-th OFDM symbol period for the current, i.e., the n-th OFDM symbol are employed for both symbol detection as well as for obtaining an updated channel estimate for employment during the (n + 1)-th OFDM symbol period. In the approach advocated in the subtraction of the different transmit antennas’ interfering signals is performed in the frequency domain.
By contrast, in a similar technique was proposed by Li with the aim of simplifying the DDCE approach of, which operates in the time domain. A prerequisite for the operation of this parallel interference cancellation (PIC)-assisted DDCE is the availability of a reliable estimate of the various channel transfer functions for the current OFDM symbol, which are employed in the cancellation process in order to obtain updated channel transfer function estimates for the demodulation of the next OFDM symbol. In order to compensate for the channel’s variation as a function of the OFDM symbol index, linear prediction techniques can be employed, as it was also proposed for example. However, due to the estimator’s recursive structure, determining the optimum predictor coefficients is not as straightforward as for the transversal FIR filter-assisted predictor.
References:
1. Bernard Sklar, Prabitra Kumar Ray, “Digital Communications Fundamentals and Applications”, Pearson Education, 2nd Edition
2. Wayne Tomasi, “Electronic Communications System”, Pearson Education, 5th Edition
3. A.B Carlson, P B Crully, J C Rutledge, “Communication Systems”, Tata McGraw Hill Publication, 5th Edition
4. Simon Haykin, “Communication Systems”, John Wiley & Sons, 4th Edition
5. Simon Haykin, “Digital Communication Systems”, John Wiley & Sons, 4th Edition.